Lines in the Sand
The Quotedian - Vol V, Issue 112
"Avoid big losses. That’s the way to really make money over the years.”
— Julian Robertson
DASHBOARD
AGENDA
CROSS-ASSET DELIBERATIONS
We ended yesterday’s Quotedian with the comment that a ‘Turnaround Tuesday’ would be very welcome by investors, after three days of nearly relentless selling pressure. So, did they get that reprieve? The answer is a loud and clear: kind of …
Let’s have a look … major indices around the globe closed mostly lower, albeit only marginally so (and most indices closed below the +/- one percent mark):
However, compared to the directly preceding three or four sessions, breadth was substantially more balanced, especially in the US, where for example on the NYSE Composite index (not shown) there were more advancers than decliners:
Four out of the eleven economic sectors in the US market showed a positive one-day performance:
So, all in all, it was a relatively quiet session, especially as compared to the most recent past, which probably means investors are now in a wait-and-see mode ahead of Thurday’’s and Friday’s Jackson Hole meeting of central bankers. If I have got that right, the most expected speech should be on Friday at 4 pm CET, when Jerome Powell, chief stand-up comedian at the Federal Reserve Bank, will take the microphone.
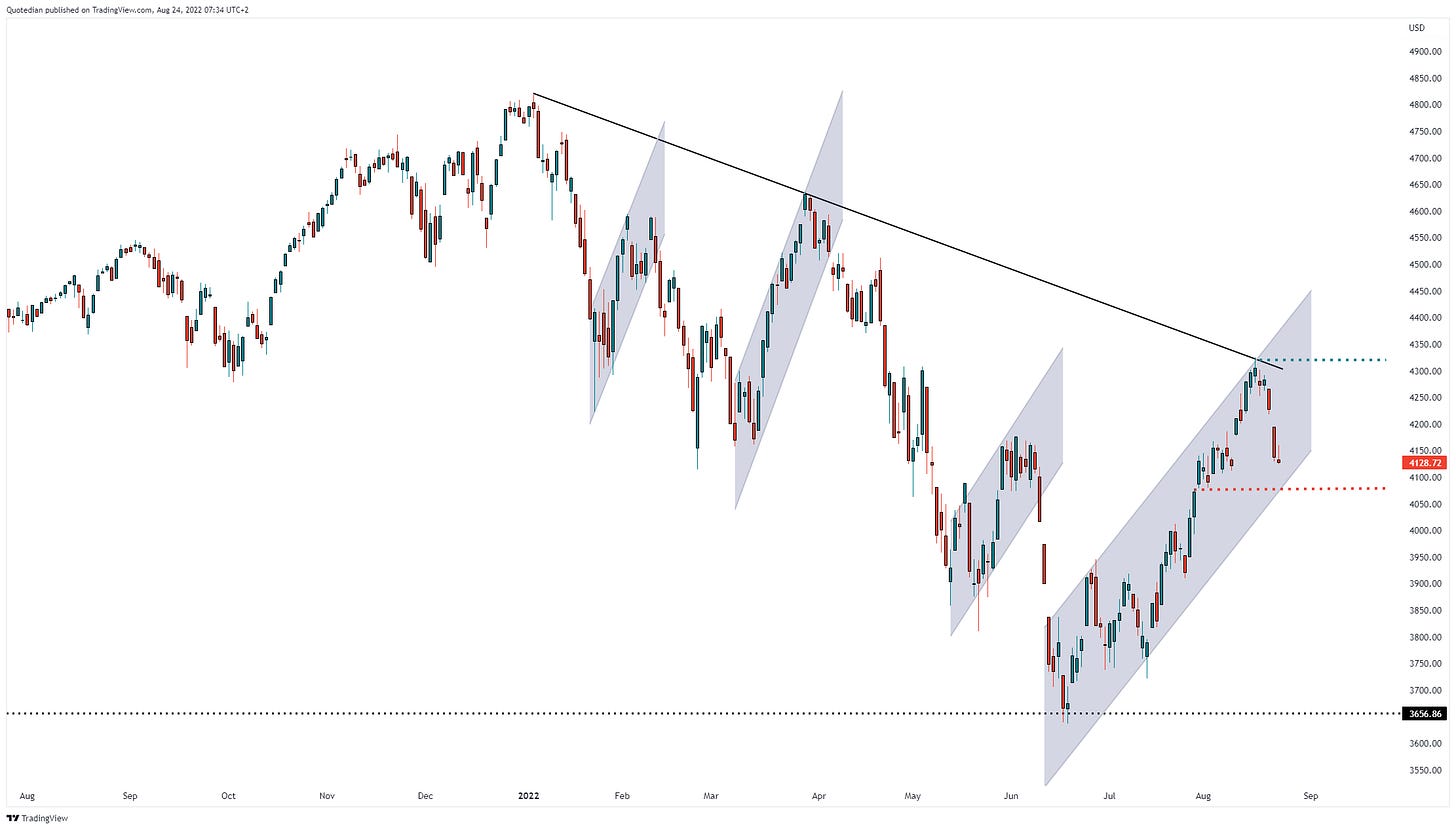
As it was a bit of a more quiet session yesterday, in stocks at least, let’s do something fun here quickly by revisiting the shorter-term chart on the S&P 500 and its lines-in-the-sand.
To the downside, support is at 4,075 (red dotted line), a break confirming the repetition of the pattern in place since the beginning of the year of sharp rallies within the ongoing cyclical(?) bear market and would suggest a retest of the June lows. On the other side, moving above resistance at 4,325 (green dotted line) would largely increase the chances for continued prices ahead and a possible revisit of last year’s all-time highs (blasphemy!).
So, which will it be? Give me your best guess in this quick n’ dirty poll:
Asian markets are mixed this morning, with some markets as Australia, South Korea or India printing green. However, this is more than offset by a relatively larger drawdown in the Chinese and Hong Kong markets, which are seeing a pullback in excess of one percent. European and US index futures are flat.
Moving into fixed income markets, the rise in yields over the past two or three weeks has been quite astonishing, especially in European markets. First, here’s a look at the Bund (German 10-year Government Bond), with an increase in excess of 50(!) basis points since early August:
But even that is dwarfed by the 91 bp increase on the Gilt (UK 10-year Government Bond):
In the US, the curve is continuing its steepening process, albeit still in inversion territory, as shorter-term yields have stopped rising, but rates at the longer end have resumed the upwards trajectory:
In currency markets, the US Dollar took a quick pause to its ascent, with pronunciation on quick. A two-legged rally in the EUR/USD ensued as first European Manufacturing PMI came in a bit less worse than expected (albeit still in contraction territory), with the second leg coming after a slightly worse than expected US Service PMI:
Albeit, as you can see from the two sessions intraday graph above, the rally has largely already dissipated again.
The US Dollar Index (DXY) itself has so far been rejected at the previous high, but given its previous history so far this year, this never has been a longer-term issue:
As a matter of fact, the chart looks like the opposite to the S&P 500 …
Let’s move on into the commodity space, where Natural Gas is continuing to get all the attention. The US pricing version (Henri Hub) hit the USD 10 mark yesterday for a first time in a long time, but then was immediately rejected:
I am not sure how long it will take, but I do think it will eventually move above that mark, and quite substantially so. I had shown this in an earlier issue of the Quotedian (last Monday?), where some analysts expected the gap between European and US pricing to largely close:
Though I am not a great believer in Fibonacci retracement levels, it is still interesting that Gold has found some footing on the 61.8% retracement from the mid-July to mid-Augst upmove:
Not sure, where the time always runs to, as I had much more to show you today, but as I like to say: Time has come to hit the Send button.
Happy Wednesday!
André
CHART OF THE DAY
There was a certain (ridiculous) debate over the past few weeks, whether the US economy was in a recession or not, with the incumbent political party trying to argue the NOT (surprise, surprise).
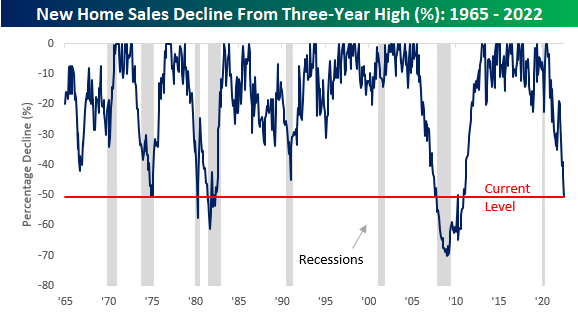
One segment of the economy (which makes up probably 15-20% of the overall economy) is clearly already in recession, namely Housing. And as the two charts below show, contraction to the extent currently seen, has in the past basically always lead to a nationwide economic recession
As shown in the chart below, with the exception of the mid-1960s, every time New Home Sales dropped down to or below current levels, recessions usually weren't far behind.
Not only are New Home Sales at levels usually associated with a recession, but with July's print, they have now declined just over 50% from their recent peak of 1.036 million in August 2020. The next chart shows the rolling level of New Home Sales relative to the trailing three-year high. Going back to the mid-1960s, there have only been four other periods where New Home Sales experienced a decline of 50% or more from a prior three-year high (without another occurrence in the last year), and in every one of those four periods, the economy was either already in or on the verge of a recession.
Not every recession since the mid-1960s has been accompanied by a 50% decline in New Home Sales from a three-year peak, but every 50% decline has been accompanied by a recession.
Stay tuned …
DISCLAIMER
Everything in this document is for educational purposes only (FEPO)
Nothing in this document should be considered investment advice
Past performance is hopefully no indication of future performance


