Mirror Mirror on the Wall
The Quotedian - Vol VI, Issue 14 | Powered by Neue Privat Bank AG
"You don't need analysts in a Bull Market, and you don't want them in a Bear Market"
— Gerald Loeb
DASHBOARD
CROSS-ASSET DELIBERATIONS
Well, good riddance to February, I would say. Those waiting for a pivot got one, but not from the Fed, but rather from asset class performances. After a January that was kind to many equity and fixed income markets, February was a lot about reversal of those trend, aka mean reversion, which also inspired the little picture at the top of today’s Quotedian. The soft and no landing debates came and went, with the hard approach gaining recently focus again.
Anyway, it’s my favourite time of the month where we got to review what happend over the past month and what it means in the context of year-to-date returns, plus we get to look at all these long-term, monthly candle charts.
Therefore, without further ado, let’s dive right in!
Asset management at NPB Neue Privat Bank AG encompasses wealth management for private and institutional clients, the issue of structured products and in-house research. The highly-qualified Asset Management Team combines the latest scientific methods with many years of professional and market experience. Our discretionary portfolio management services focus on capital preservation and cost efficiency, hence, long-term investment success.
Want to find out more regarding our balanced investment strategy? The solution to your investment needs is just one click away:
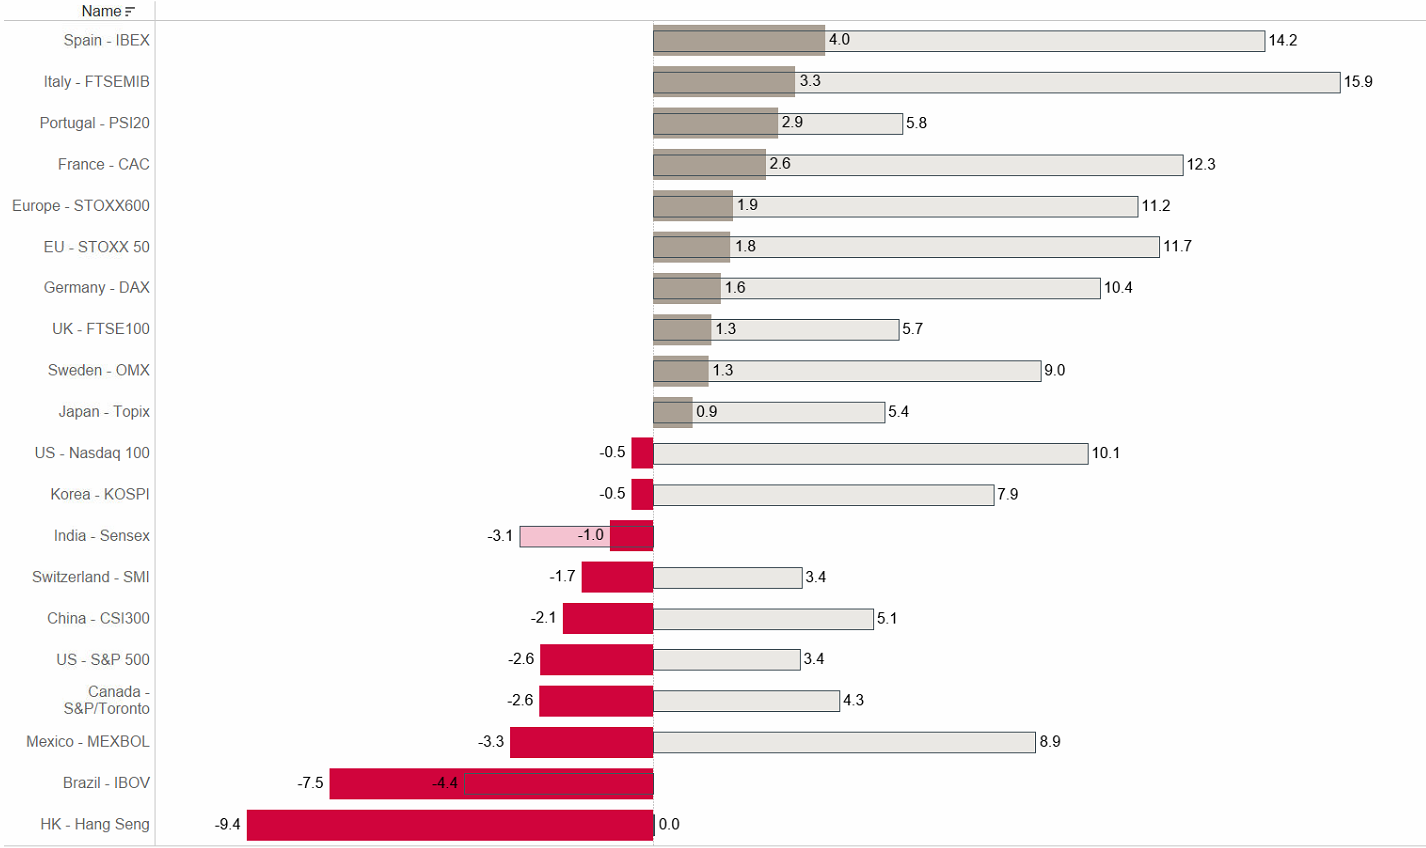
Starting our usual tour-de-force with equity markets, a quick reminder on the statistical graphs to follow: Thick bars represent monthly returns, finer, semi-transparent bars are year-to-date returns (all in percent) and everyhting is sorted by MTD returns.
With this in mind, here are some of the most important equity benchmark indices around the globe:
So, overall the mean reversion I blabbered about at the onset seems not that bad. However, it must taken into account that currency adjusted (into USD) many of the European markets with positive returns above only break-even, if at all:
So, let’s look at some monthly charts then, starting with the almighty S&P 500:
Well, that looks interesting, with the index about in the middle (grey line) of its rising, secular trend channel and the last candle (February) holding above the 10-month moving average.
The Nasdaq-100, with its exposure to longer-duration stocks, looks substantially worse off by trading below the long-term trend channel:
On a positive note, it managed to close above the 10-month MA for the first time since January 2022!
The chart on European equities (SXXP) continues to look substantially more constructive:
Though on a relative basis, the US continues to be the multi-decade winner, despite the recent 'correction’:
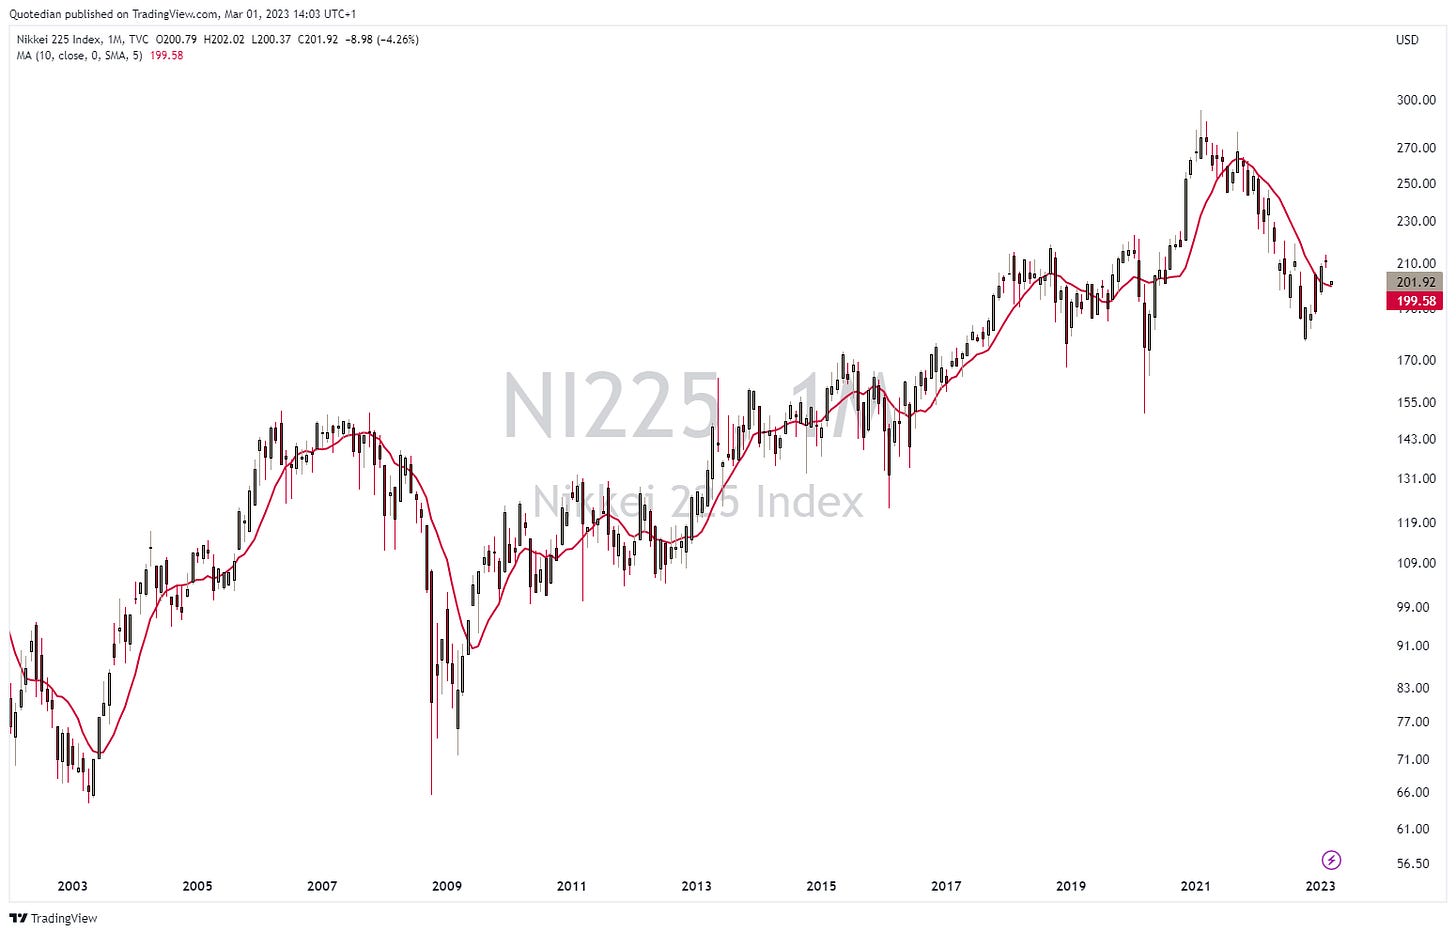
Glancing over to the land of the rising sun, we note that Japanese stocks (Nikkei 225) remain in a very constructive sideways consolidation pattern:
At least as long as we look at it in Japanese Yen … taking the point of view of a US Dollar-based investor, the correction looks a bit deeper and a tad less healthy:
Let’s also have a look at some emerging markets … Starting with Chinese equity, we note that the CSI300 has spent February consolidating some of its strong gains since November:
Turning to India, for sure the Hindenburg report on the Adani Group, which were a major blow to some of the companies listed shares …
… must also have left some scars on the broader market:
NOPE.
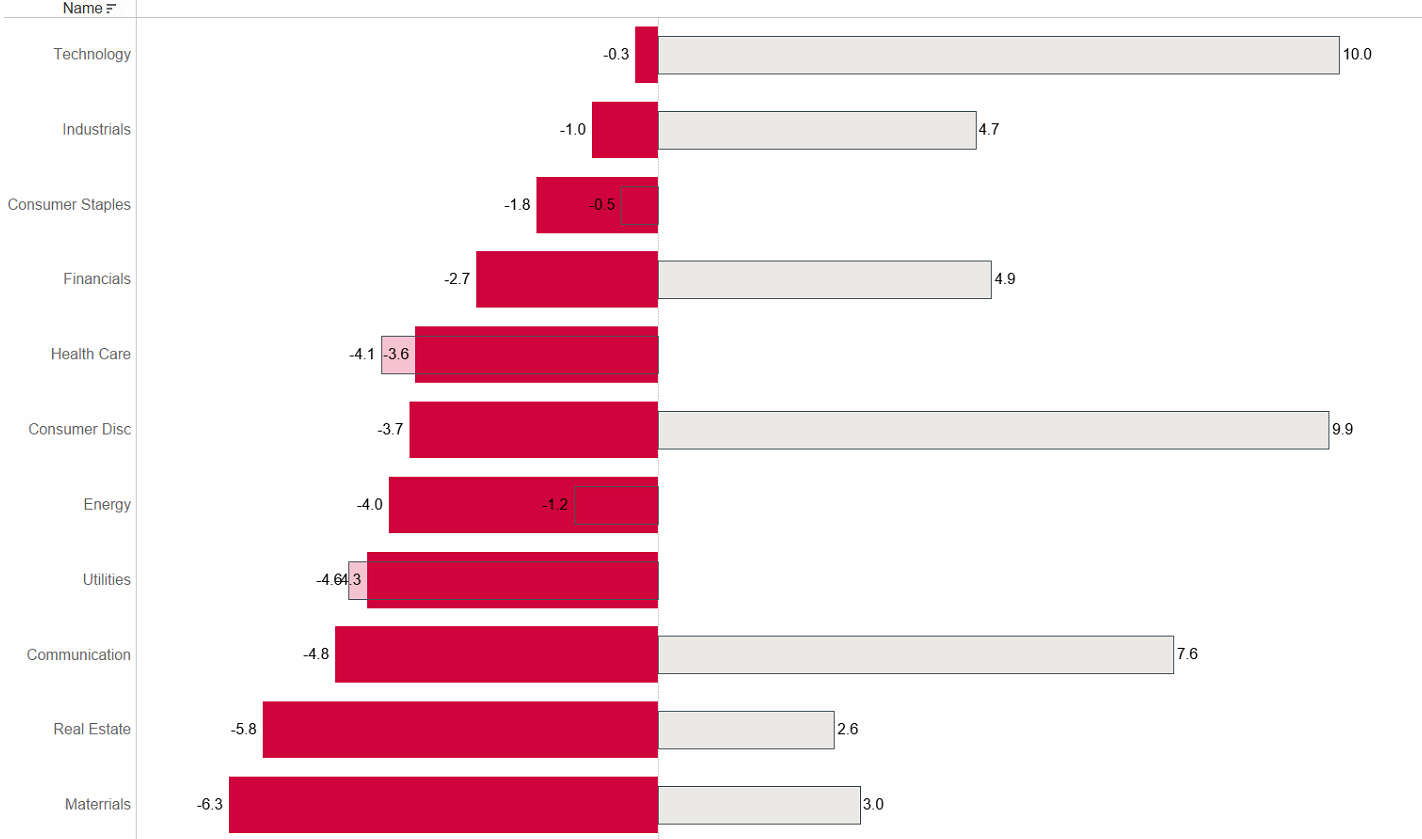
Ok, time to turn briefly to equity sector performances:
Given the pick up in yields, it probably comes at no surprise that Real Estate, Comunication and Consumer Discretionary are amongst the biggest losers of the month - though it is mildly surprising that tech stocks did not fare worse.
One of the
top performing
most hated
strongest underweight
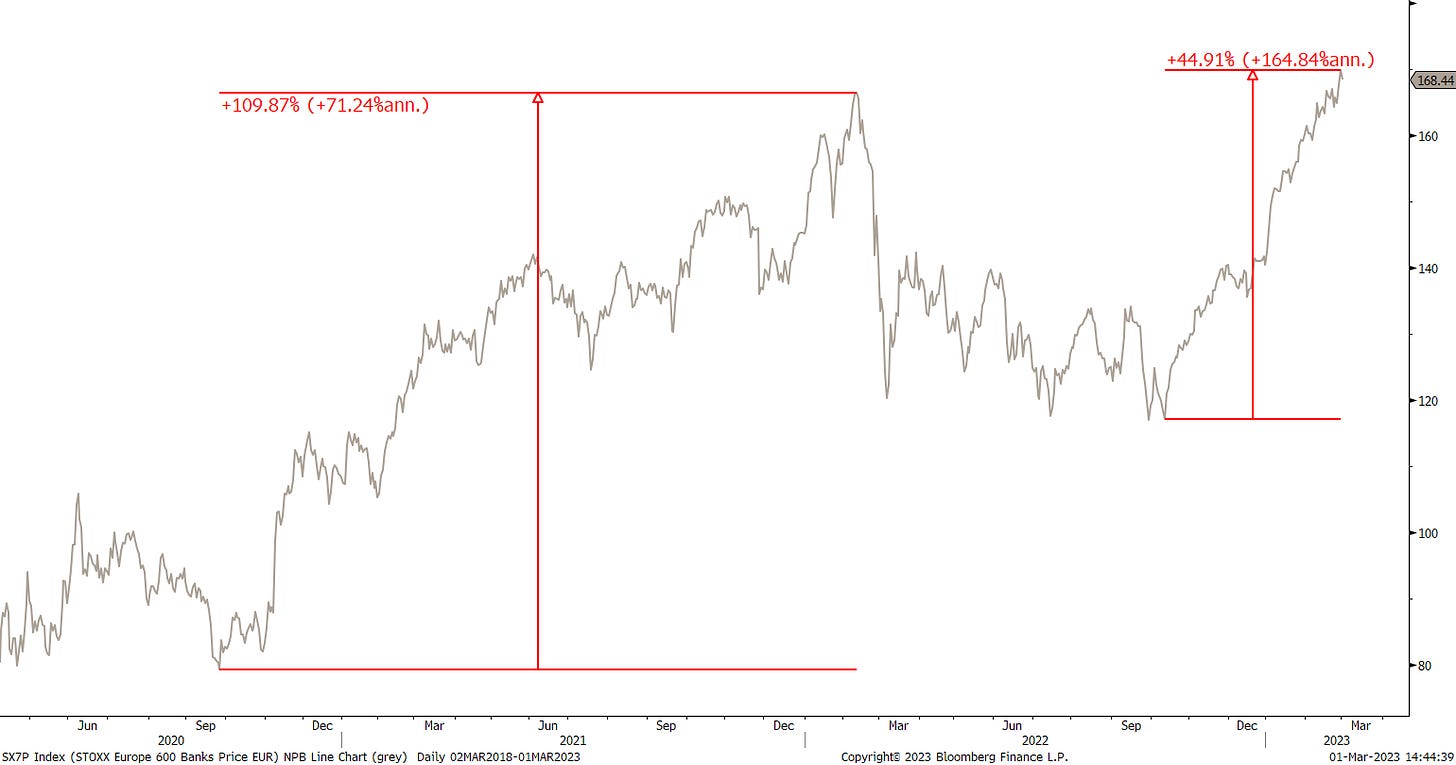
sub industry groups during February continued to be … drumroll … European banking stocks. Here’s the STOXX 600 Europe Banking index. For effect, let me show you a daily chart first:
And here for context of further price potential the monthly chart:
Arguably a bit a possible resistance zone now, prospect remain bright. Not arguably is that the death of ZIRP and NIRP has been the much-needed electro-shock to the European banking industry.
Turning to fixed income markets, no doubt the “Theme” of the month was the pick-up in inflation expectation, which coincide quite precisely with Fed Chair Powell’s comment on February 7th, where he bravely announced that the “disinflationary process” in the US has begun.
See for yourself if you can spot that moment on the chart of the Futures implied overnight rate (hint: to the trained eye, I offer some subtle help to mark that spot):
Of course, this wreaked havoc on bond markets, with most segments giving most or all of their year-to-date gains:
The only true exception were Asian FI credit markets, which are currently in an other point (recovery) of the cycle, after the China induced real estate market melt-down.
Going back to our monthly candle, long-term view, here’s the chart of the one benchmark to rule them all:
In (other) words, rates have risen 8-fold in less than three years. This is prone to cause accidents further down the line in the corporate AND the private sector. For example, here’s the interest paid in the US on credit cards:
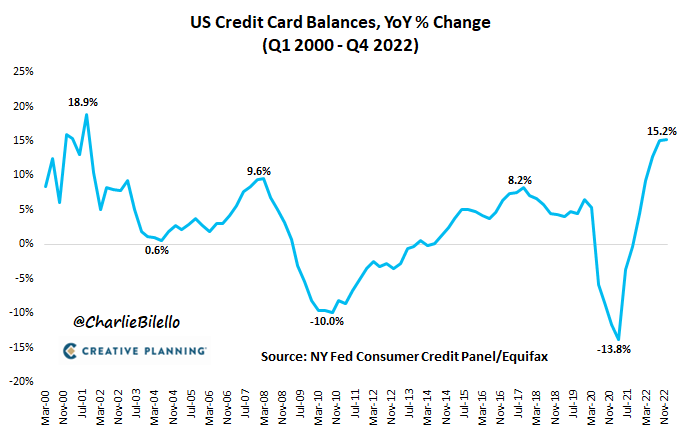
And this just as the US consumer seems to be loading up on credit card debt again:
Would this explain why consumer confidence dropped in February, instead of rising as expected?
Perhaps…
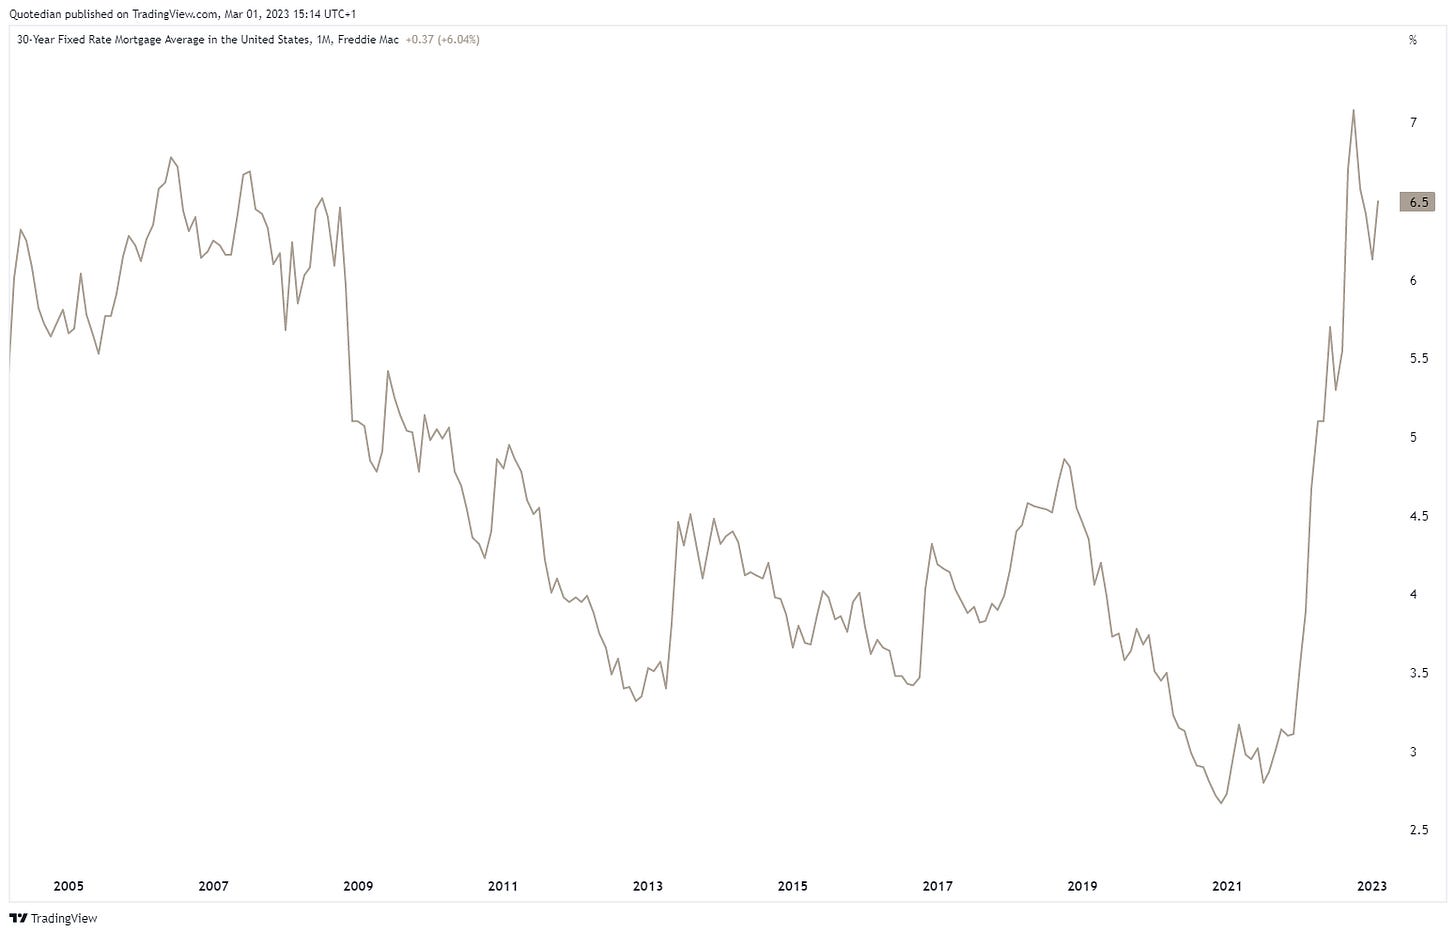
The highest mortgage rate in 15 years, is for sure also not helping, especially given the steepness of the rate-of-change:
No wonder the Homebuyer Affordability Index has seen its steepest drop in recorded history:
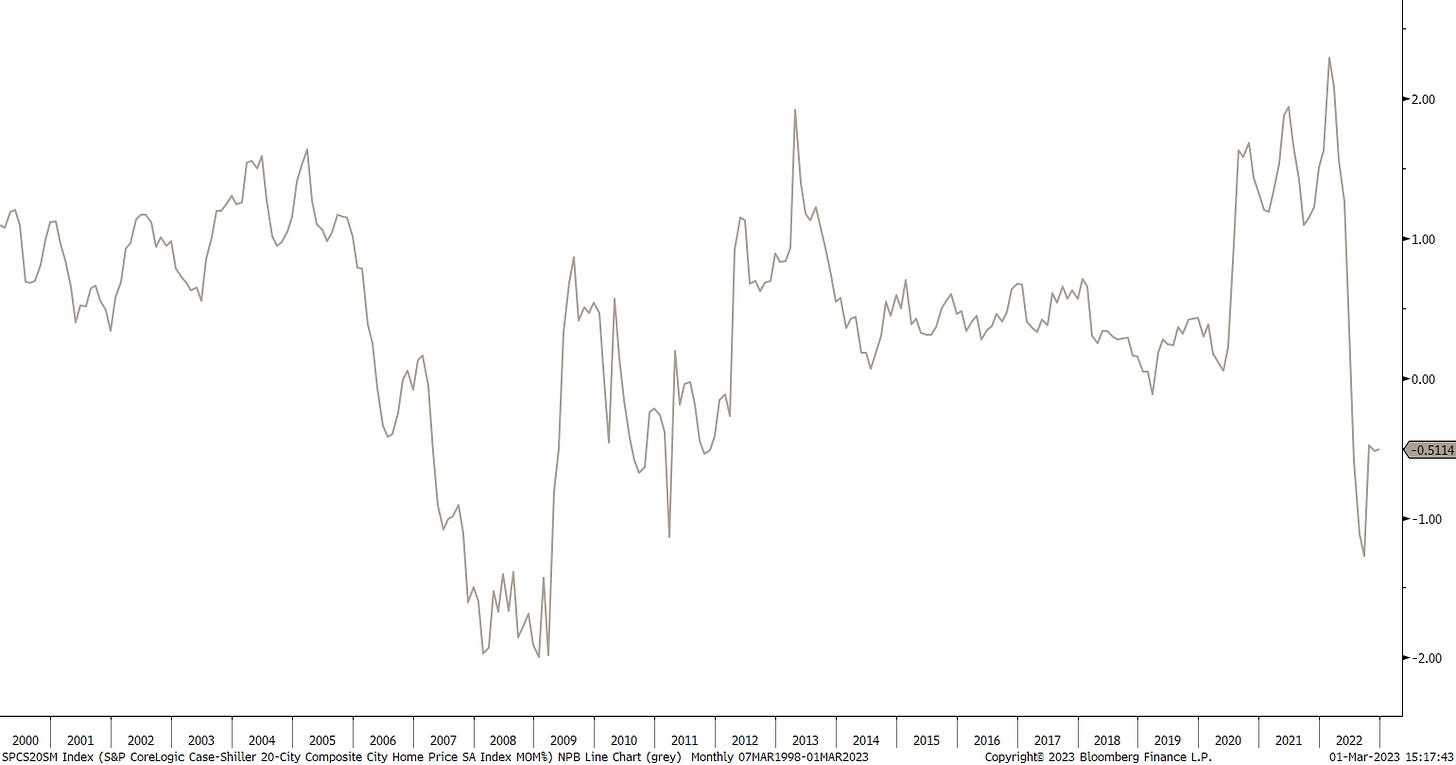
Which in turn has lead to a notable drop in housing prices:
Of course, we have already discussed on several (uncountable) occasions the “invertidness” of the US yield curve, but let’s have a look once more:
And let’s use this as a segue into European rates, where the inversion is not as deep as it was during the German recession following the Wiedervereinigung, but still more than noticeable:
Credit spreads picked up a tad in February, but are far away from distressed levels:
In currency markets, February marked the month where the US Dollar confirmed the (temporary?) end of its downturn in place since October of last year:
As a matter of fact, the US Dollar Index (DXY) registered its first up (grey) candle since September of last year:
For now, and talking strictly secular, the EUR/USD remains in a multi-decade downtrend, and only a move above 1.15 would mark the beginning of the end to that:
Similarly, the British Pound has stalled at the ‘correct’ level (grey zone - no pun intended) and downtrend resumption and acceleration are now at the forefront:
Let’s turn to Bitcoin for a second and discover the beauty of log charts-
Same chart, log:
and no-log:
What a bad joke!
In any case, two observations:
The zone between 15,000 and 16,000 seems important on a secular basis
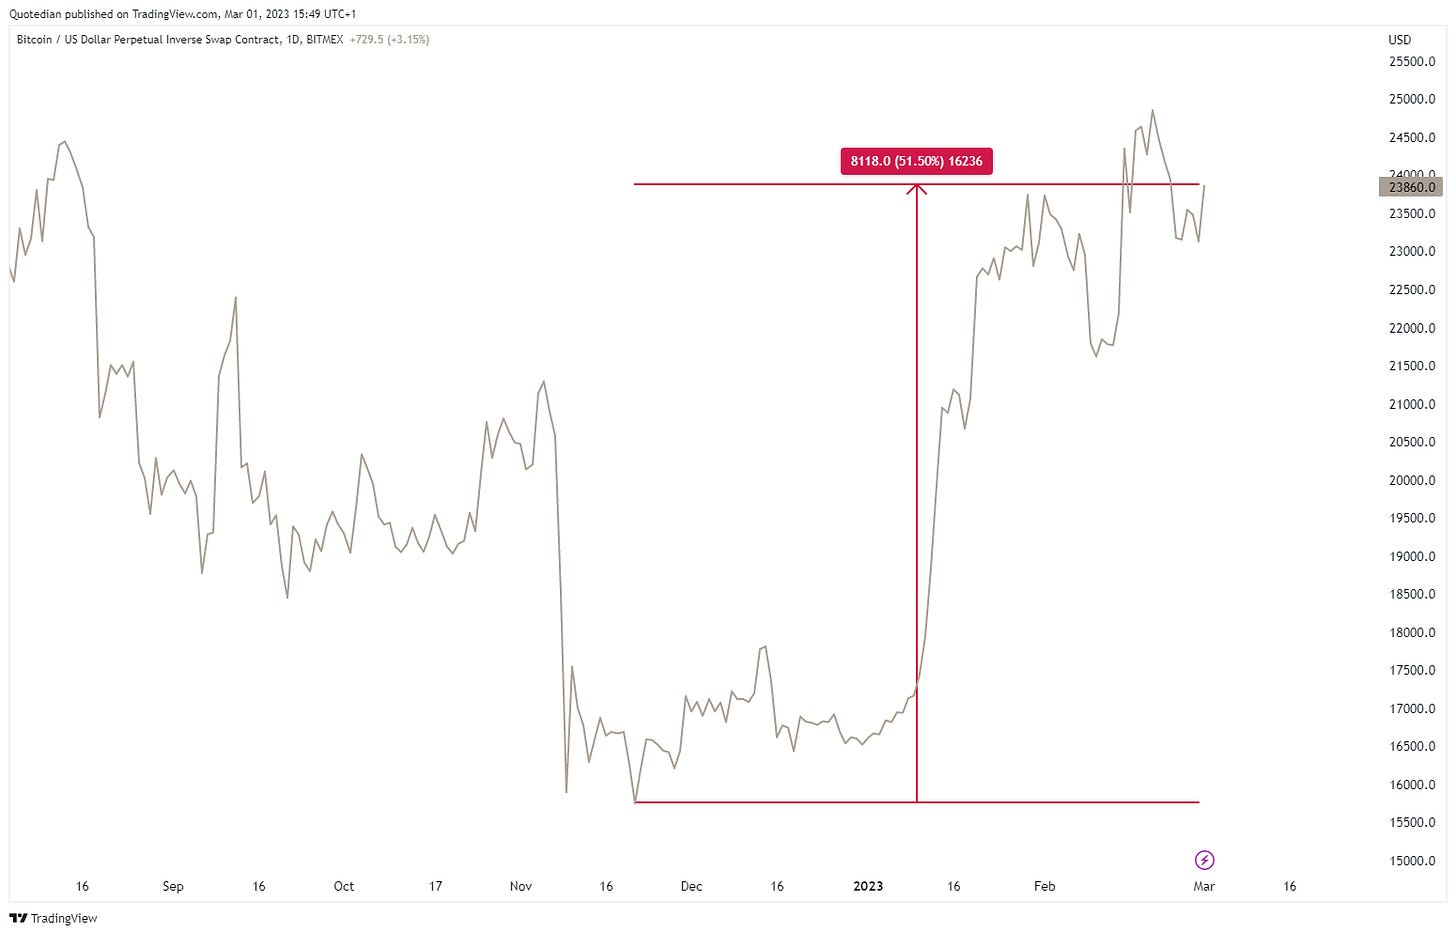
Zooming in, since November ‘22, Bitcoin is up >50%:
Ok, time to wrap up with commodities, where we look at the major commodity ‘sectors’ first:
Not a lot of mean reversion there as a matter of fact, rather mostly trend continuation.
Going a step more granular and looking at the performance data of some popular commodities, to no surprise are the trend continuations (up and down) in the preceding graph also observed at futures level:
One commodity standing out is Natural Gas, down YTD drop registred as -37.9% hides that NG was down >50% and is up >30% over the past two weeks:
Two more monthly candle charts and we’re done!
Here’s Gold, where the recent drop in Febraury has been painful, as it came just as many market observers started paying attention again:
Though overall, this chart remains constructive to me.
And last but not least …oil!
Basically, we are looking at three months of nothingness, in an ever tighter range:
Resolution coming to a chart near you soon?
Ok, enough for today. As always, feedback and/or comments highly welcome:
As are your likes ;-)
Best,
André
CHART OF THE DAY
No comment:
Thanks for reading The Quotedian! Subscribe for free to receive new posts the moment they are published.
DISCLAIMER
Everything in this document is for educational purposes only (FEPO)
Nothing in this document should be considered investment advice
The views expressed in this document may differ from the views published by Neue Private Bank AG
Past performance is hopefully no indication of future performance


