

Mountain Ranges
The Quotedian - Vol VII, Issue 22 | Powered by NPB Neue Privat Bank AG


“The difficulty lies not so much in developing new ideas as in escaping from old ones.”
— John Maynard Keyenes


No, this Quotedian is not about the epic flooding in Zermatt (click here) at the foot of Switzerland’s most iconic mountain. Nor is it about this majestic piece of rock itself.

Rather, we refer to last week’s decision by the Swiss National Bank (SNB) to cut rates for a second time, making look the rate hikes and subsequent cuts like up the hill and right down the hill again, which stands a bit in contrast to other major Western central banks, where the mountain range looks more like the Tibetan Plateau. Here’s a good graph from the highly esteemed John Authers at Bloomberg:

Wondering where interest rates are heading? We can help you.

Contact us at ahuwiler@npb-bank.ch
Before we dive in to today’s letter, here a little warning regarding its length: it will be awfully short, as all my little helpers have gone surprisingly and not so surprisingly on sick leave.

Hence, without further ado, let’s dive!


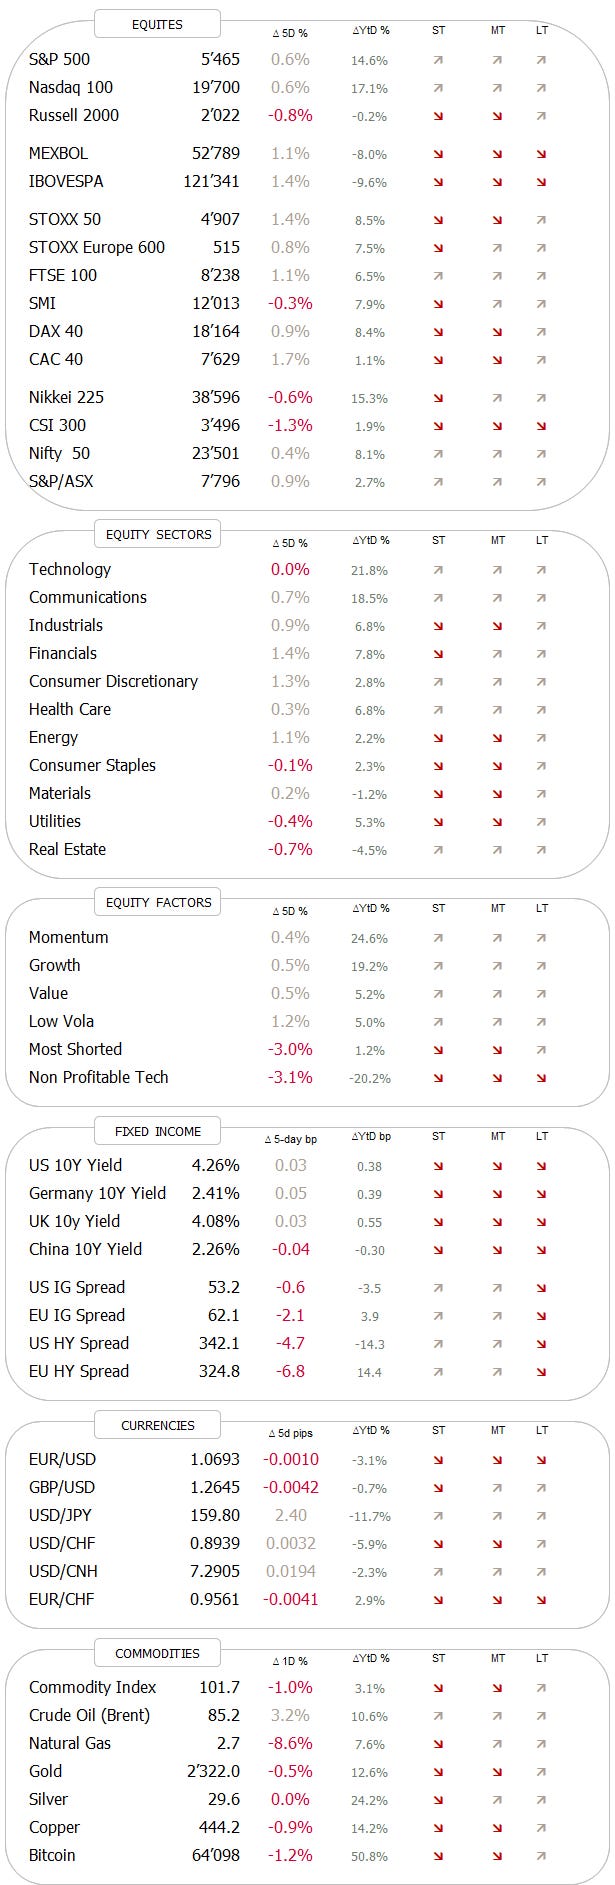
To get us going, here’s how did the most widely watched equity benchmarks fare last week:

Interesting. We see European equities, above all Italian and French ones, leading last week’s winners. Hence, we can conclude, that our fear of further fall-out from French President Macron’s faux-pas, as expressed in last week’s Quotedian titled “Oh La La” (click here) has not materialized … yet!
On the other side of the performance gamma we see Chinese and Japanese stocks giving back some … but nothing too much to worry about … yet!
Time to look at some chart, starting with the almighty S&P 500 (aka the Mag-7 plus some 493 other distracting constituents):

Still bottom left to top right - nothing to complain about. But what about all that poor breadth?

I said poor breadth, not bad breath!! (note to self: fire the GIF-master).
Our suspicion would be that the Mag 7 are at it again then. Here’s last week’s heatmap, i.e. the performance over 5-days for the S&P 500 constituents:

Not so much, actually, with three Mag 7 stocks, including two of the three largest, actually down on the week.
Here’s a chart of the S&P 500 equal-weight version:

AHA! No new high since March 28th, that’s elementary!

But what will be really interesting to observe here is in which direction the EW-index will break out (and technical analysis suggest that a break should happen soon, as we are already in the last third of the triangle). A break higher would mean a broadening of the rally and continuation of the melt-up into the US elections we have been writing about.
An ever so slightly improving breadth picture (lower clip), with the number of stocks above their 50-day (blue) and 200-day (red) moving average suggest that this may just be what is going to happen:

Let’s have a look at our (European) market now. Here’s the STOXX 600 Europe index:

The index dropped briefly (circled) below an important support level (dotted line), but was able to regain lost territory quickly again. That’s a positive. Now, it needs to hold to remain constructive.
Any insight to be gained here looking at the equal-weight version?

Not really, other than breadth seems broader here, to the up- and the downside.
The chart of the CAC-40 (France) looks intriguing, where the election-calling sell-off induced by Macron made the index EXACTLY close the gap open from January 25/26:

UK stocks (FTSE 100) may have ended their short-term consolidation:

Over in Japan …

… the consolidation of the gains from November to March continue. I think investors into the land of the rising sun are more focused on the Yen and the JGBs for the time being.
In India, the election hump and dump seems to be left behind now:

Ok, quick glance at sector performance before we have a look at the top performing stocks and then head over into the rates section. Here are global sector performances of last week via the Bloomberg index series:

Nothing particularly sticks out - at least not to my untrained eye.
Let’s have a quick look on what our proprietary aReS momentum model likes and what not:

Tech (light green) and communications (blue) still interchanging top two positions, whilst energy (dark green) after a quick rise from the bottom to the very top has submerged right to the bottom again.
Here I had an interesting thought whilst sweating it on the treadmill over lunchtime:

We definitely should also look at equal-weighted sectors in this model, in order to water down the mega-cap factors.
To finish the equity section, let’s have a look at the top performing 25 stocks in the US and Europe year-to-date and how they have done over the past five sessions. Starting with the US:

Overall, we see some consolidation having being going on over the past few sessions amongst the top performers.
However, seeing that NVDA is at second position, up “only” 155% year-to-date, makes me giggle again at following headline, out last Friday:
Falters definition in dictionary:

And here’s the NVDA chart as a reminder:

Anyway, on to the top 25 performing stocks in Europe this year:

Europe’s elite performers have been in a less corrective mood, largely probably because they did that the previous week already.

Let’s start with Swiss rates, where the SNB as outlined at the beginning surprised most market participants, including us, with a second rate cut this year. But even more interesting than the rate cut itself is the market’s reaction to the cut:

If investors were worried about future inflation they may have sold off longer-term bonds, which they clearly have not, as the 10-year yield (see chart above) further dropped post-announcement.
The remaining question than could be: What does the SNB (and the bond market) know that others seemingly do not?
In the US, the 10-year US treasury yield is largely living up to our “Muddle Through” thesis highlighted in our 2024 outlook (click here):

In Europe, despite the dust settling somewhat over the French panic of two weeks ago, the OAT-Bund spread remains wide, showing some unease still by the bond market:

Some have suggest to go long Italian bonds (red line) and short French bonds (grey line) as the former continues to pay close to 80 bp more but arguably is showing stronger financials:

The French situation had also impacted corporate credit spreads (red):


In currency markets, the US Dollar Index chart is clearly … confusing!

The EUR/USD for now is holding on key support and maybe, just maybe, be on a rebound to the upper end of the triangle:
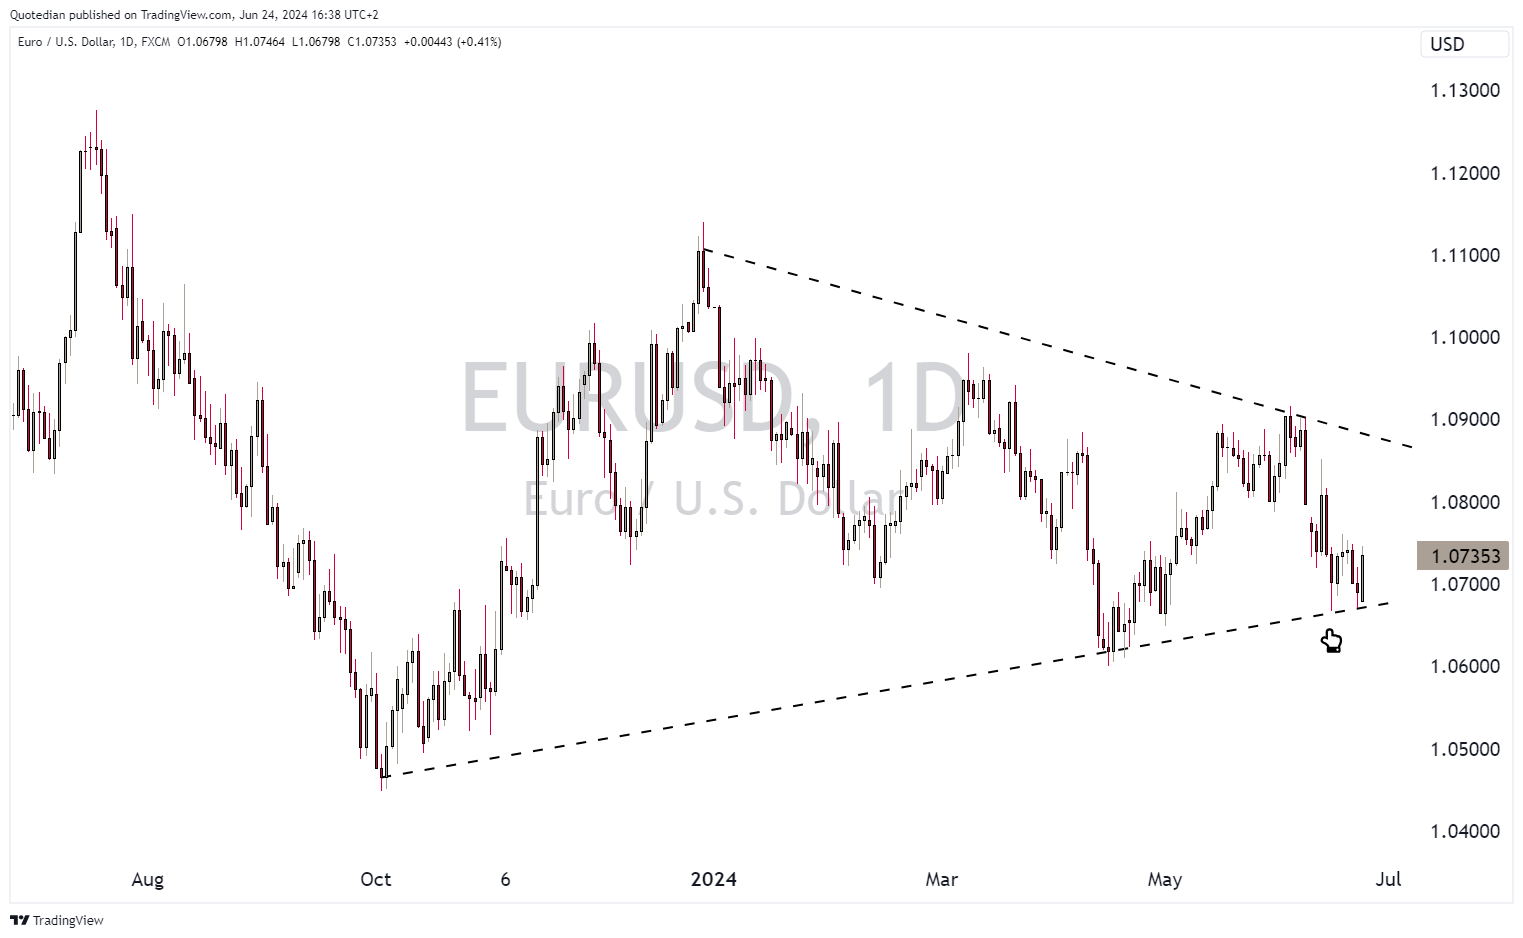
This could be especially true if incoming economic data in the US continue to surprise to the lower side,

increasing odds for a July or September rate cut,

or a complete end to QT.
In the meantime, USD/JPY traders in the meantime are teasing the BoJ/MoF again at 160:

This will end in tears, eventually.


Here are the commodity winners and losers of last week:

Gold has clearly gone into a consolidation period:
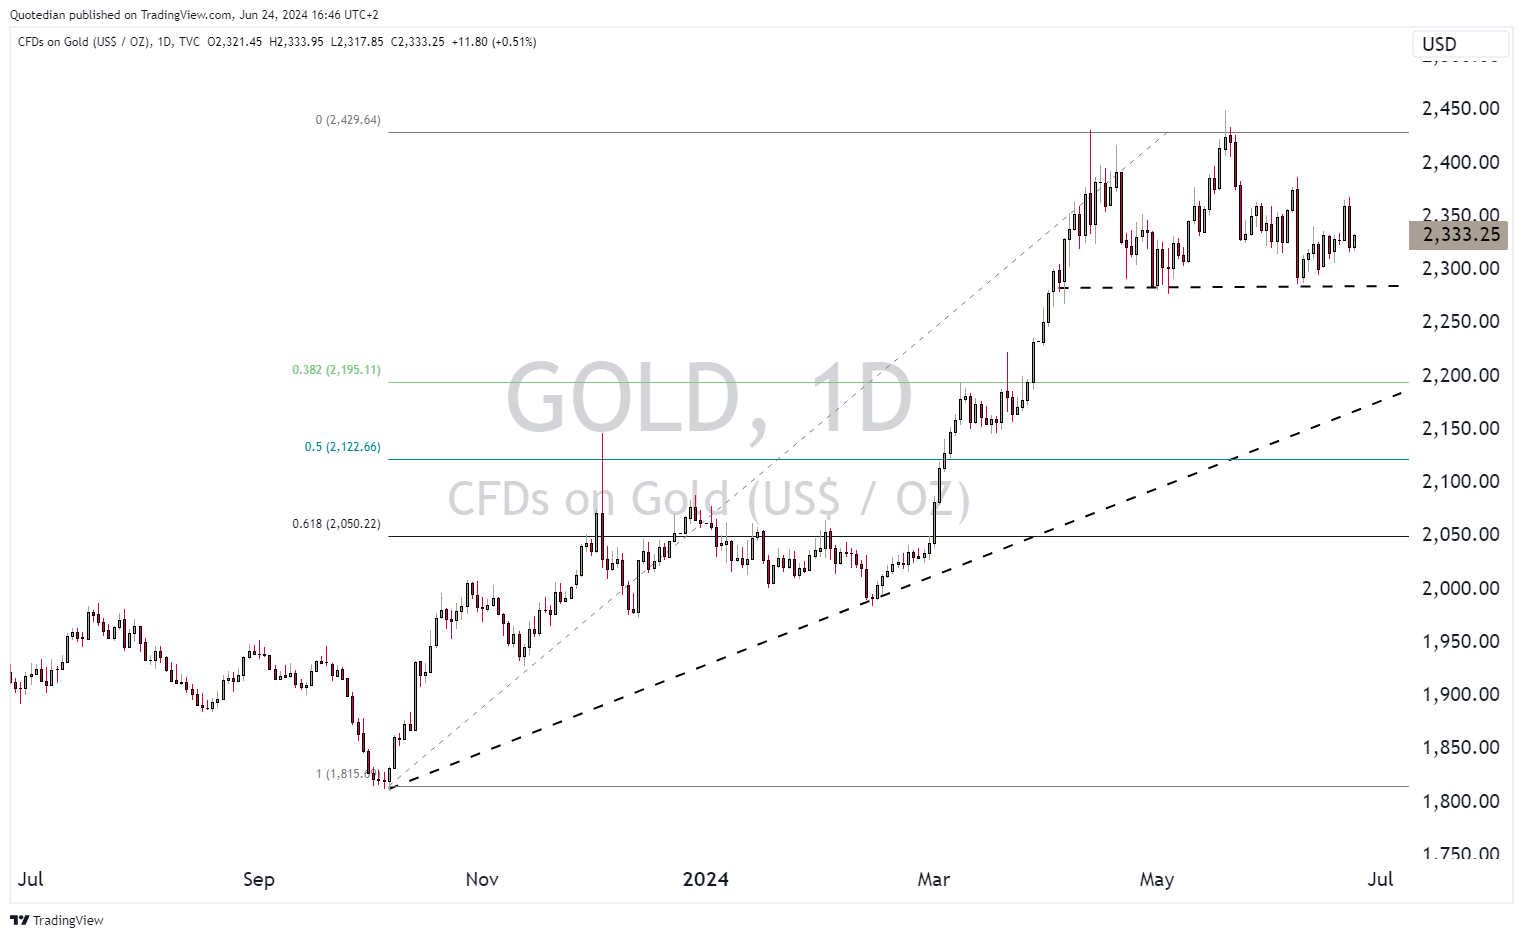
The risk remains to the upside, but this is gold, and it at anytime could also fall back to $2,200, which would fit nicely on the chart above.
But one of the best performers of last week was Brent, creating an even messier chart if possible at all:

But let’s finish the commodity section with the absolute star performing commodity in the Chart of the Day/Week section below. Let’s see if you can guess what it is:

And as you are close to the bottom of the page anyway when looking at that chart, make sure to scroll a little lower and hit that damn’ LIKE button! TA.
André

Yes, sounds a bit like advocate, but in reality is Avocados!
Up 44% in a week and up 170% since the March low - not too shabby at all!


Everything in this document is for educational purposes only (FEPO)
Nothing in this document should be considered investment advice
The views expressed in this document may differ from the views published by Neue Private Bank AG
Past performance is hopefully no indication of future performance
Nice Quotedian as always!! I have to say that avocados are soooooooo overrated🤣