My Holiday, Your Problem
The Quotedian - Vol VI, Issue 55 | Powered by NPB Neue Privat Bank AG
“I’ve been to almost as many places as my luggage.”
— Bob Hope
DASHBOARD
AGENDA
CROSS-ASSET DELIBERATIONS
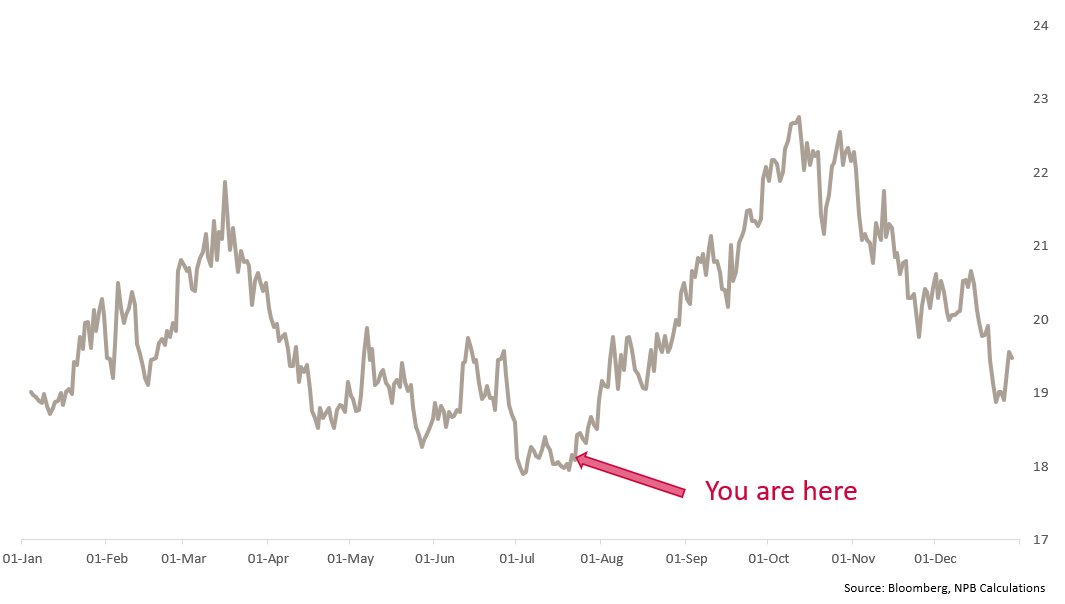
So, here we are, at the start of my holiday, which often coincides with a sharp increase in volatility on financial markets. Of course, it has nothing to do with my office absence (or so I hope), but rather with a not untypical pick-up of volatility during the summer months. Here’s a seasonal chart on volatility (VIX), which was included in our quarterly chart-pack released some two weeks ago:
You can find the full chart-pack here (← by here we mean that you have to click on here …. ah, never mind!)
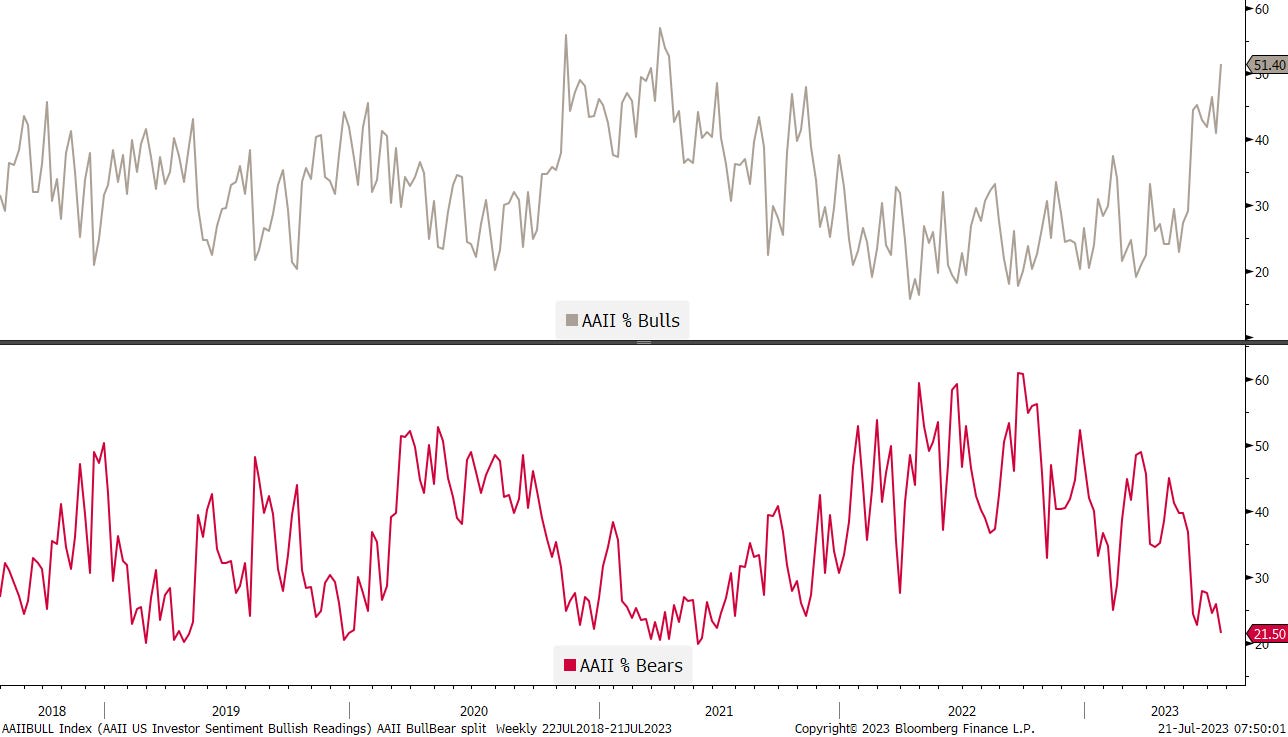
And sentiment is setting itself quite nicely up right now, as the weekly AAII (American Association of Individual Investors) survey data released yesterday showed:
The graph explains that bears are scarce, whilst there haven’t been as many bulls for months years.
Too complicated a chart? Maybe the meme shown below and posted on Twitter by Stocktwits yesterday explains it better (we are at bottom right now):
In any case, and as we wrote in the aforementioned NPB chart-pack, higher volatility does not equal lower stock prices, but it does mean o.p.p.o.r.t.u.n.i.t.y.
Hence,
The good old Quotedian, now powered by NPB Neue Privat Bank AG
Looking for fine investment advice as such fund in the chart pack (y)?
Contact us at info@npb-bank.ch
Let’s have a look at some of yesterday’s market action and some generally interesting charts.
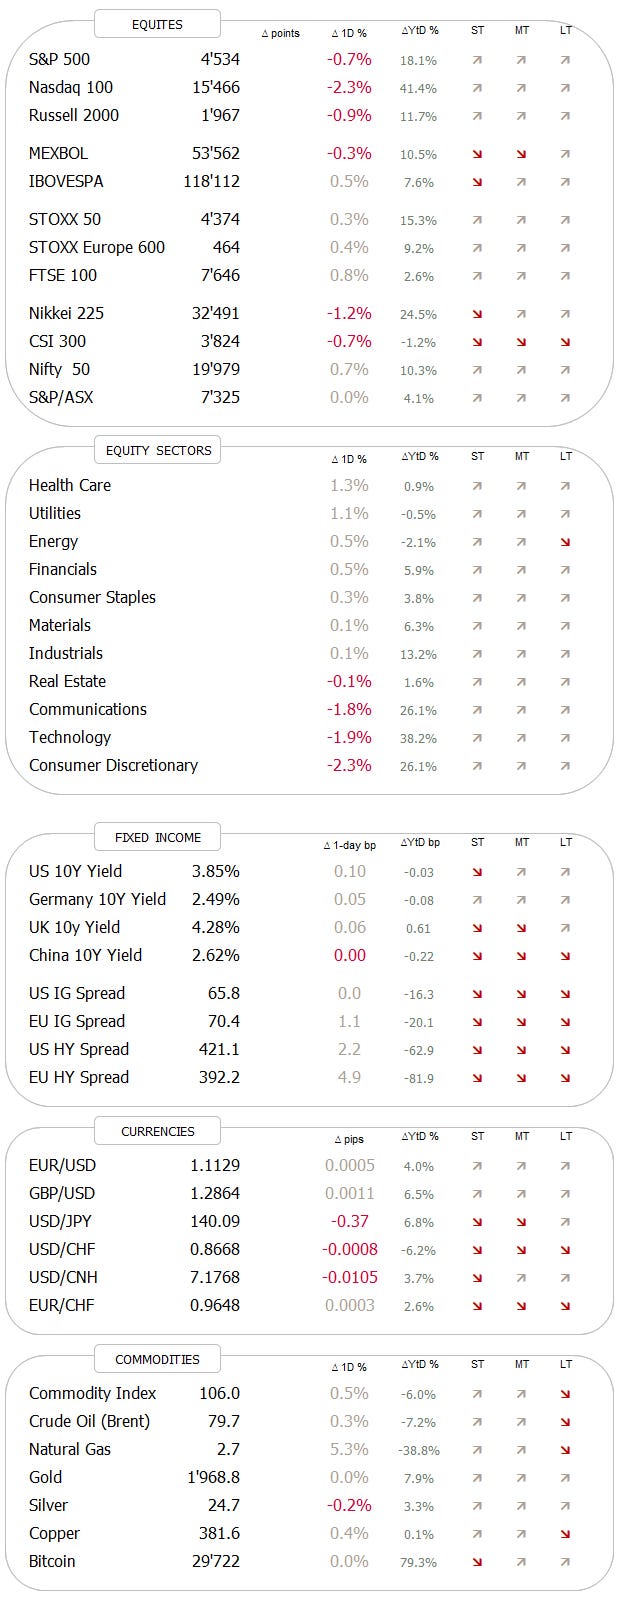
US stocks sputtered in yesterday’s session, with of the major indices only the Dow Jones Industrial eking out a gain (+0.47%). Three stocks (JNJ, GS, BA) were responsible for nearly all of the points gained.
Despite seeing more advancers (286) than decliners (217) on Thursday, the S&P 500 still had to report a retreat of two-thirds of a percent. A cursorary glance at the market map quickly reveals that it was the ‘big guns’ that were responsible for the index’ negative print:
And sector performance will act as spoiler alert of what the Nasdaq did yesterday:
Indeed, did the Nasdaq gap 0.7% lower at the opening and then never looked back to close the day 2.3% down:
FWIW, it was the index’s worst day since February 23rd:
So, what was the reason for this meltdown (that sounds a bit too dramatic, but we’ll leave it stand anyway, as it so nicely fits today’s narrative)? Earnings or economic data?
Exactly.
Both!
Just scroll back up to the market carpet, to see how sensitively Netflix (-9%), but especially Tesla (-10%), both reporting after Wednesday’s closing bell, had reacted to their earnings numbers.
And on the economic data front, an Initial Jobless Claims number reported (228k) yet again below expectations (240k), put upside pressure on bond yields, which for once (and correctly) manifested itself also in a sell-off in growth (long-duration) stocks.
Asian markets are mostly following the US template of lower prices this morning, with all most important regional indices (Jpaan, China, India) show retreats between half and a full percentage point.
European futures are also down this early Friday, which comes as no surprise, as they missed most of Wall Street’s downside, as most losses manifested themselves after the continental closing bell.
In bond markets, we already established that a strong jobs number put upside pressure on yields. The intraday chart of the US 10-year treasury looks as follows:
A 10 basis points intraday jump is not a minor feat … on the daily chart, the picture looks more and more confusing, as yields are kissing the upper end of the trend channel again, only two weeks after the failed breakout (oooppss):
In theory I wanted to highlight this chart today, but i.o. sticking it into the COTD section, I’ll just burry it here and hope it goes unnoticed:
It shows that the spread (grey histogram) between commercial hedgers (grey) and speculators (red) that US Treasuries (blue line) is at its widest in at least 10 years. Last time (2018) it was nearly as wide, and a very tradable rally in treasury bonds ensued. Stay tuned, as somebody I know would write here now …
The Dollar advanced for a third consecutive yesterday, not least on the back of the strong employment number and the ergo higher bond yields.
On the Dollar Index (DXY), the greenback is already back to key resistance (previous support) at 101.00:
But versus the glittering wonder that is the Euro, support (ex-resistance) lays a bit lower at 1.1060ish:
Nothing specific stood out (to me) on the commodity side, so let’s call it a day here, but not without a small summer poll before we head off to the beach.
So, finally, regarding the publishing schedule, unless there is a major market upheaval you will not here from me for the next two weeks or so. Then we will probably go on a publishing schedule "light” during August and back to the Full Monty in September.
Want to leave your comment or best summer wishes. Use the comment section:
Take care and use sunscreen!
André
CHART OF THE DAY
Me and I debating at Tuscany beaches over the coming weeks:
Thanks for reading The Quotedian! Subscribe for free to receive new posts the moment they are published.
DISCLAIMER
Everything in this document is for educational purposes only (FEPO)
Nothing in this document should be considered investment advice
The views expressed in this document may differ from the views published by Neue Private Bank AG
Past performance is hopefully no indication of future performance


