Newton's Third
Vol VII, Issue 42 | Powered by NPB Neue Privat Bank AG
“What we know is a drop, what we don't know is an ocean.”
— Isaac Newton
Of course, we all remember from our geography classes (that’s a joke, I know it was biology classes) Isaac Newton’s famous third law:
“Whenever one object exerts a force on another object, the second object exerts an equal and opposite on the first.”
Which, is popularly expressed as “For every action, there is an equal and opposite reaction”.
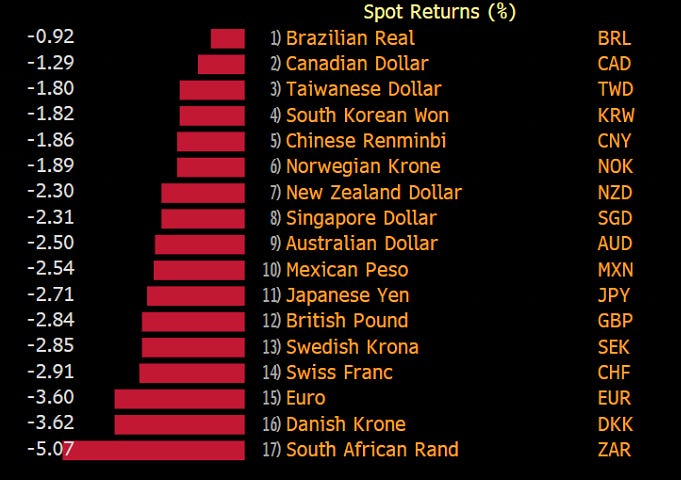
This raises the question whether currency markets are expressing the view that if non-US countries are going to be hit by US tariffs on their exports, a weaker non-US currency is needed to at least partially offset any potential tariff-pain …
If such is true, and I assign an elevated probability to that, than currency movements since election day should give us a clue which country will receive the highest (adjusted) tariffs slapped on:
The other explanations for a suddenly substantially higher Dollar are much more painful, as the best contenders would be 1) sky high inflation forcing the Fed to drastically increase the monetary policy rate (and/)or 2) too high indebtness forces the treasury to pay much more for new debt issued. Both would lead to higher interest rate differentials, possibly pushing the Dollar higher (before much lower).
NOW, before you go and change all your foreign currency into US Dollars, make sure to read right through to the end …
After this opening paragraphs full of joy and happiness, let’s start with our weekly cross-asset review!
There is a high chance that an intermediate-term, multi-week top for stocks is in.
Calling a “top” has been an extremely perilous thing to do over the past two years, and in general, the trend channel of the S&P 500 returns higher since the GFC is plastered with the corpses of investment gurus calling for “the top is in”.
And I would be a fool to cry wolf “guaranteed” here, but chances for a multi-week correction until the onset of the Santa Claus rally have increased. And much more than a bearish call, this is a low-risk recommendation to maybe take a couple of chips off the table, with the maximum “loss” being less than three percent away, if we take the S&P 500 as a global risk-on/risk-off measure.
Let me explain:
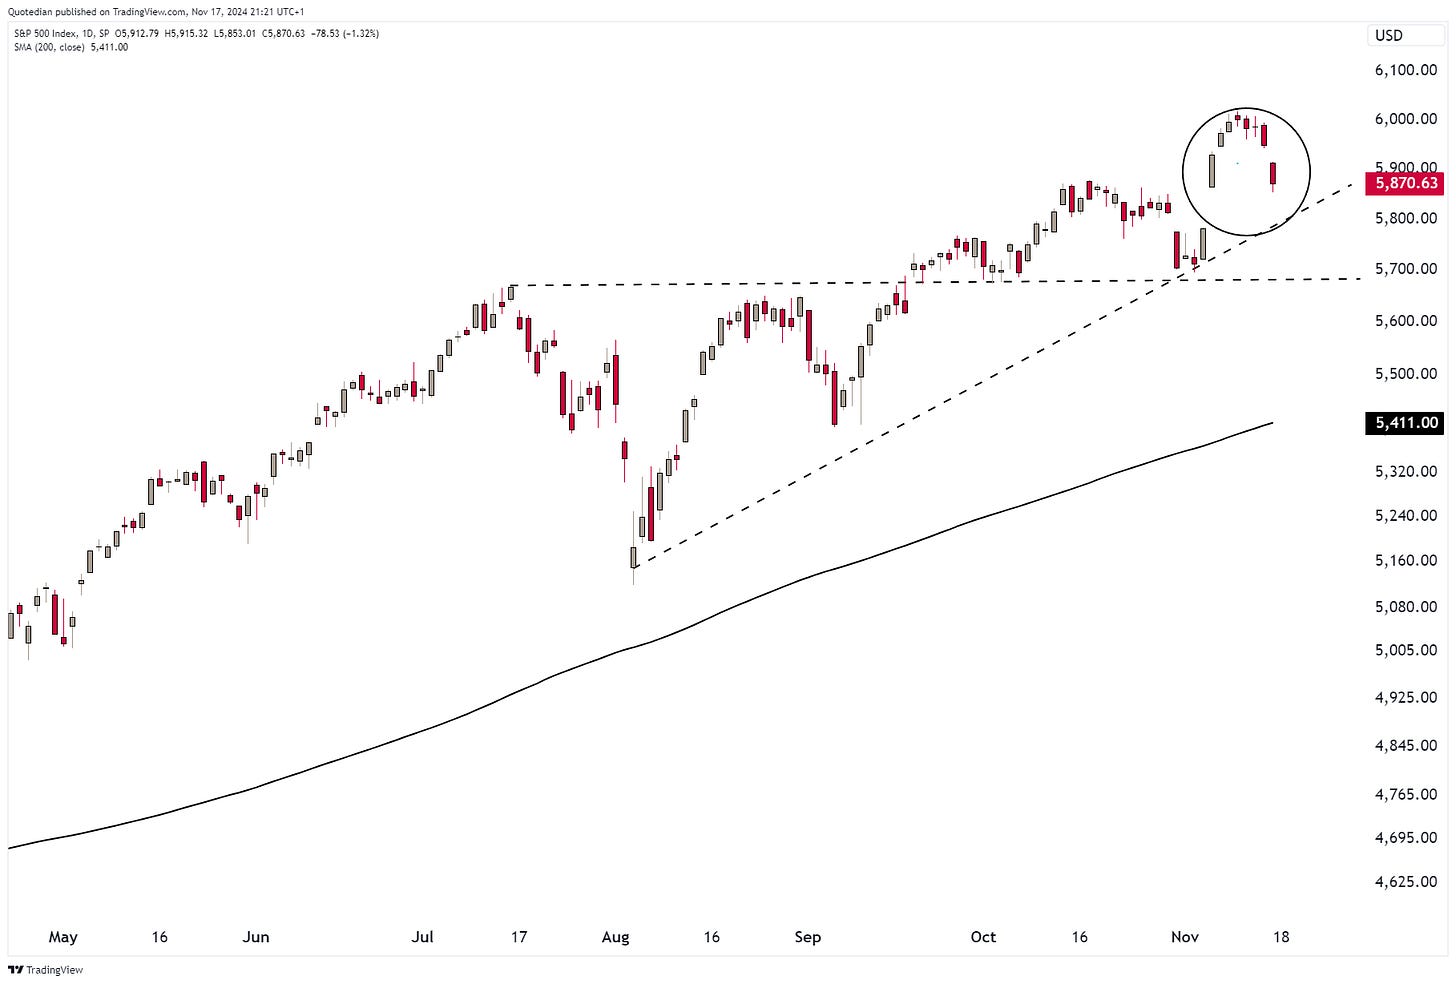
The US equity market, depicted via the S&P 500 chart above, is about to create a island reversal pattern. Sounds too complicated or too sexy? It’s easy … a gap (post-election) higher, followed by a “call to reality” via a gap lower. The good thing here is that we have several levels of risk-on/risk-off very close by.
E.g., shorting the market here carries a risk of 2.5%, i.e. reaching a new ATH should be your stop loss in case you are short. On the other side, if you decide to reduce risk/short at current levels, add to that trade below 5,700 for an intermediate target of 5,400.
Easy, ain’t it
The failure of the S&P’s cumulative advance-decline ratio (lower clip) to confirm the new high on the index (upper clip) itself, is another warning sign not to be ignored:
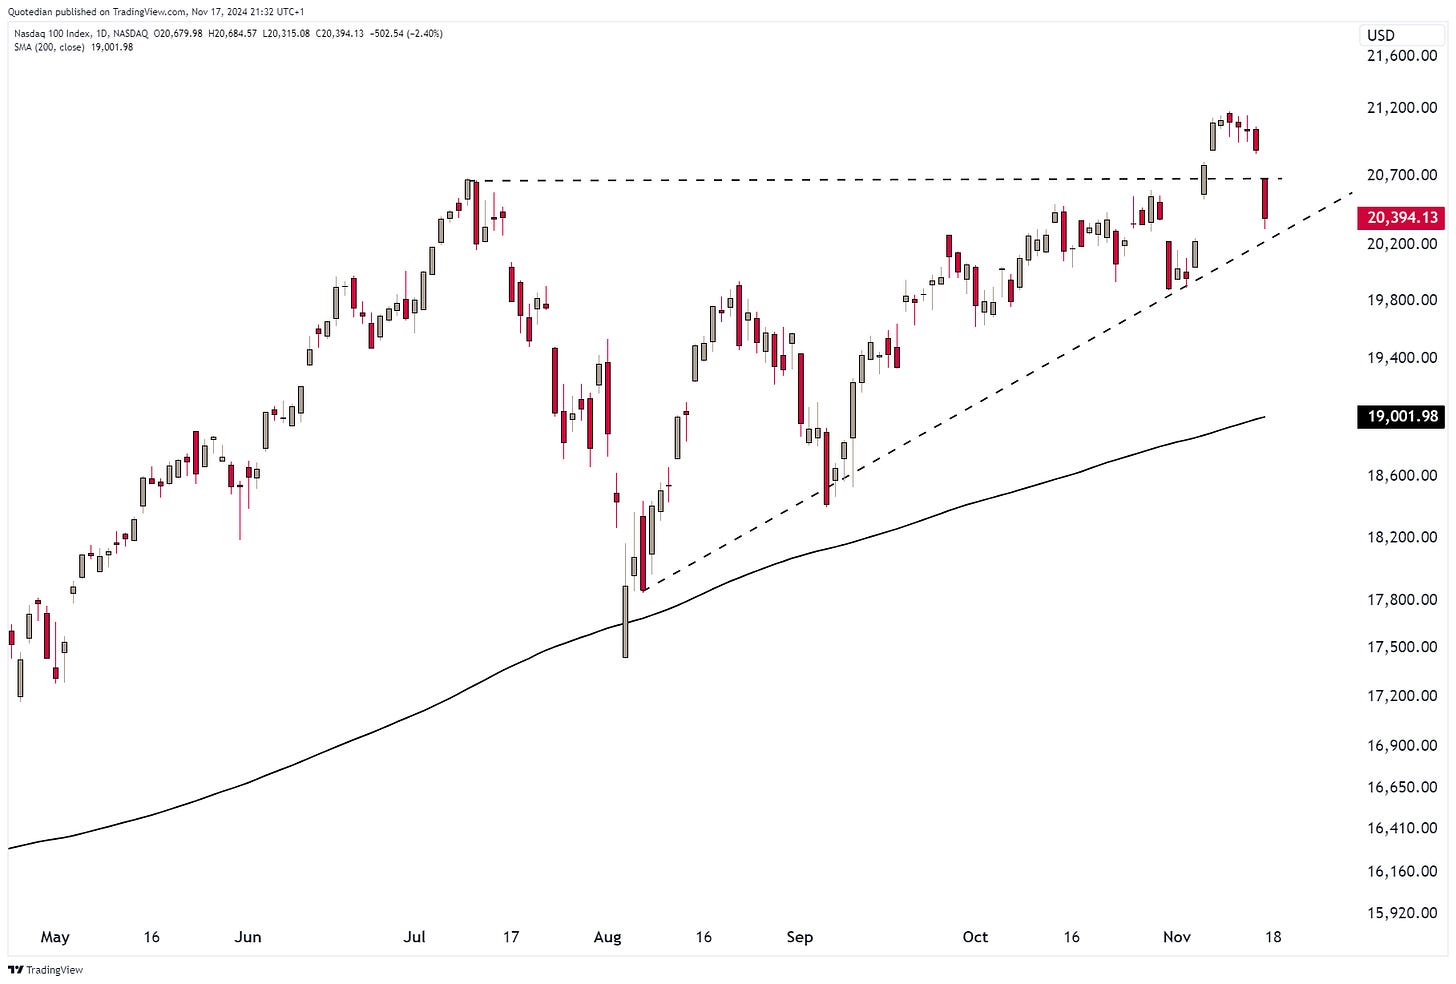
The Nasdaq 100 chart offers us a similar trading opportunity as the S&P 500:
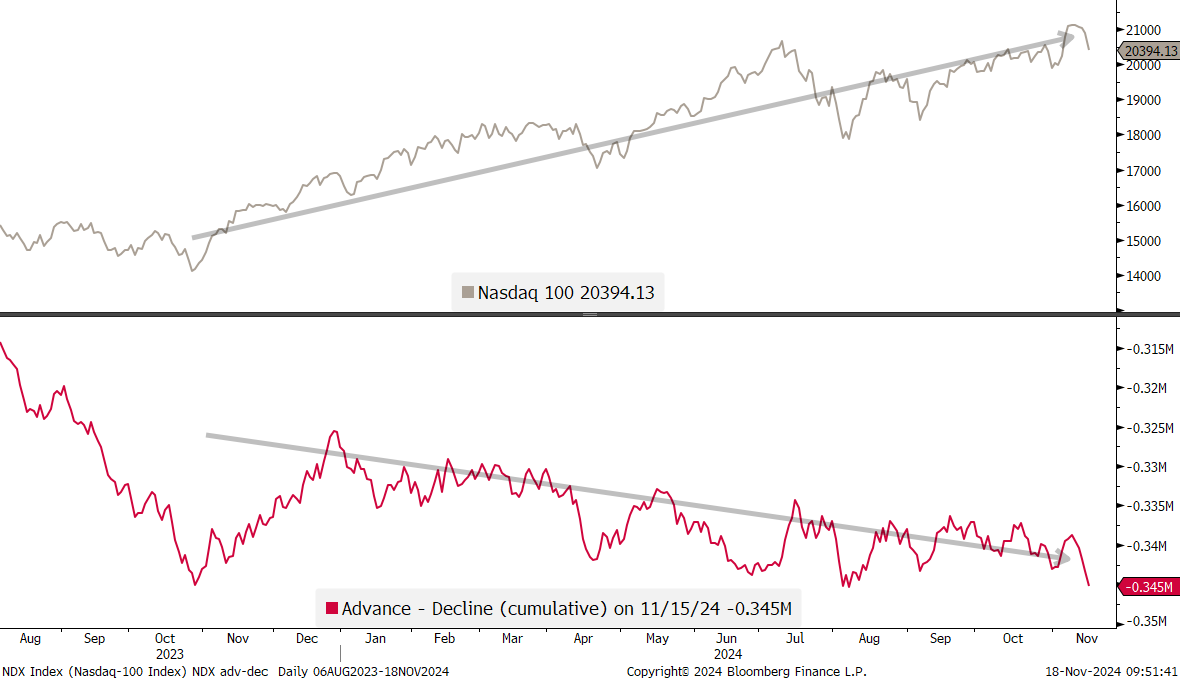
The massive divergence between index (upper clip) and cumulative advance-decline ratio (lower clip) on the Nasdaq chart shows 1) the dominance of a few index heavyweights and 2) the limited use of this indicator in terms of market timing:
Whilst small-cap stocks are approaching key “danger zone”:
Alright, over to our side of the pond, where “things” are clearly much worse:
A drop below 500, give or take, has a very, very, very negative implication …
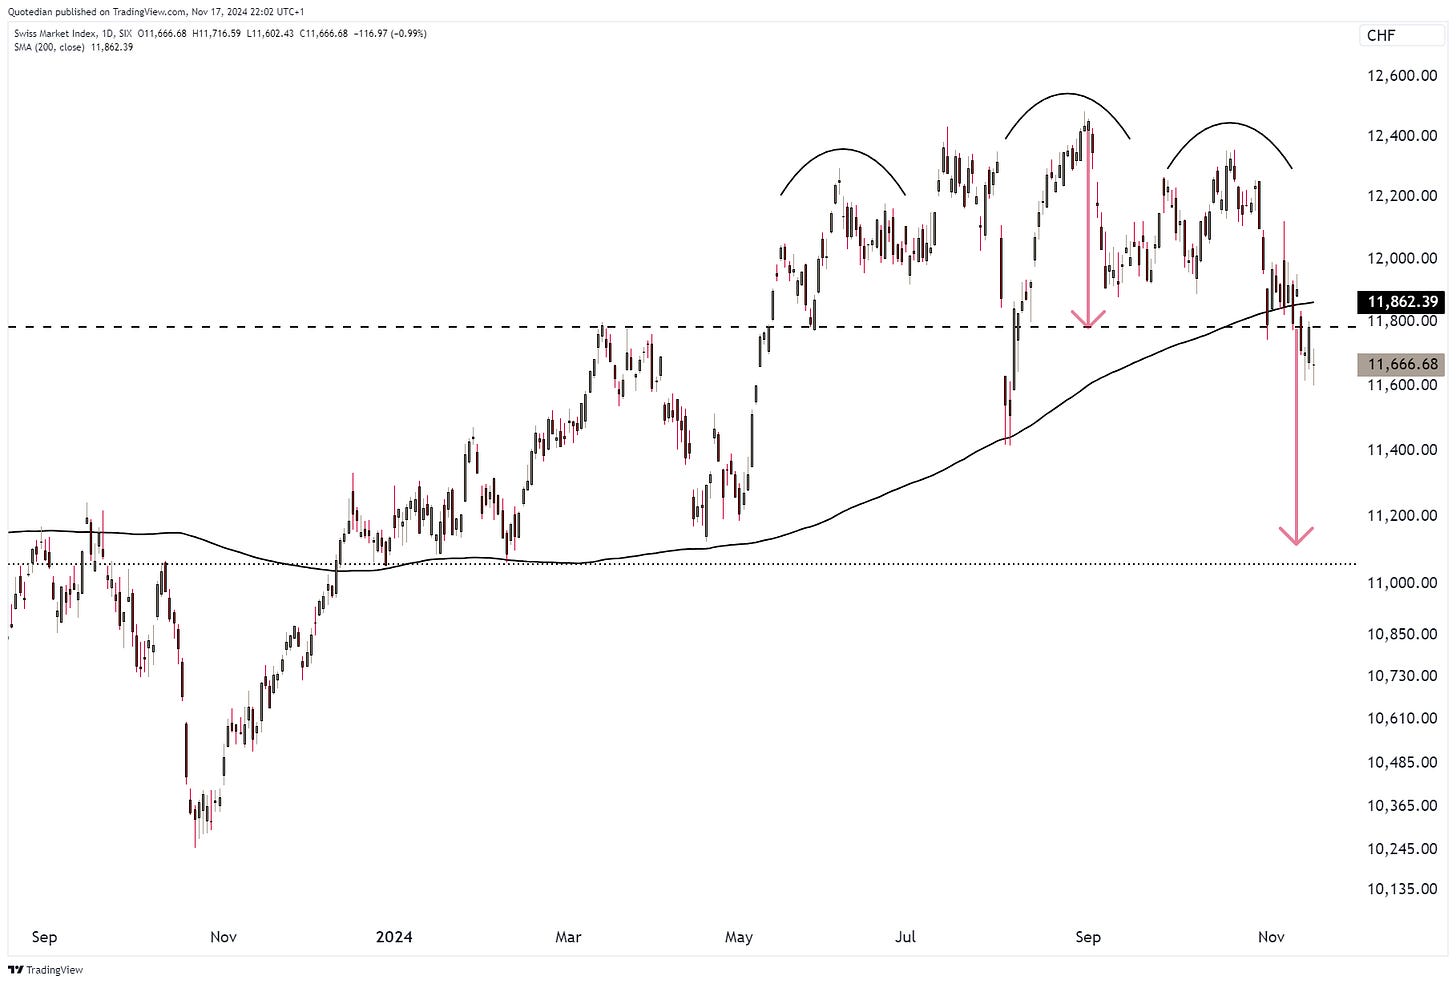
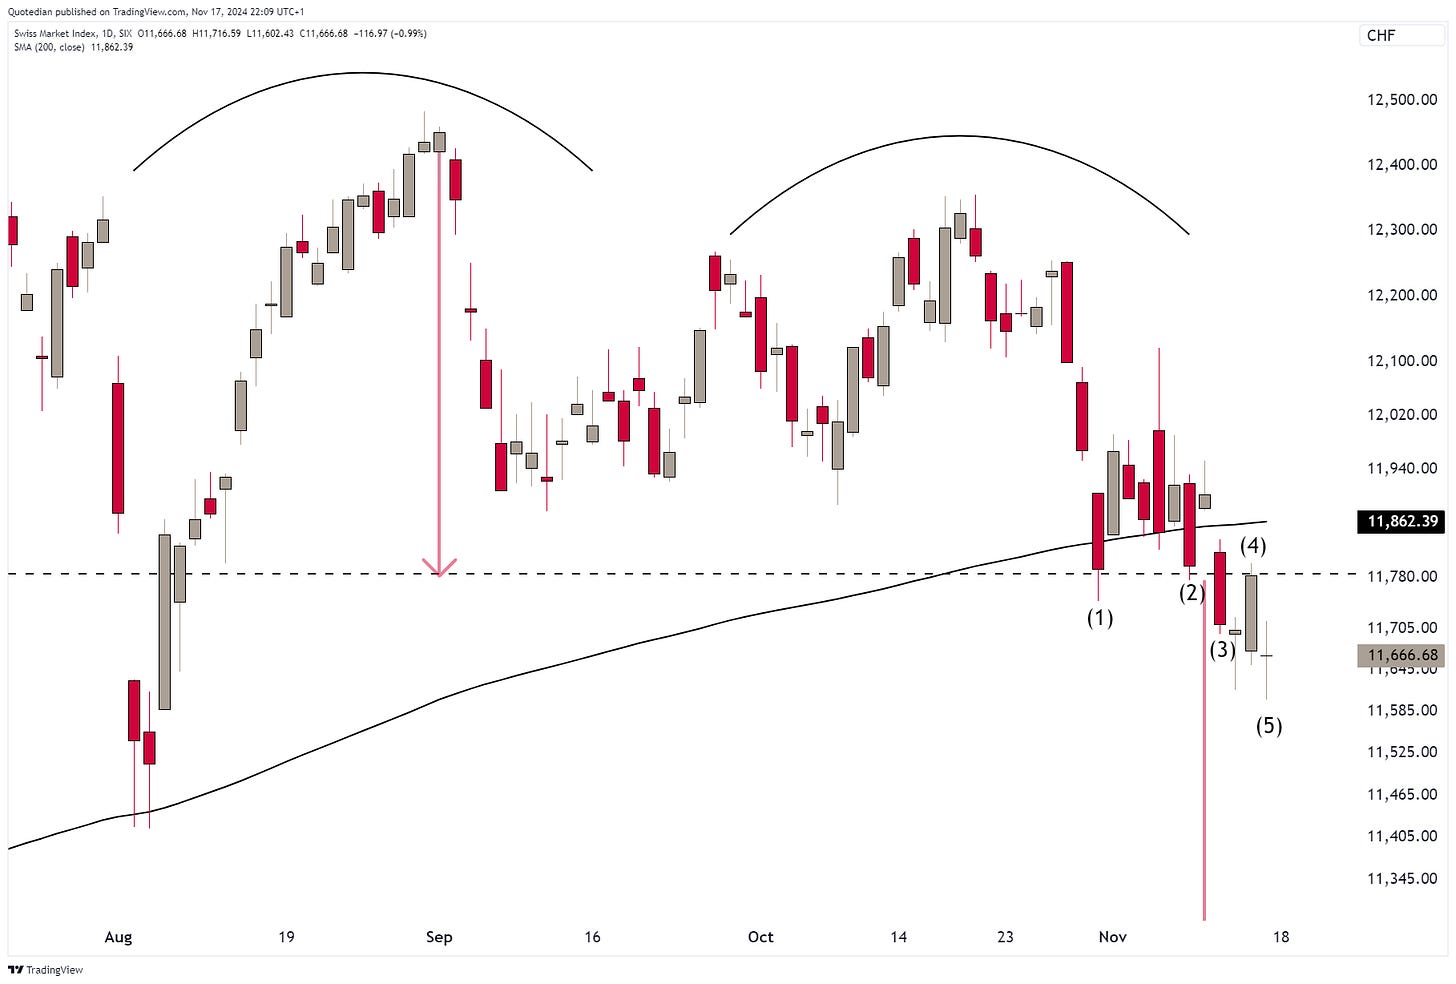
Switzerland’s SMI is already on a sell signal:
The chart pattern is close to perfection with a test of neckline (1); a retest (2), a break (3), a retest of previous support, now resistance (4) with a continuation lower (5):
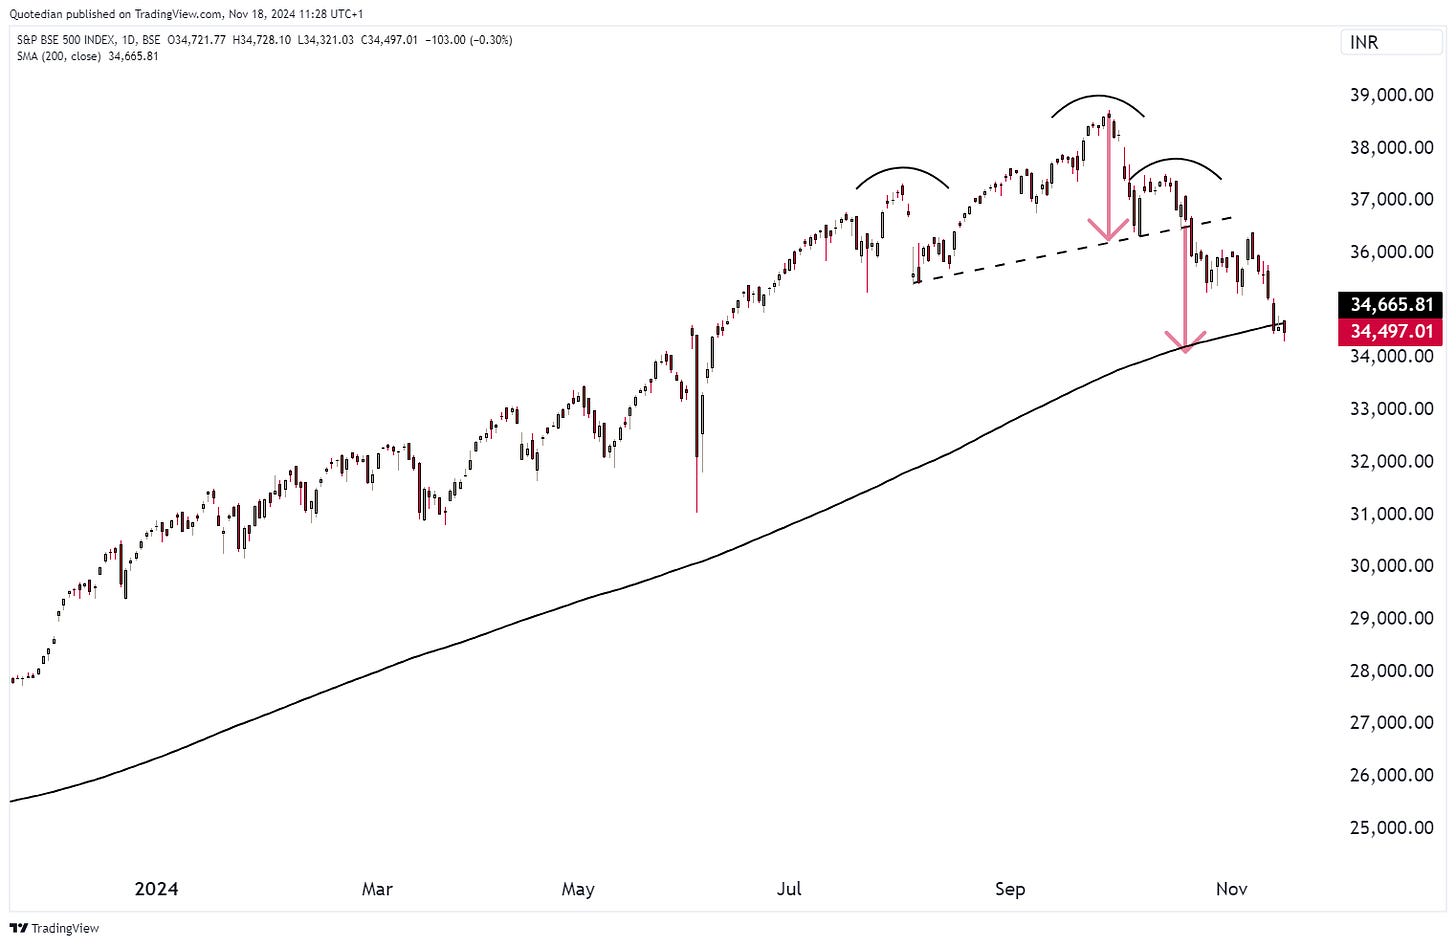
Moving to Asia, India has reached our first target of the shoulder-head-shoulder correction we had laid out a few Quotedians ago:
Depending on a potential broader correction unfolding on global markets as described above, the risk is also for the Indian market to slide a bit further, with 32,000 (-6%) and 30,500 (-12%). But again, if you have no Indian equity exposure in your portfolio, today’s level offers a first entry opportunity.
The Japanese market (Topix) continues with its complex sideways consolidation:
Important here is not to lose focus:
Forty years of sideways is looking for an upside breakout, which to me is only a question of time, especially given it continues to be one of the markets out there with the lowest valuation (Price/Book):
Hong Kong’s Hang Seng Index is seeing its second 30%-plus rally this year faltering:
Nearly last, but definitely not least, let’s check how our list of best performing stock on a year-to-date basis have behaved over the past five sessions.
Starting with the US, we note that many leaders have given back some of their gains:
We find a similar situation on the European list:
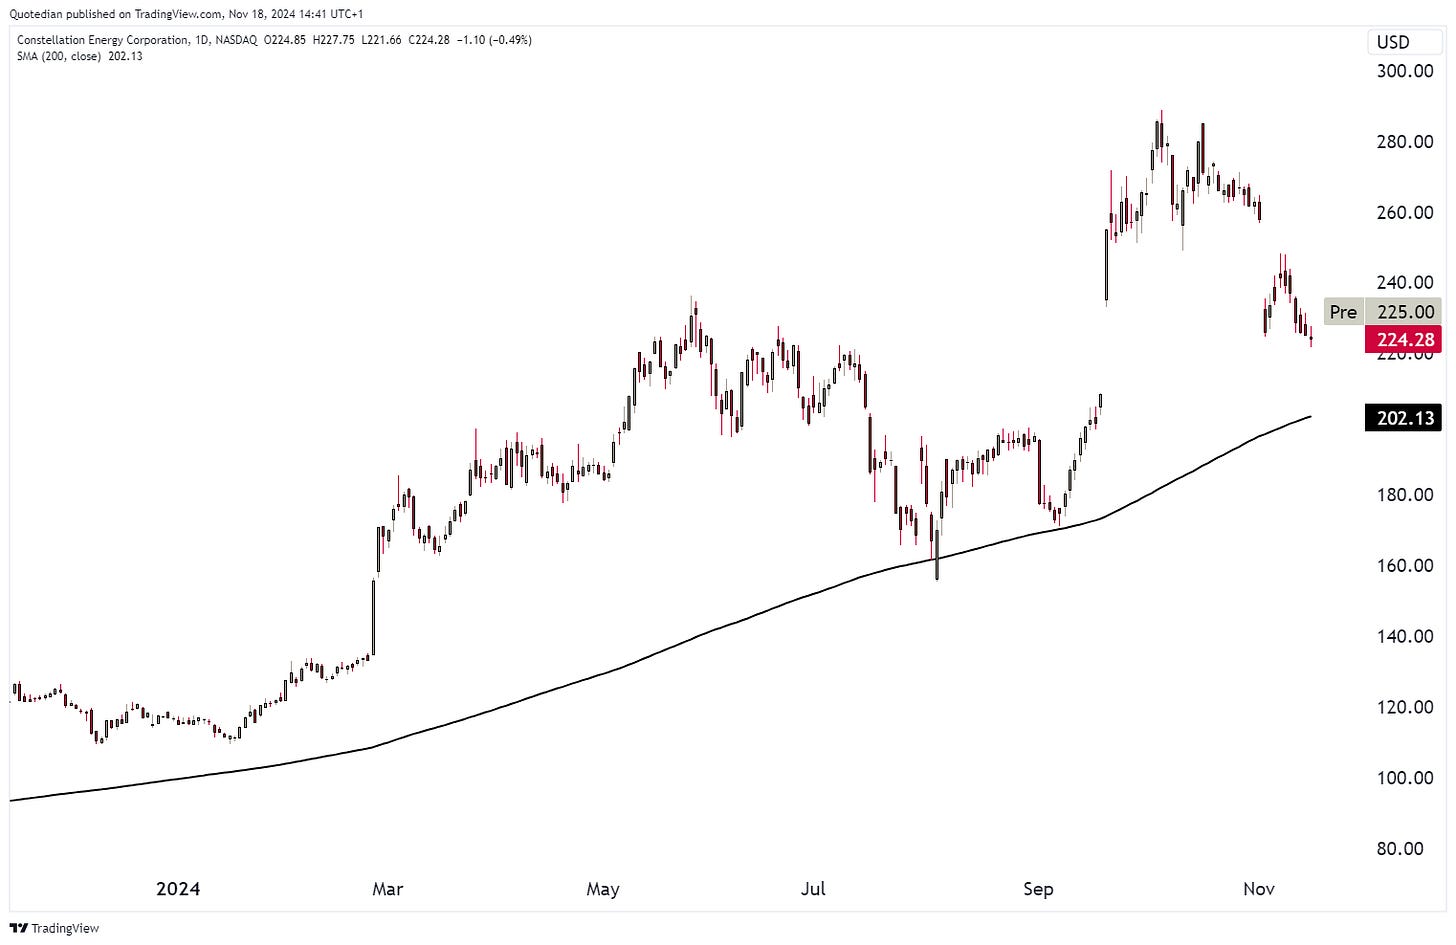
Now, given our (my) more cautious view on the immediate future of stock prices, maybe do not quite yet jump up on each of the correcting stocks, but make sure to check out the charts one by one first. E.g., Constellation Energy (CEG), down twenty-somthing percent already, is likely to fall back to its 200-day moving average (MA) at around $200, which would also mean its September gap higher has been closed:
Or Zealand Pharma in Denmark, already down 20% it has the potential to fall at least another 20% into the “blue” zone:
Hence, with all the above said and before we turned to fixed income/rates side of matters, this:
The One of the many running jokes in Technical Analysis is that if a trendline has unconveniently been broken, as it just happened on the 10-year US Treasury (Tens) yield chart,
just use a thicker pencil to draw that line:
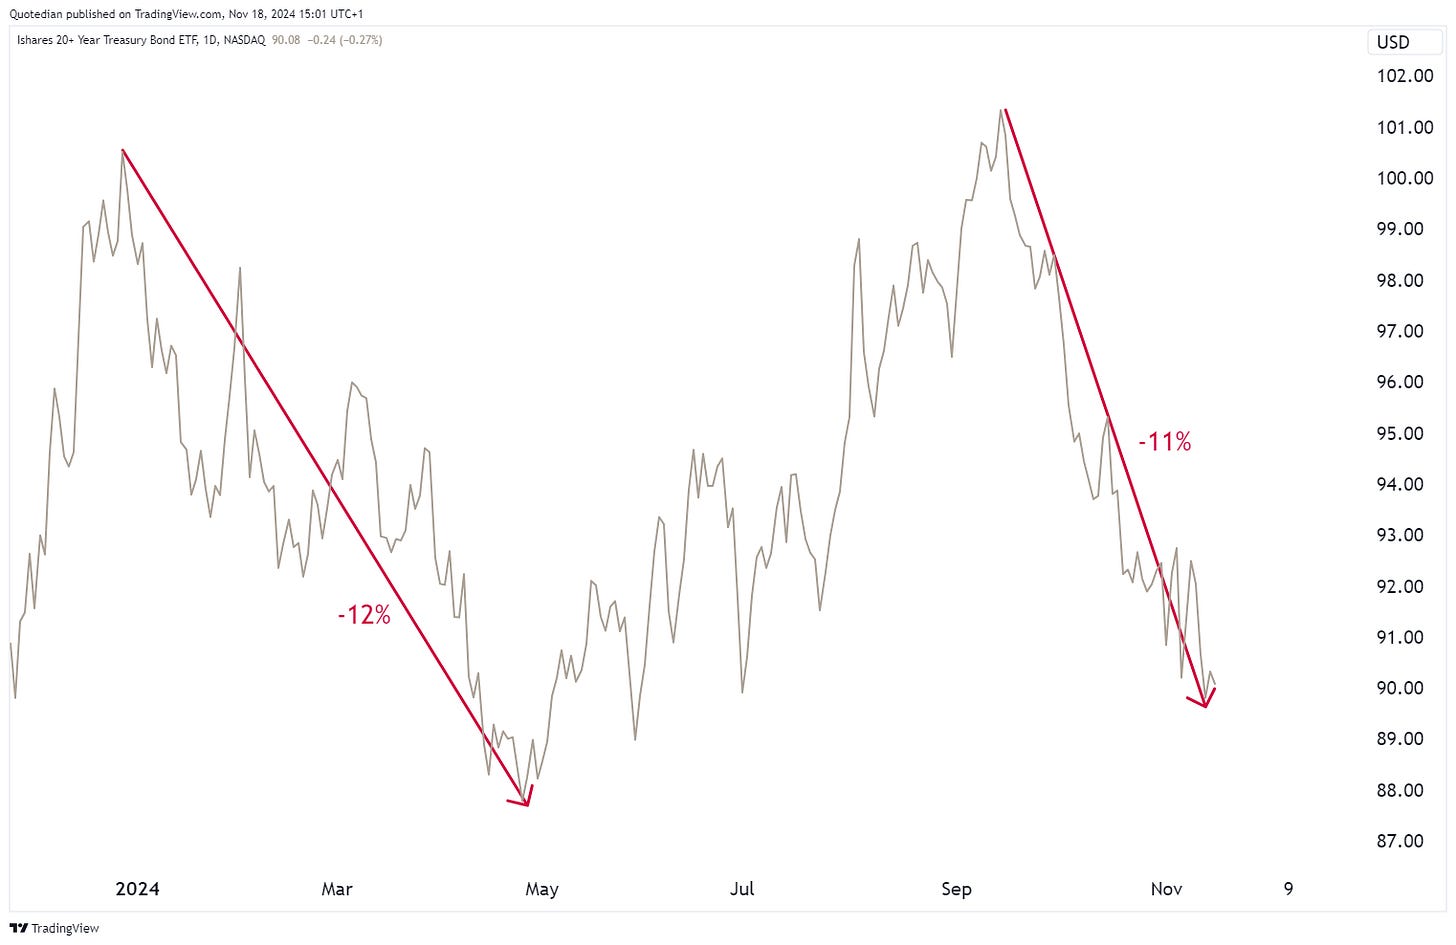
On a more serious note, that break on the yield is indeed a break higher, hard to ignore. Whilst the short-term seems somewhat overbought (oversold) on the yield (bond price) side, a lot of damage has been inflicted on the previously more constructive outlook on bonds. Consider the iShares 20+ year Treasury ETF (TLT) as long-duration proxy for example:
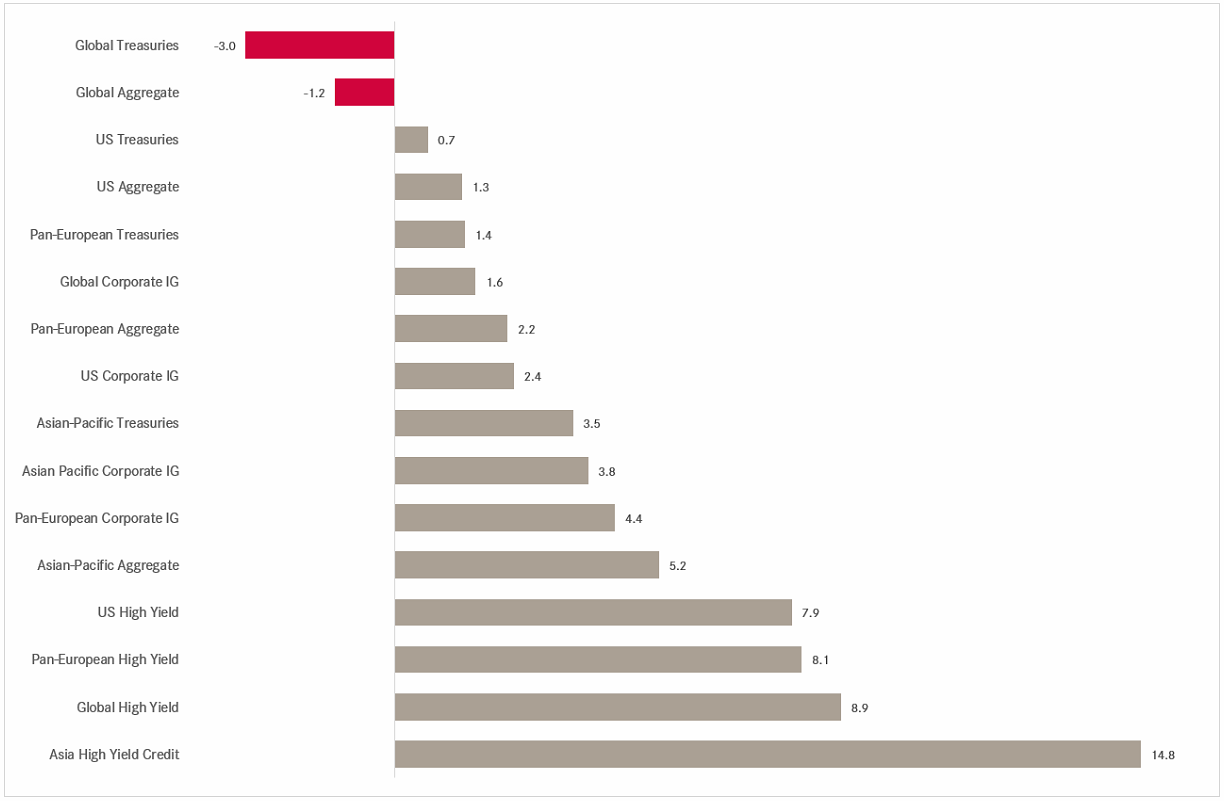
Bond investors are facing their second 10%-plus sell-off this year, though in total return terms, there was still money to be made in fixed income markets this year, especially if you added credit risk and Asia to your mix:
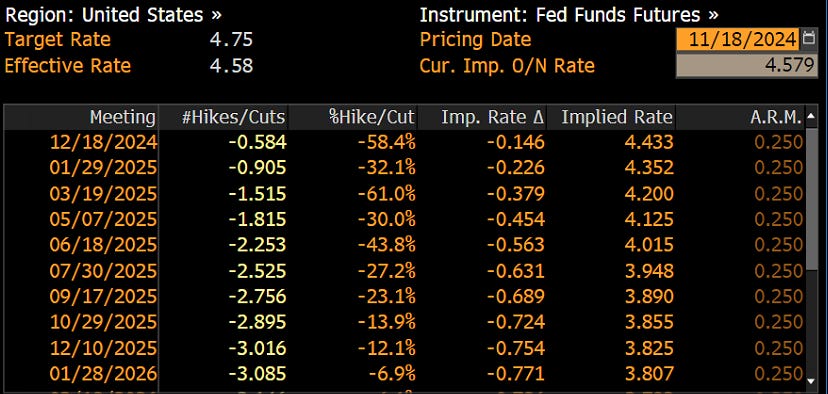
As mentioned already last week after the rate cut two weeks ago, the markets expectation for further cuts has been reduced noticably and Powell’s speech towards the end of last week did not change that:
Especially the previously “guaranteed” December 25 bp cut
, has now only a (nearly) 50/50 chance:
No need for a fatter crayon on the German 10-Year Bund chart, which continues to range trade around the 2.40% level below the falling trendline resistance (dashed):
We haven’t looked at the France-Germany G-spread for a while, so let’s do just that:
Hasn’t improved substantially, but maybe more importantly, has also not gotten any worse…
With anaemic growth in the Eurozone, the ECB is expected to cut again in December and at least five more times in total into year-end 2025:
Switzerland’s SNB is also expected to cut in December and another two times by June of next year:
This would mean that at 0.25% the Swiss National Bank would be within striking distance of running a ZIRP/NIRP policy again:
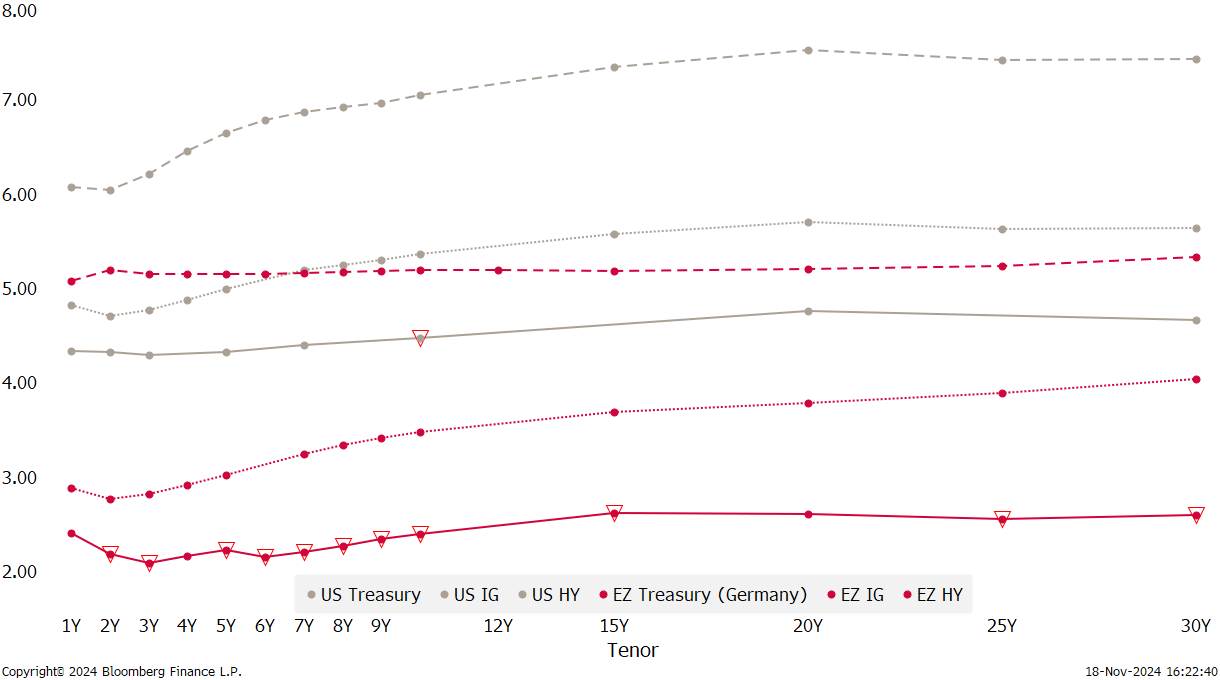
Finally, the following chart tries to show the current state of the yield curve in USD (grey) and the Eurozone (red), for different fixed income “quality”:
Easy enough to understand? Vote here:
As insinuated towards the end of the introductory comment of this week’s letter, it maybe a tad too late to run after the Dollar rally.
E.g., the Dollar Index (DXY) is reversing just below key support, with a DeMark Sequential 9 sell-signal and a divergence (arrows) between price and momentum (RSI):
Not guaranteed to work, the low-risk trade here is for a USD short, with a tight stop above resistance (107ish).
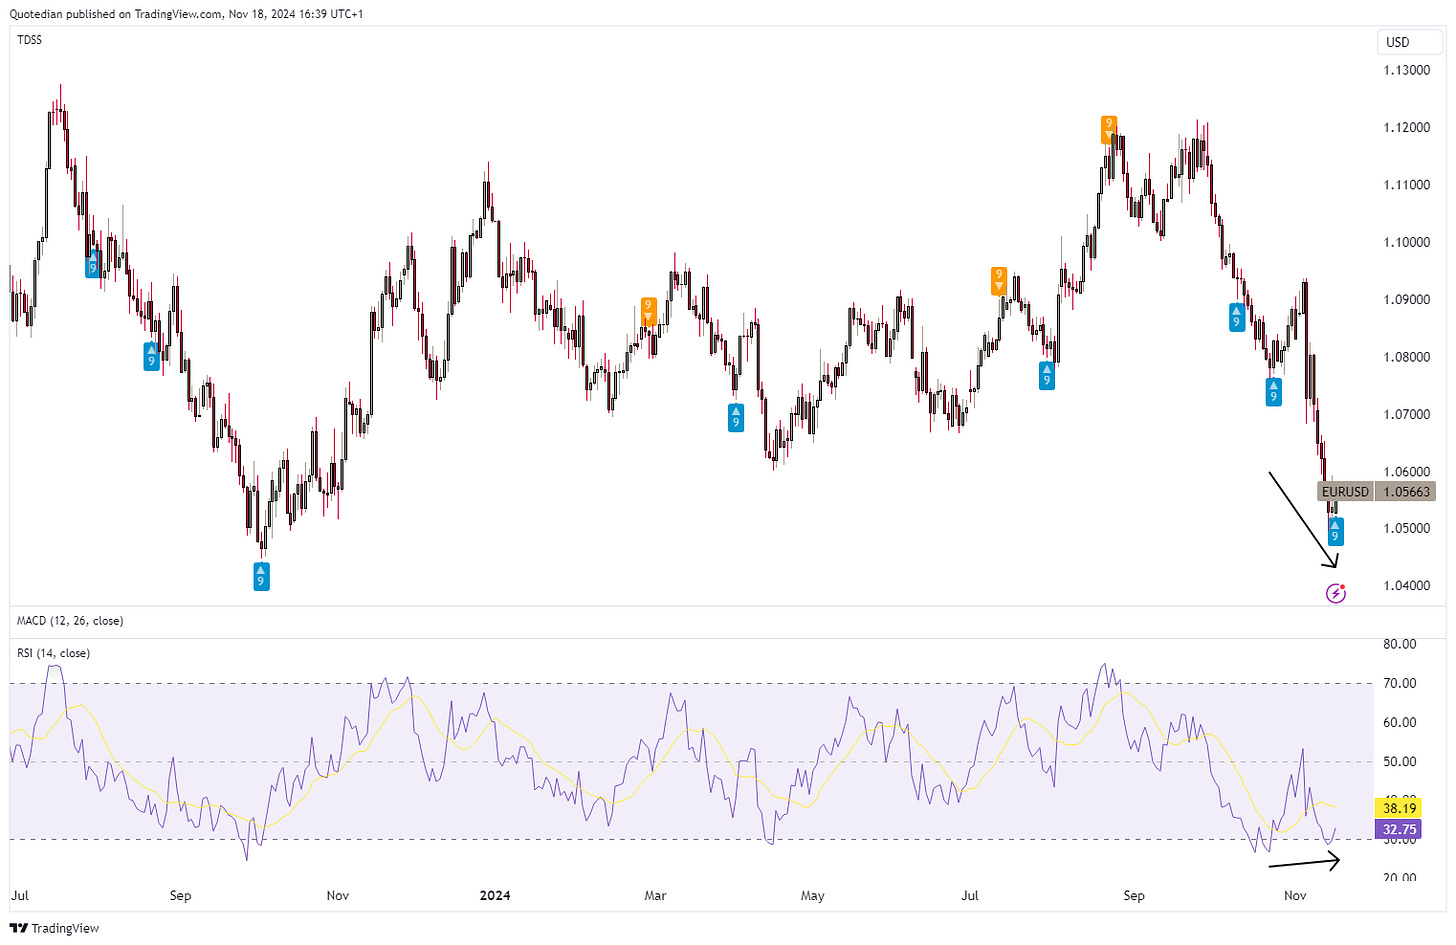
This setup also “translates” very well into the EUR/USD chart:
Whilst it is a bit more difficult (read expensive) to place a stop loss on a possible USD/JPY short position ($-short/long yen that is), with resistance further away,
it is still a setup I like, given that the BoJ is one of the few CBs expected to hike rates over the coming twelve months:
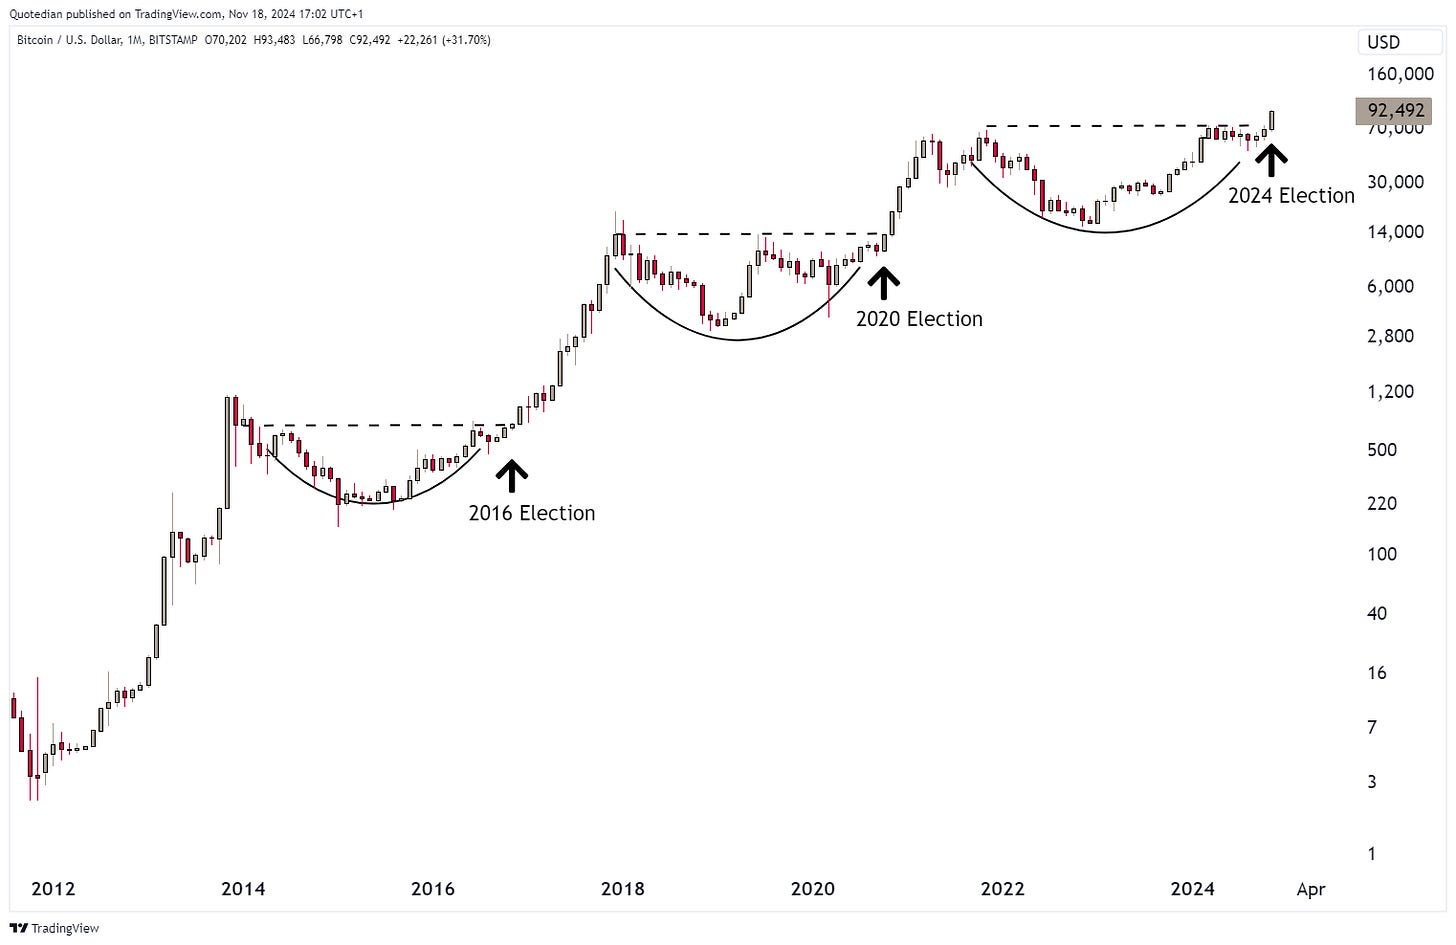
Of course, we also need to mention the mighty Bitcoin, which hit an all-time high last Wednesday at 93,425, then briefly dropped below 90k again, but is today (18.11.) already on the march towards taking out that ATH again:
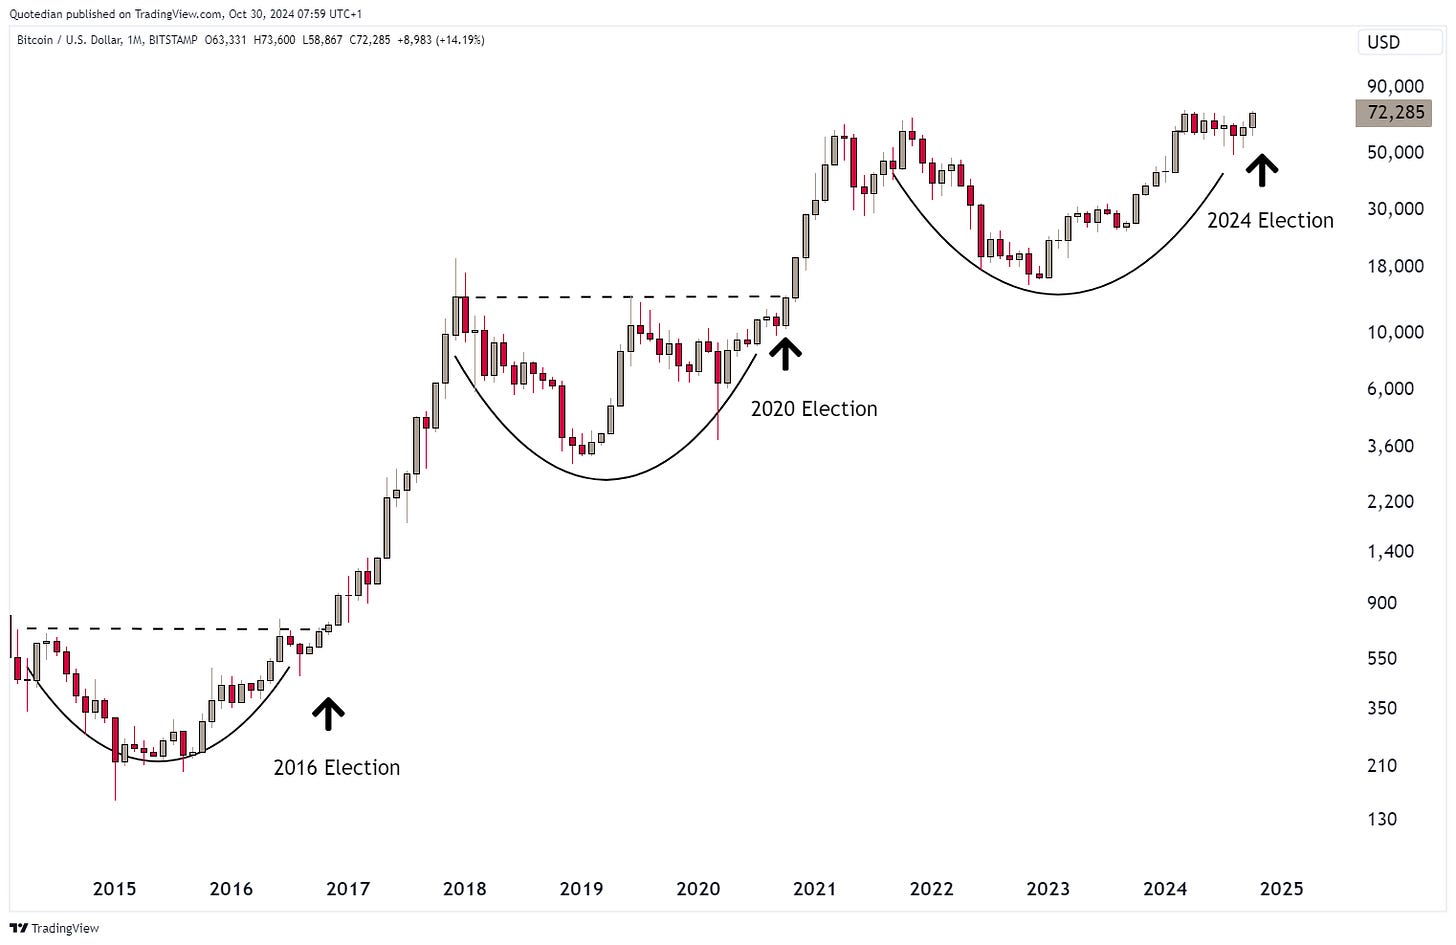
Now, remember this chart I posted on the QuiCQ at the end of October?
What? You did not see it because you do not receive The QuiCQ??!! What are you waiting for??!!
Well, here is the updated version:
And again, I need to ask:
In the commodity space, Gold broke as expecgted through the key support we cited in our previous letter.
However, contrary to our expectation, the price of the yellow metal has recovered above that level again, at least as I am typing this paragraph. I still think some more downside action is necessary to complete a proper “correction”, but the lower turning Dollar is definitely giving gold some tailwind.
One of the more interesting trades in the commodity space seems to be natural gas, a position to which I would add above $3:
But it seems especially the Dutch (red) and UK (blue) natural gas “version” seem to have most …hhhmmm… power at the moment:
Time to hit the send button! Have a great week ahead!
André
Everything in this document is for educational purposes only (FEPO)
Nothing in this document should be considered investment advice
Investing real money can be costly; don’t do stupid shit
The views expressed in this document may differ from the views published by Neue Private Bank AG
Past performance is hopefully no indication of future performance


