

One Last Hooray
Vol VIII, Issue 27 | Powered by NPB Neue Privat Bank AG

“There is a prudent maxim of the economic forecaster’s trade that is too often ignored: Pick a number or pick a date, but never both.”
— Paul Volcker
Enjoying The Quotedian but not yet signed up for The QuiCQ? What are you waiting for?!!

The path of least resistance for the stock market seems to continue to be to the upside … so be it. As they say:
The Trend is your friend
Never fight the Fed
It is easy enough to identify the current trend. Here’s the iShares MSCI World ETF (URTH) has proxy for the global stock market:
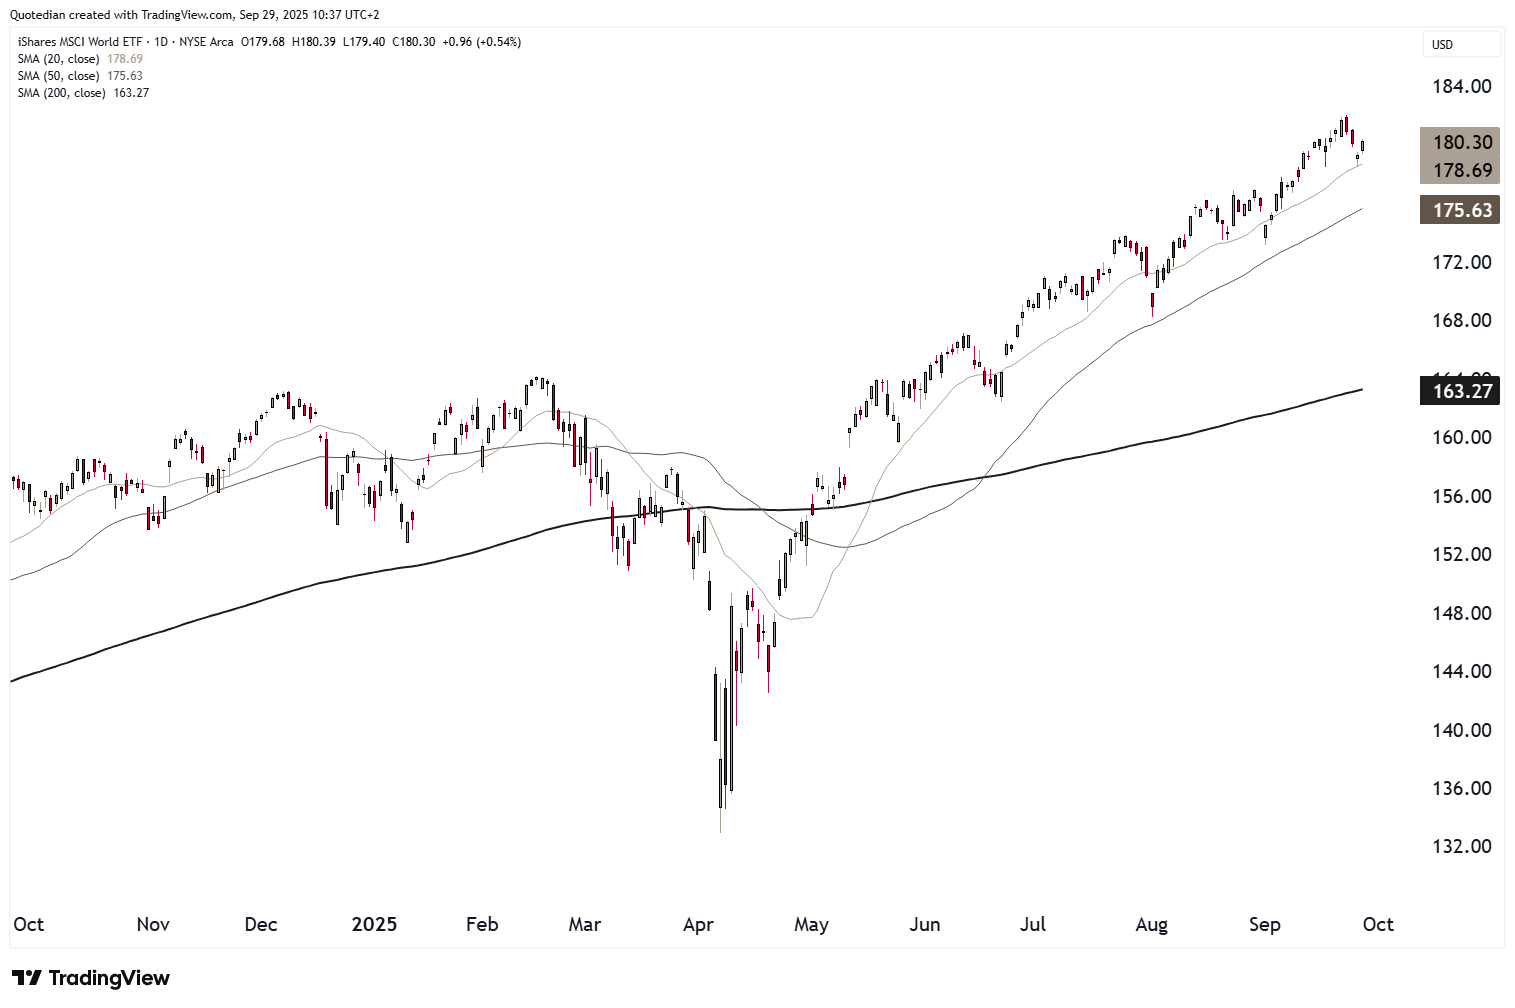
Since the April (Liberation Day) lows, stocks have been ticking higher, with the prices well above 20-, 50- and 200-day moving averages now.
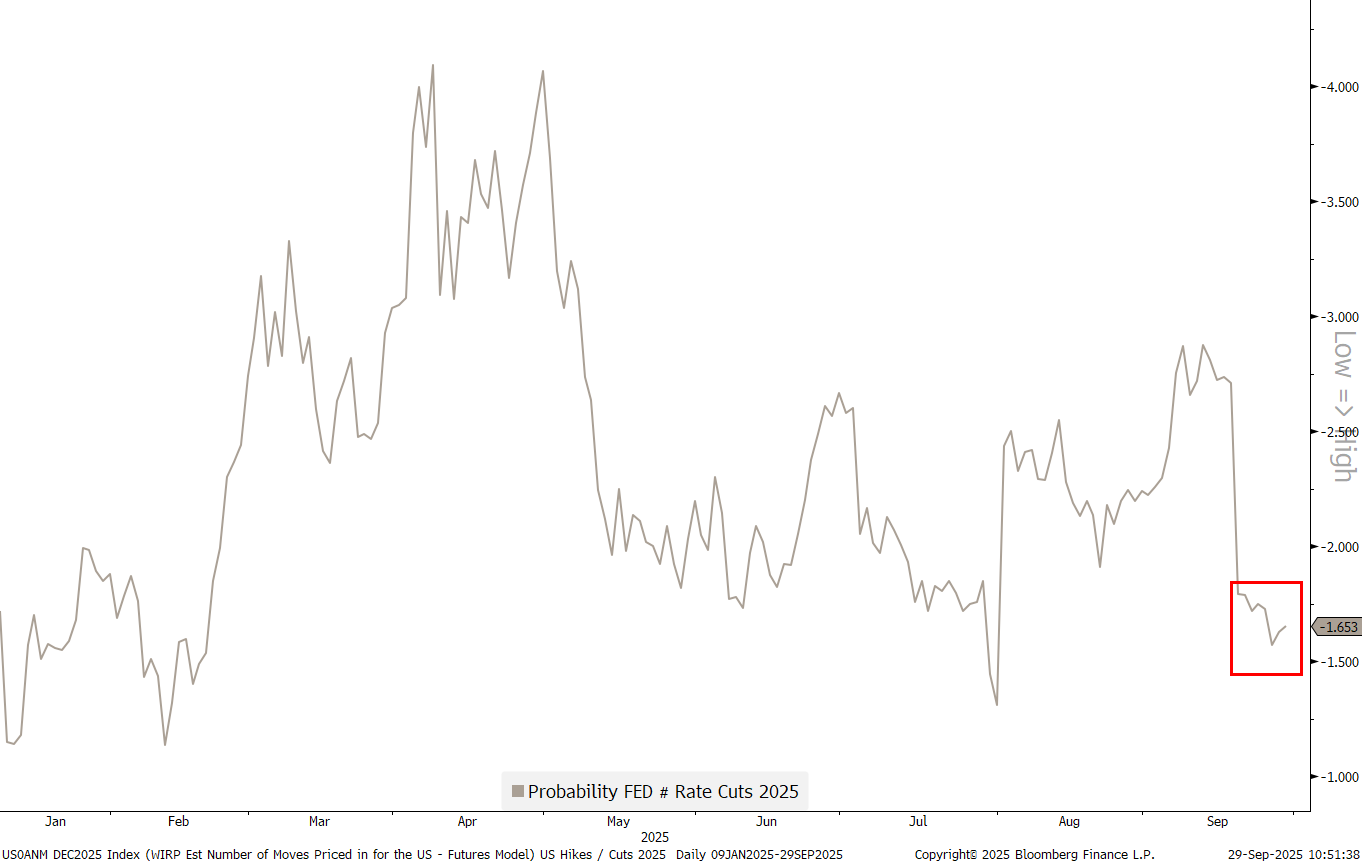
Of course, as always, and as discussed in last week’s letter (Cape Fear - click here), there’s always plenty to worry about, yet the market continues to tick higher. Point-in-case, last week we got for example on Thursday a massive upwards revision (from 3.3% to 3.8%), coupled with a drop in weekly jobless claims for a third consecutive week, topped by a not-so benign inflation report on Friday. All in all, good economic news, which made investors reduce their bets on FOMC rate cuts into the end of the year (red box), as derived from futures markets:

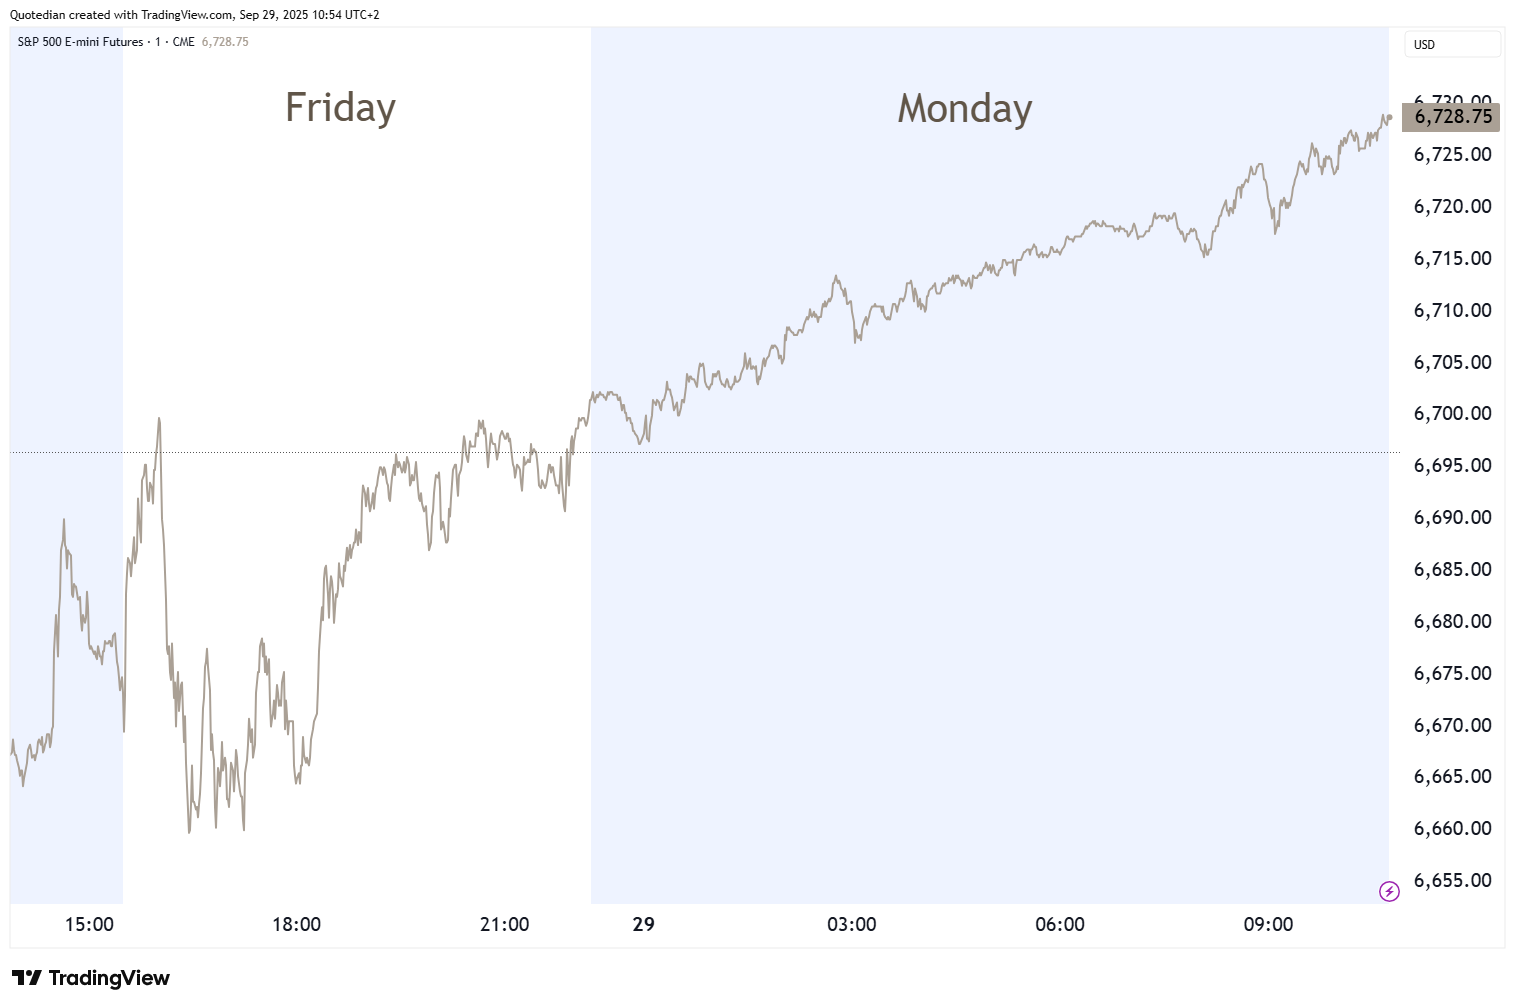
So, if markets were up previously in expectation of three rate cuts into year end, they surely must be lower now that those expectations have been curtailed, right? Right? Right? Wrong! Here’s Friday’s and this mornings rally in S&P 500 mini futures:
Nevertheless, the Fed IS in easing mode, so rule number two at the outset also still applies.
Let’s start our usual round through the different asset classes then.

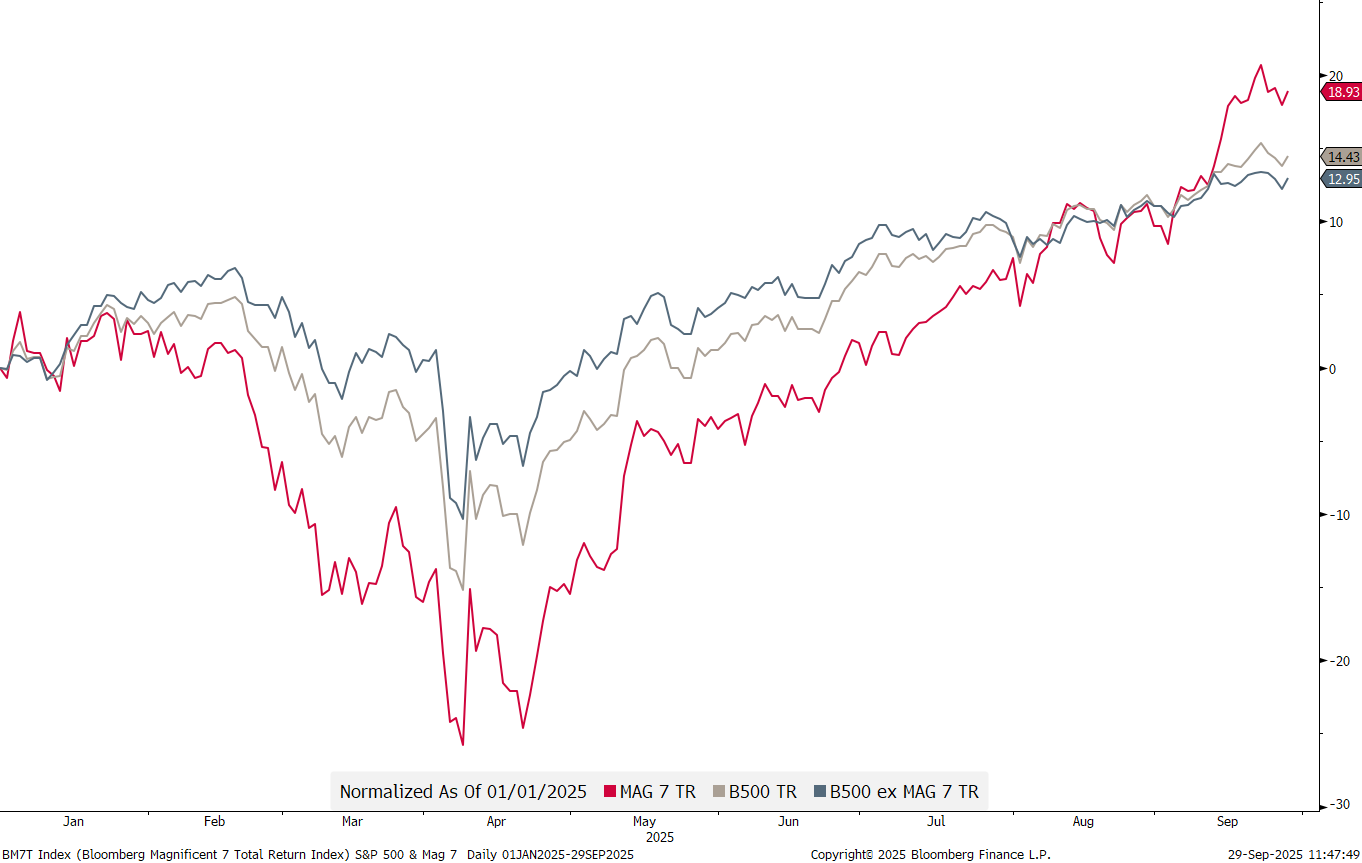
The concentration in a few stocks (Mag 7) has been widely discussed over the past weeks and months and indeed has the outperformance of that group of stocks (red line) to the overall market* (grey line) been abyssal:
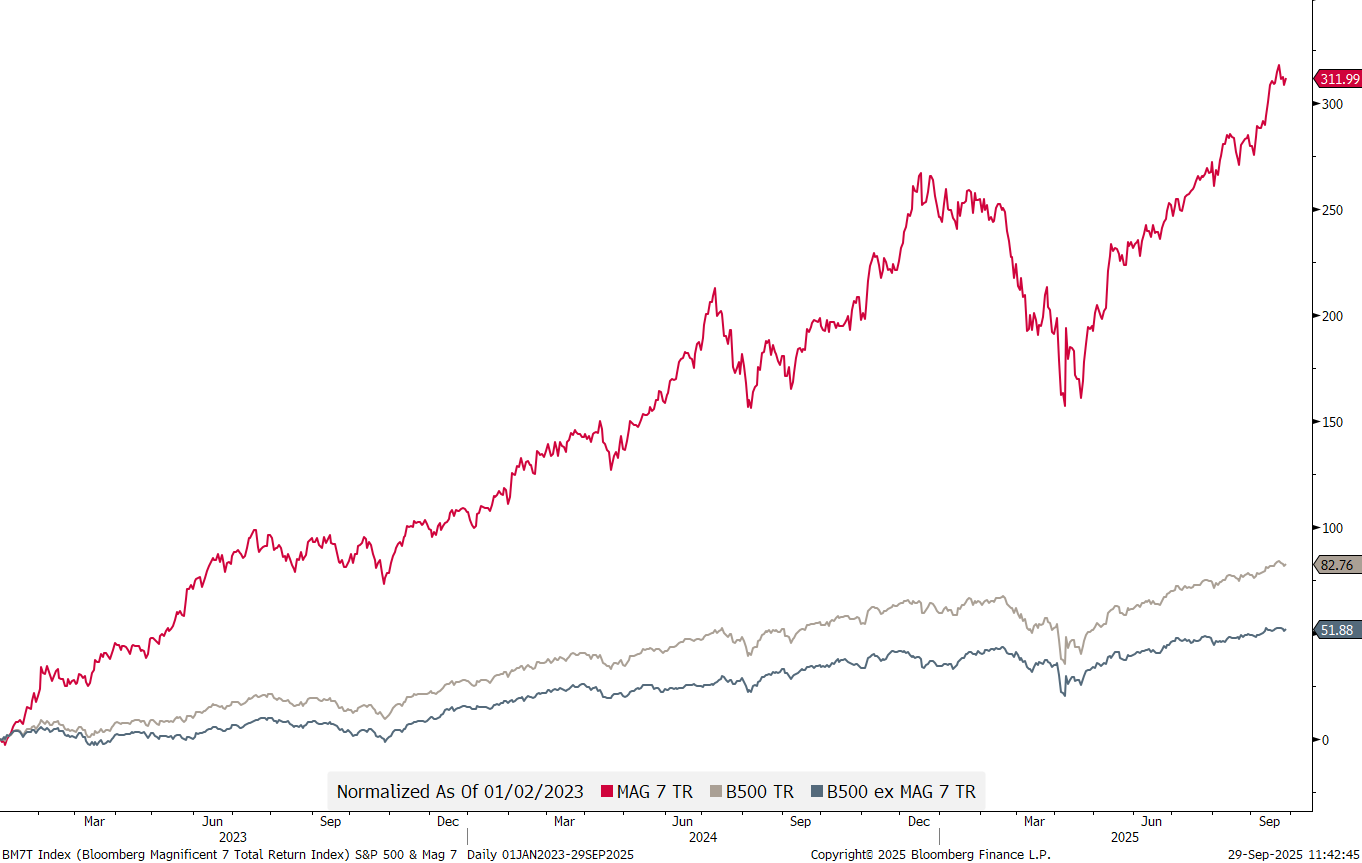
*Note: Bloomberg has introduced a series of equity indices which “replicate” some of the most commonly used series, with the added advantage of full look through. Example: Above we use the B500 index, which mirrors the S&P 500, but with all the constituents data fully available. Bravo Bloomberg!
However, if we take the same chart as above , but look at it for 2025 only, the outperformance is not THAT extreme … yet:
In terms of valuation gap however … well check for yourself on the chart below, showing the NTM Price/Sales ratio for the same three groups as above:
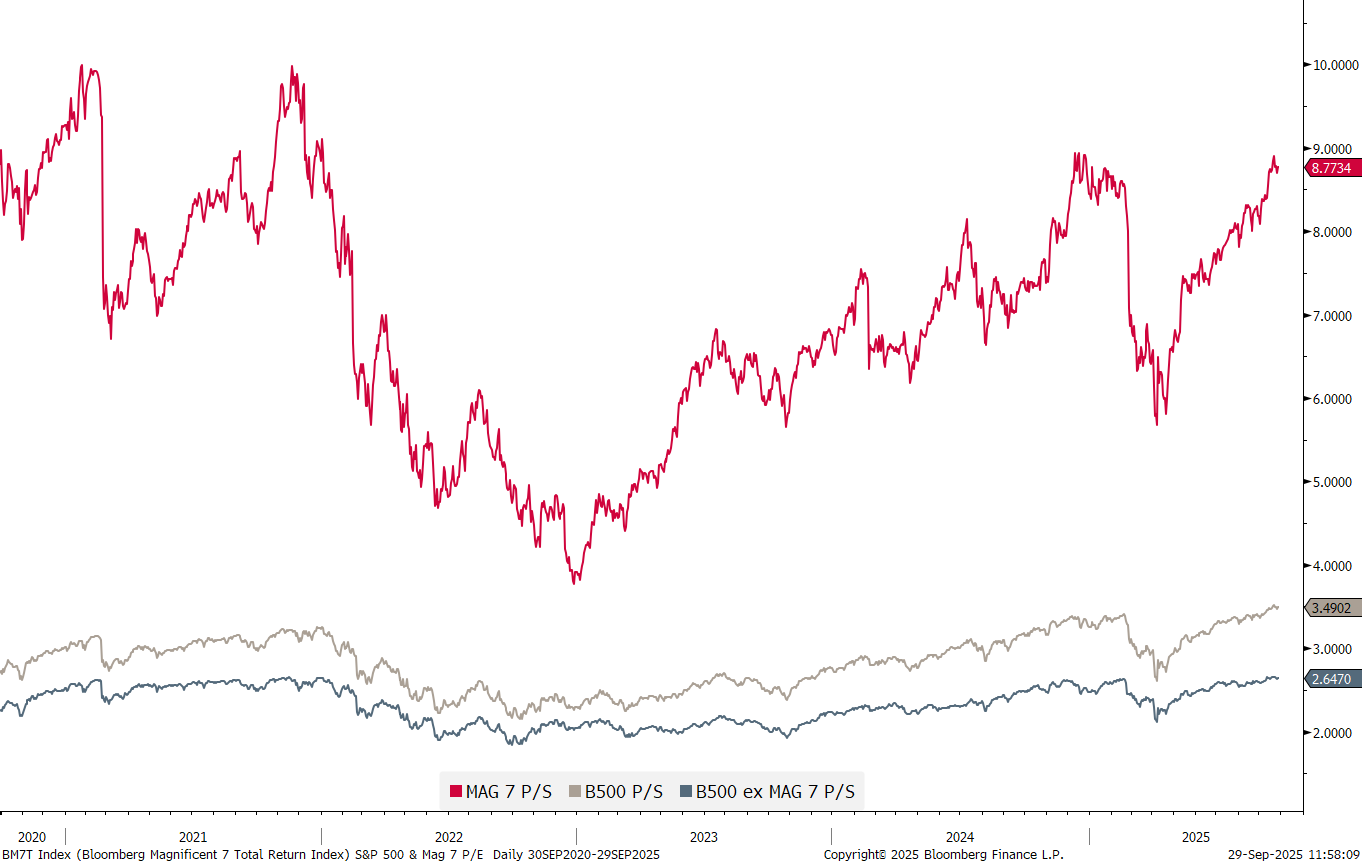
Eventually, the chickens will come to roost as they did in 2000, where similar valuations were seen for a group of stocks mostly related to the build out of the global network (e.g., Cisco, Lucent, Juniper, WorldCom, Terra Networks etc.).
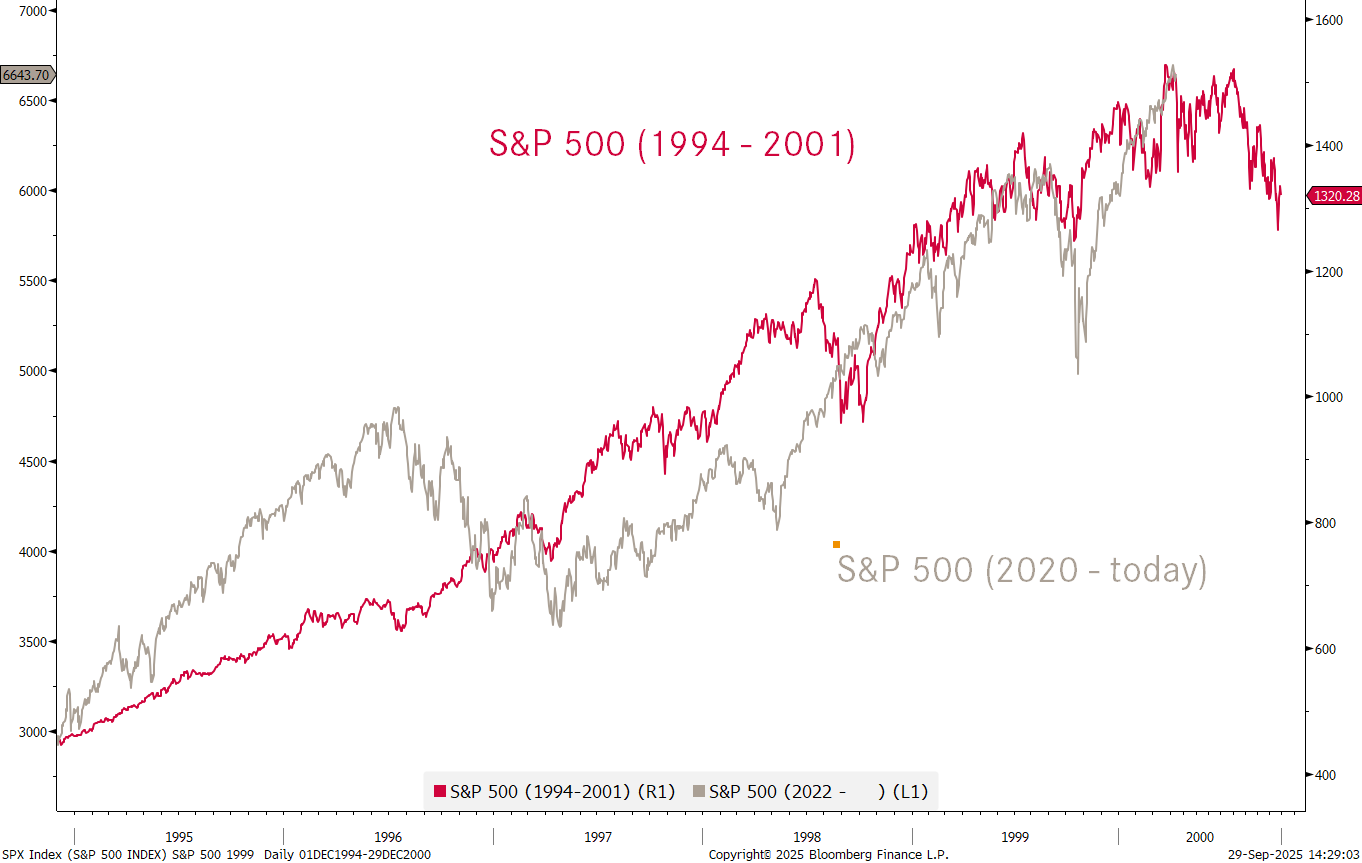
The question then is, are we 1997 with the release of ChatGPT in November 2023 being the equivalent of the first release of the Netscape internet browser in December of 1994?
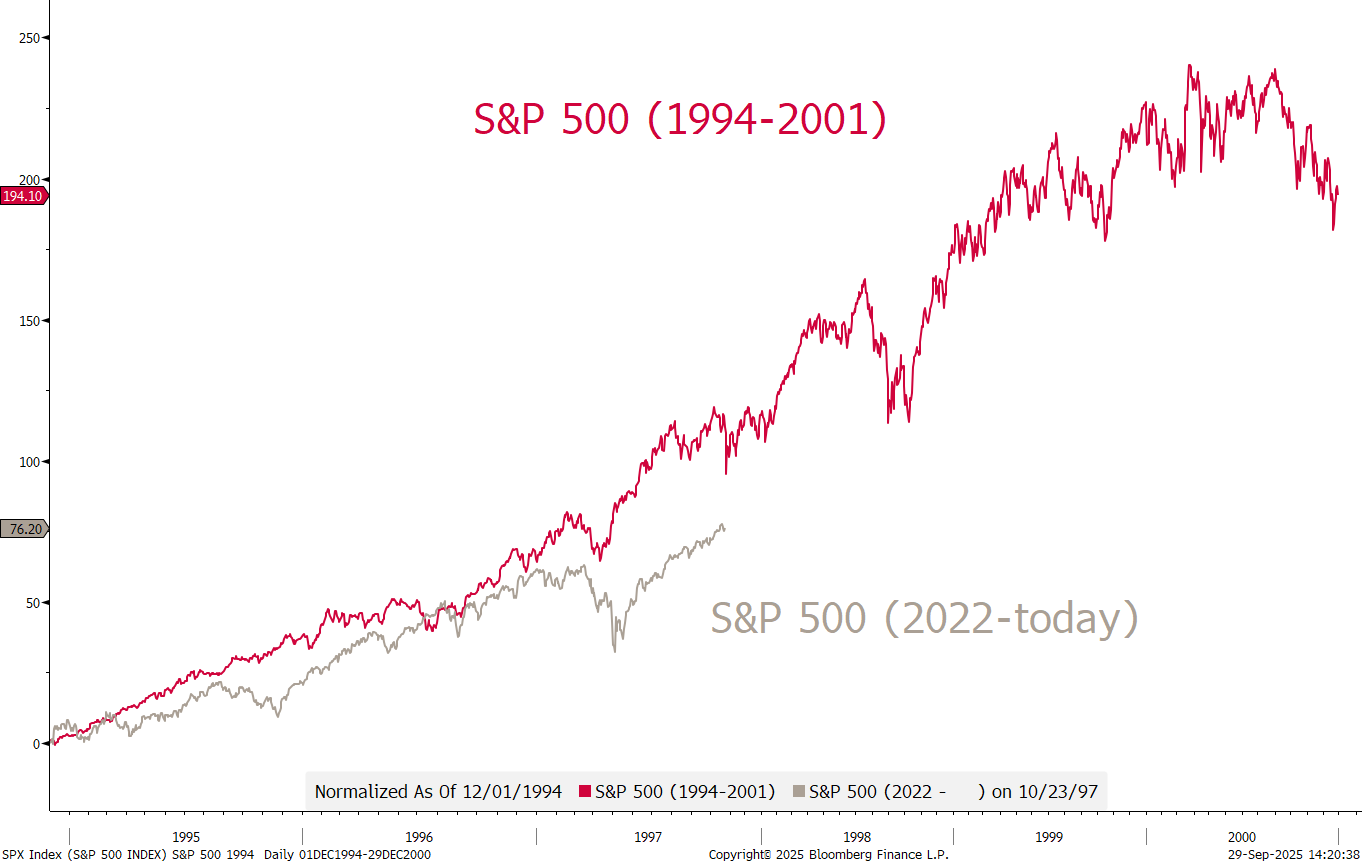
Or should we be partying like it is 1999 already?
In any case, for now, remember rule #1 and #2, but don’t forget about risk management. As uncle Beni told us:
The essence of investment management is the management of risks, not the management of returns.
-- Benjamin Graham
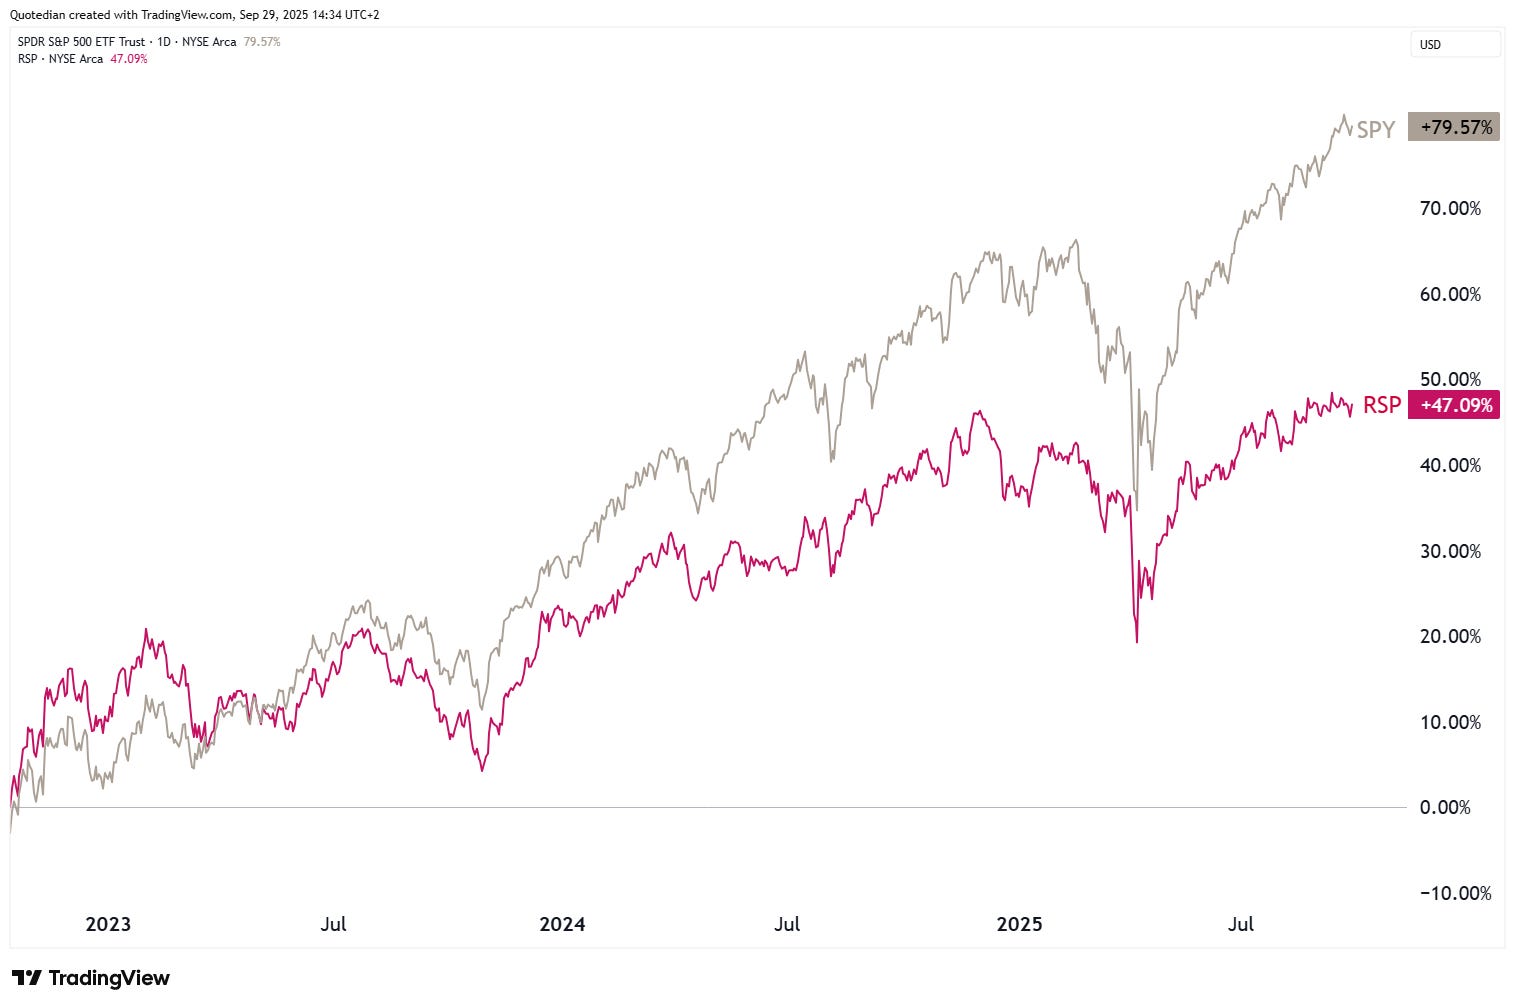
Of course the bulls will argue that the 493 stocks still have catch-up potential with the Mag 7. And they are not wrong, that’s one way to look at it. Here’s the S&P 500 (SPY - grey) versus the S&P 500 equal-weight (RSP - red) since the market bottom in late 2022:
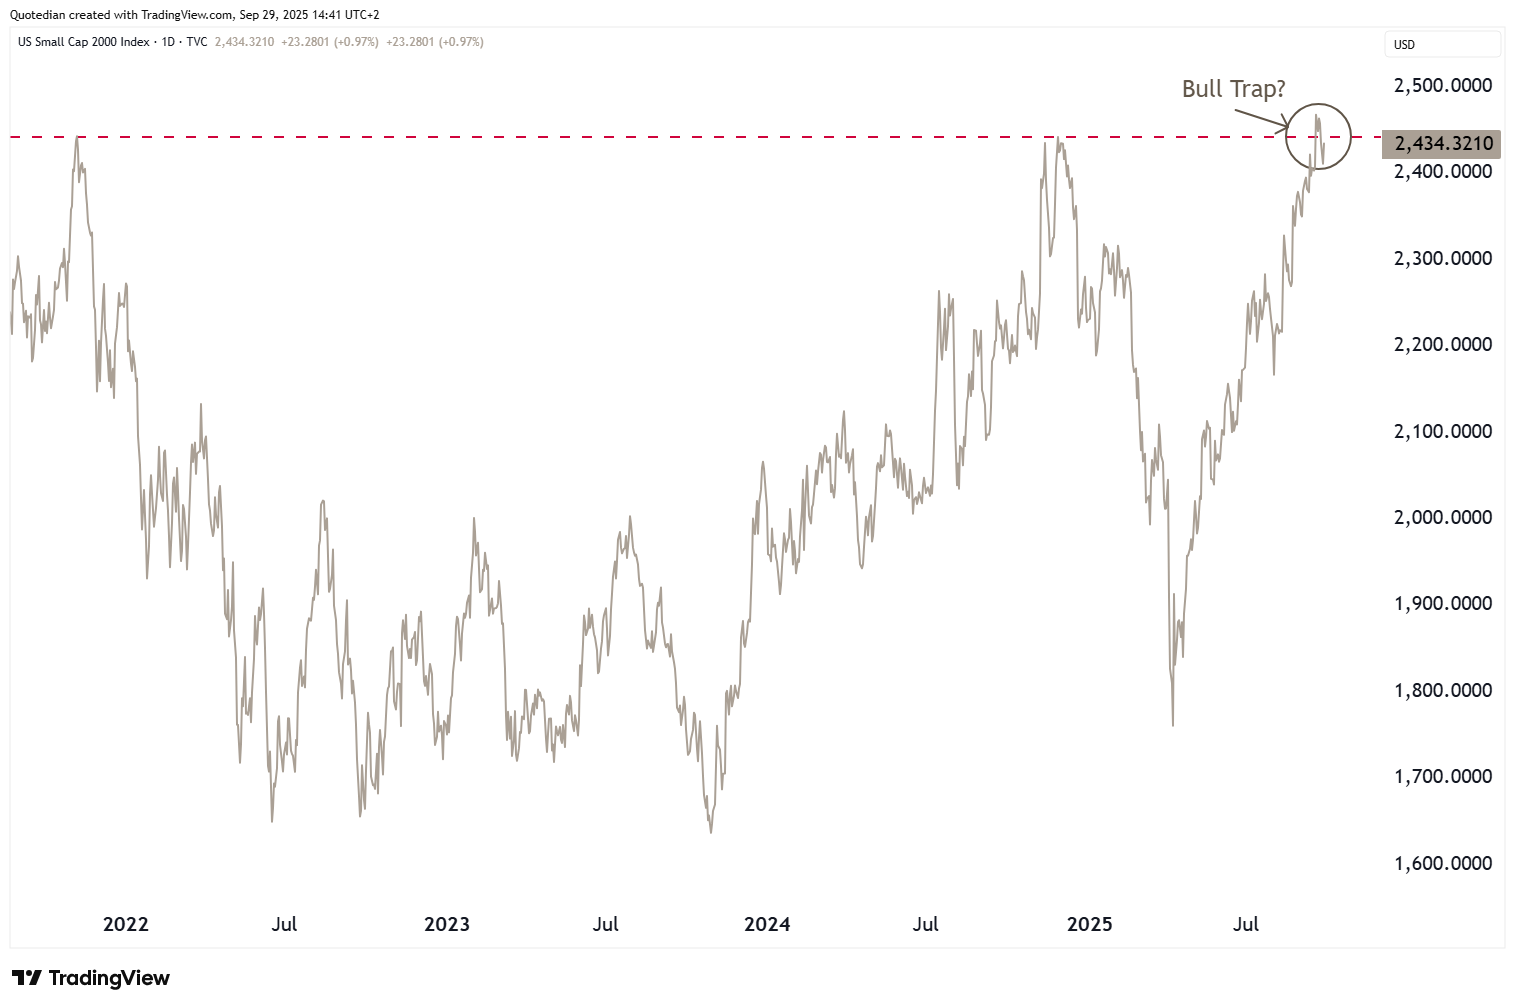
And as we discussed in this space a week or two ago, small cap stocks just recently joined the party with a new-all time high some nearly four years later:
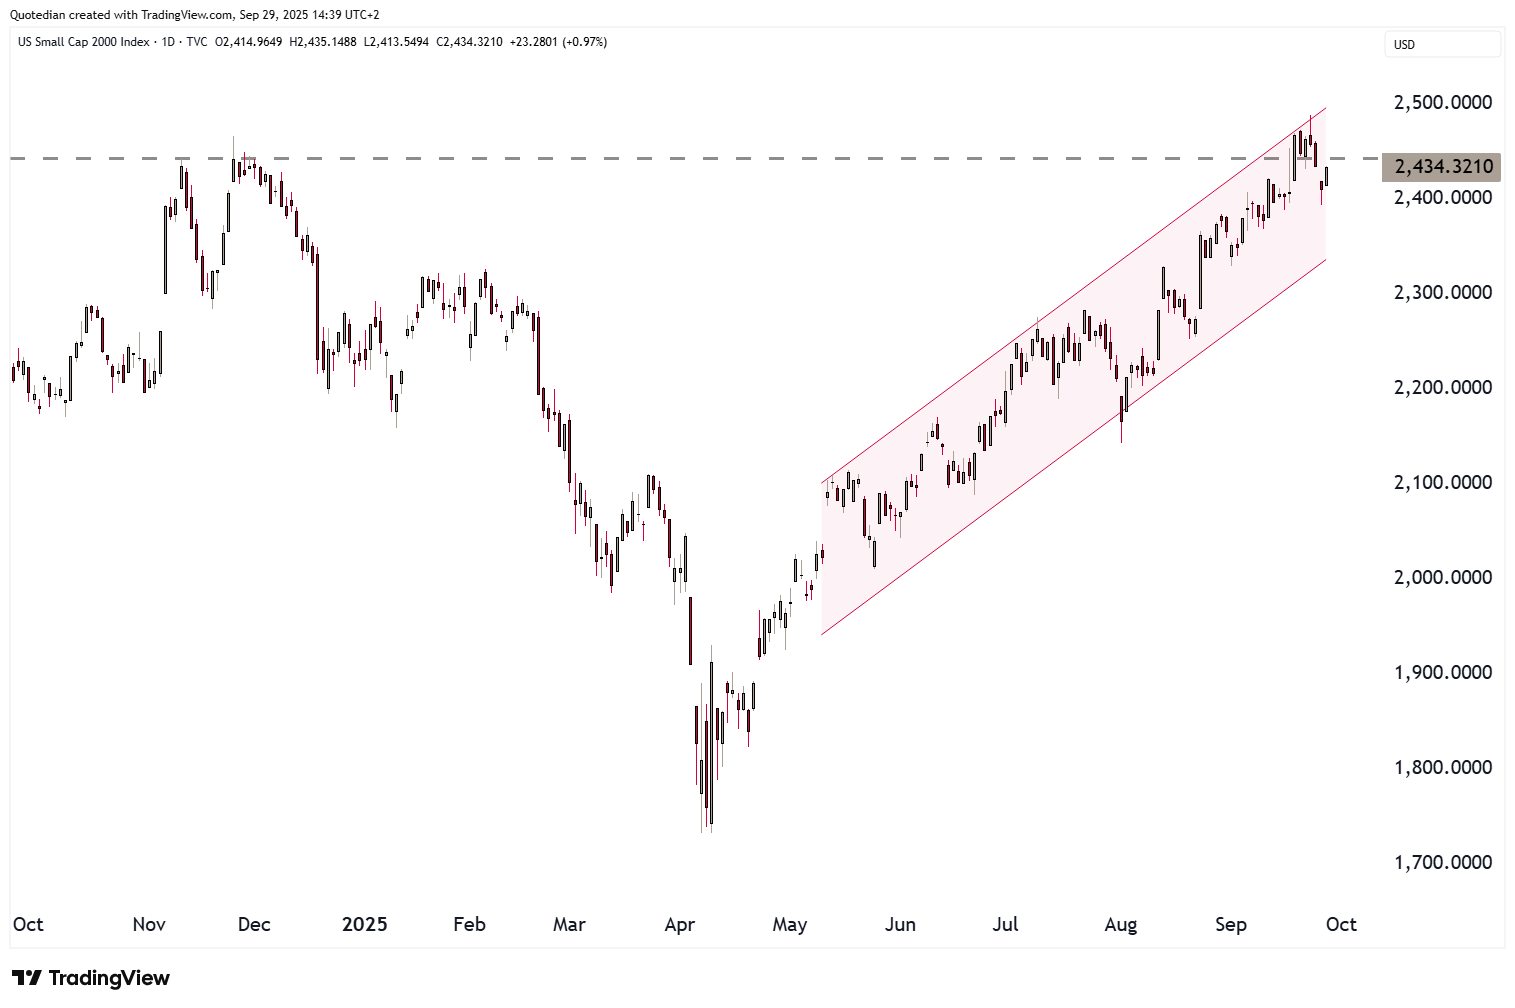
Though, admittedly, we need so a bit more upside follow-through here, otherwise it starts looking like a bull trap:
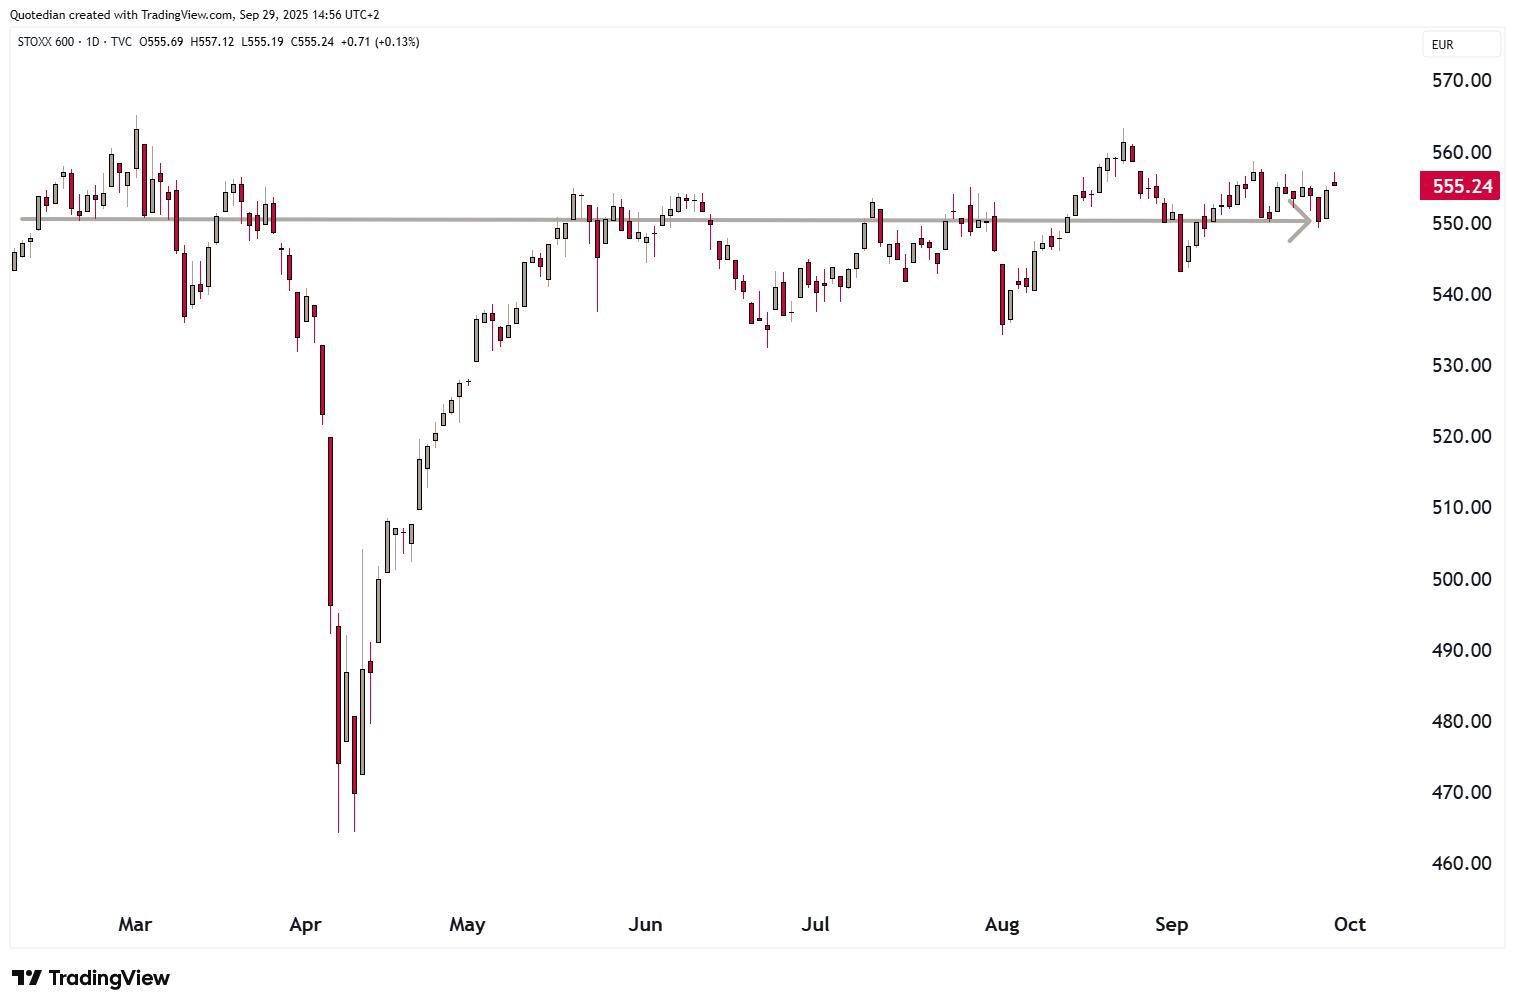
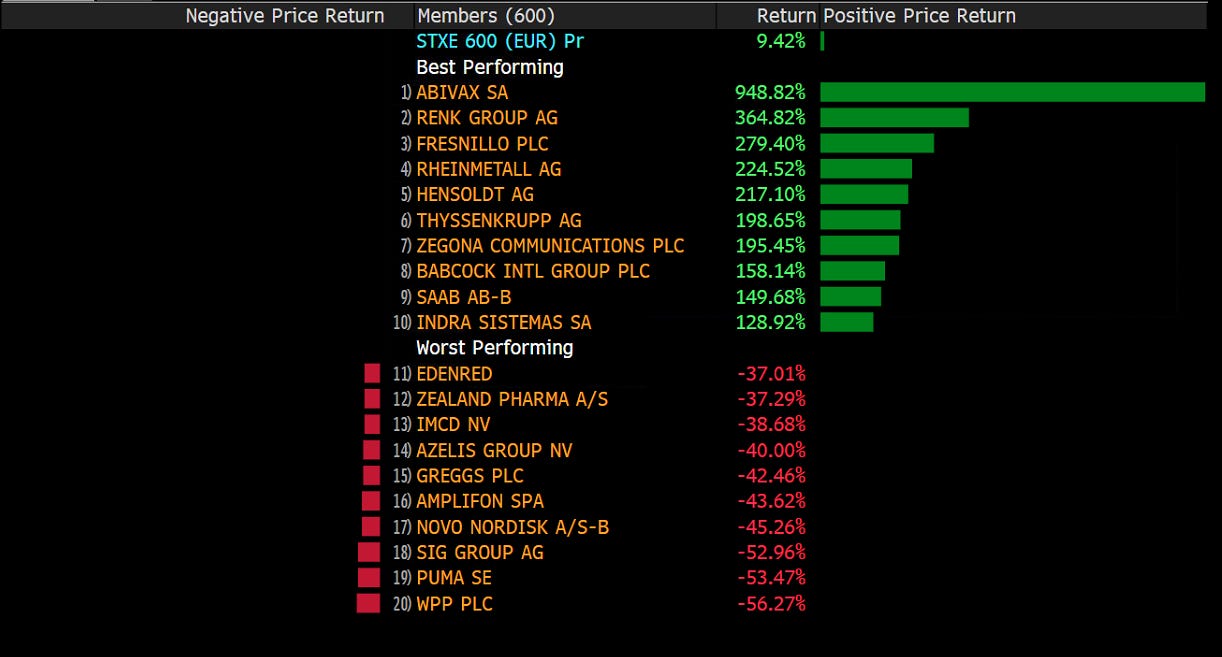
European stocks (SXXP) continue to consolidate frustratingly sideways:
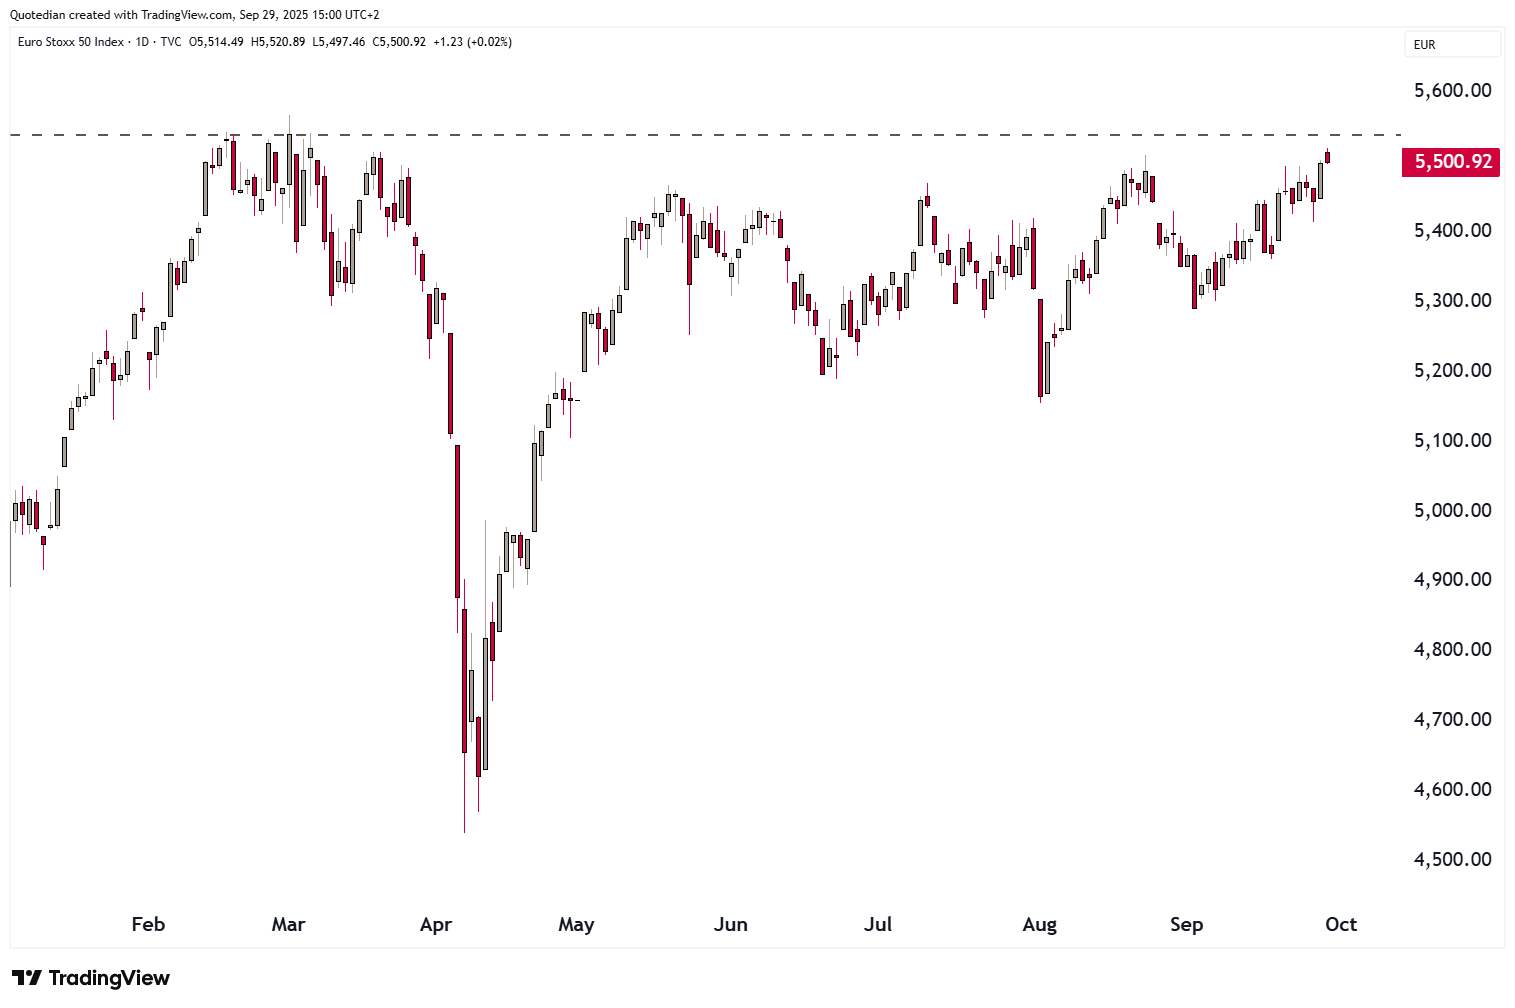
Though the narrower STOXX 50 Euro index (SX5E) is less than a percentage point away from a new all-time closing high:
And on the DAX we have seen a small green sprout with the break on Friday above triangle pattern (dotted lines):
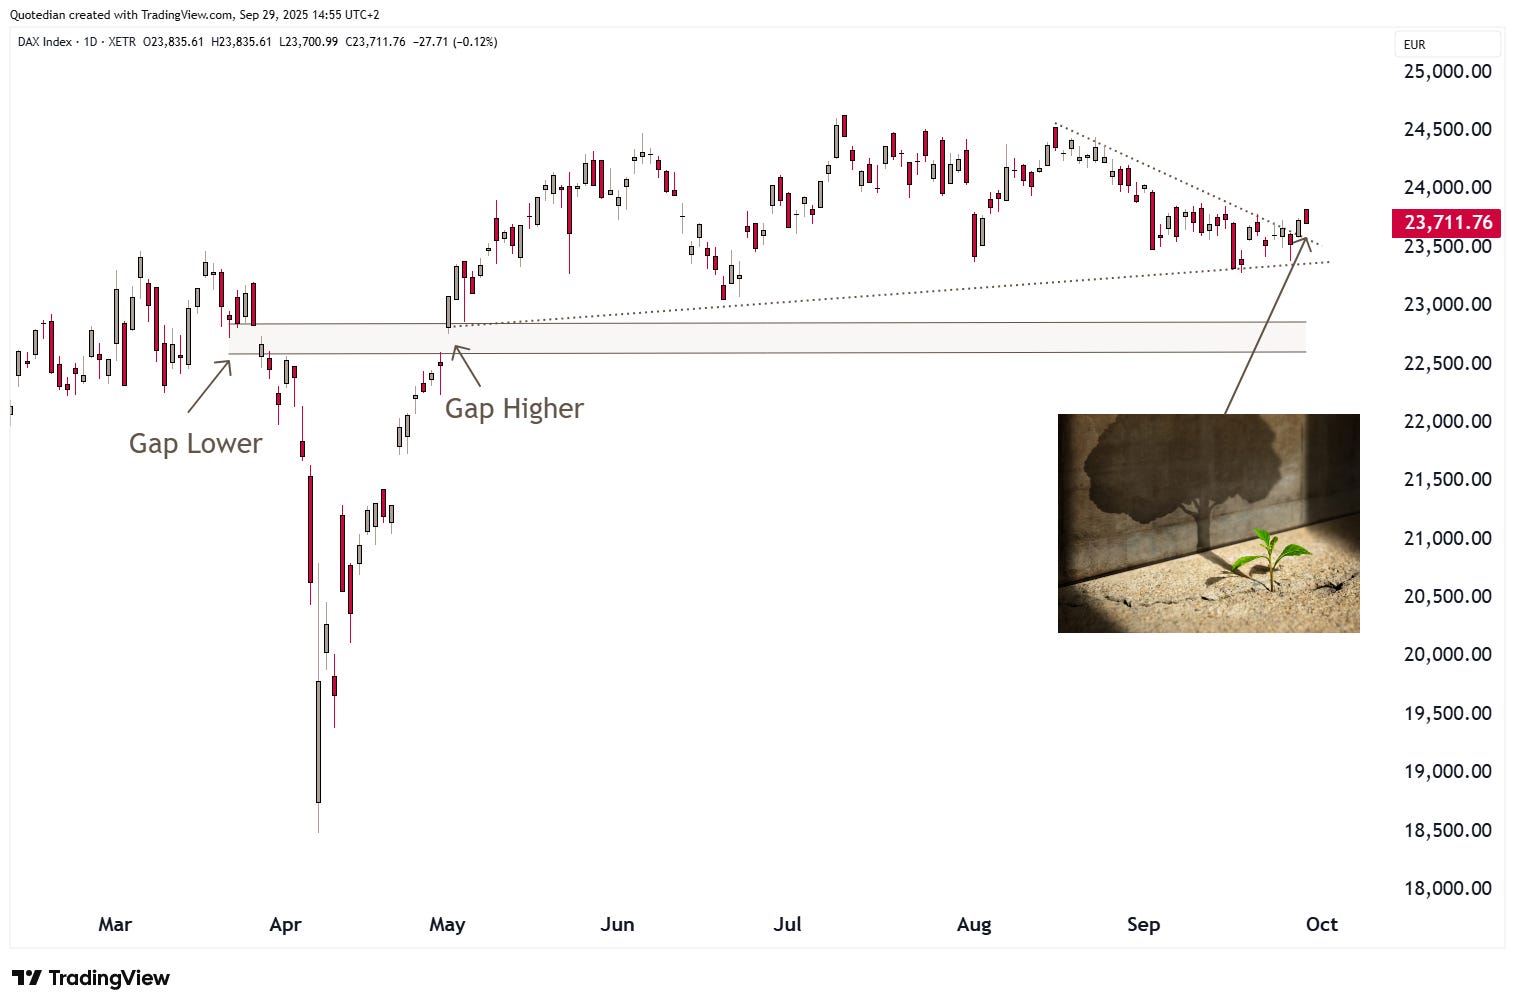
In any case, however boring an index may look on a chart, opportunity is always abound for those willed to look:
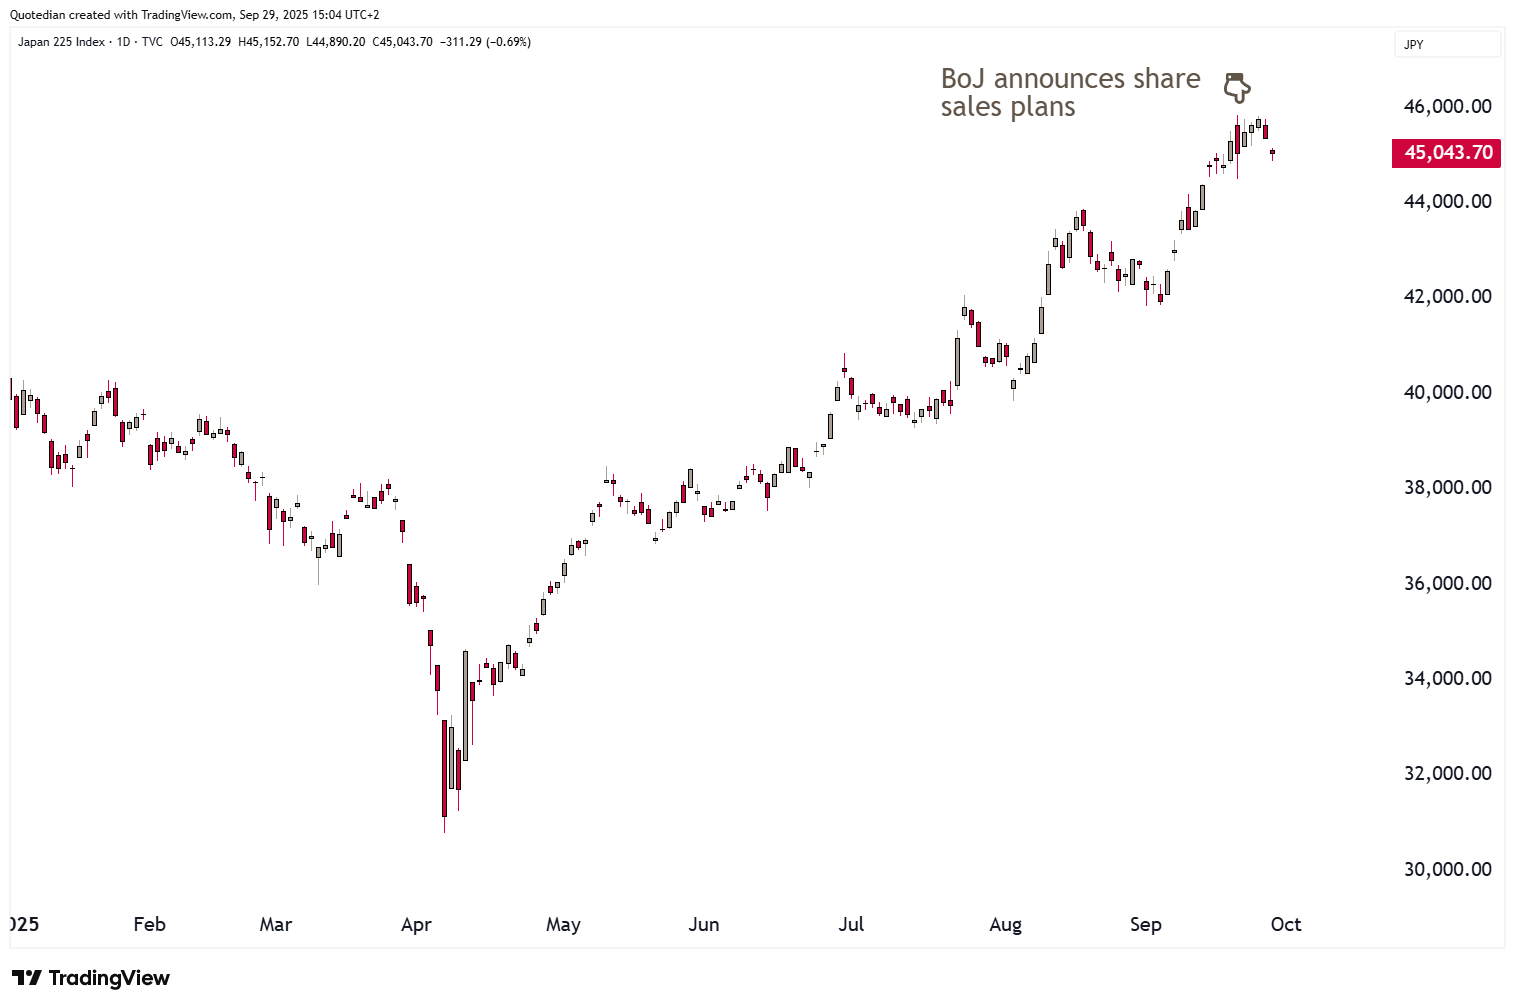
In Asia, Japan’s Nikkei chart looks a bit short-term toppish:
The country’s main party, the LDP, is to vote a new leader (PM) and with five aspirants it seems nobody will win in the first round of voting. And given the pained look of the two top contenders, Takaichi and Koizumi, it seems neither really wants the job:

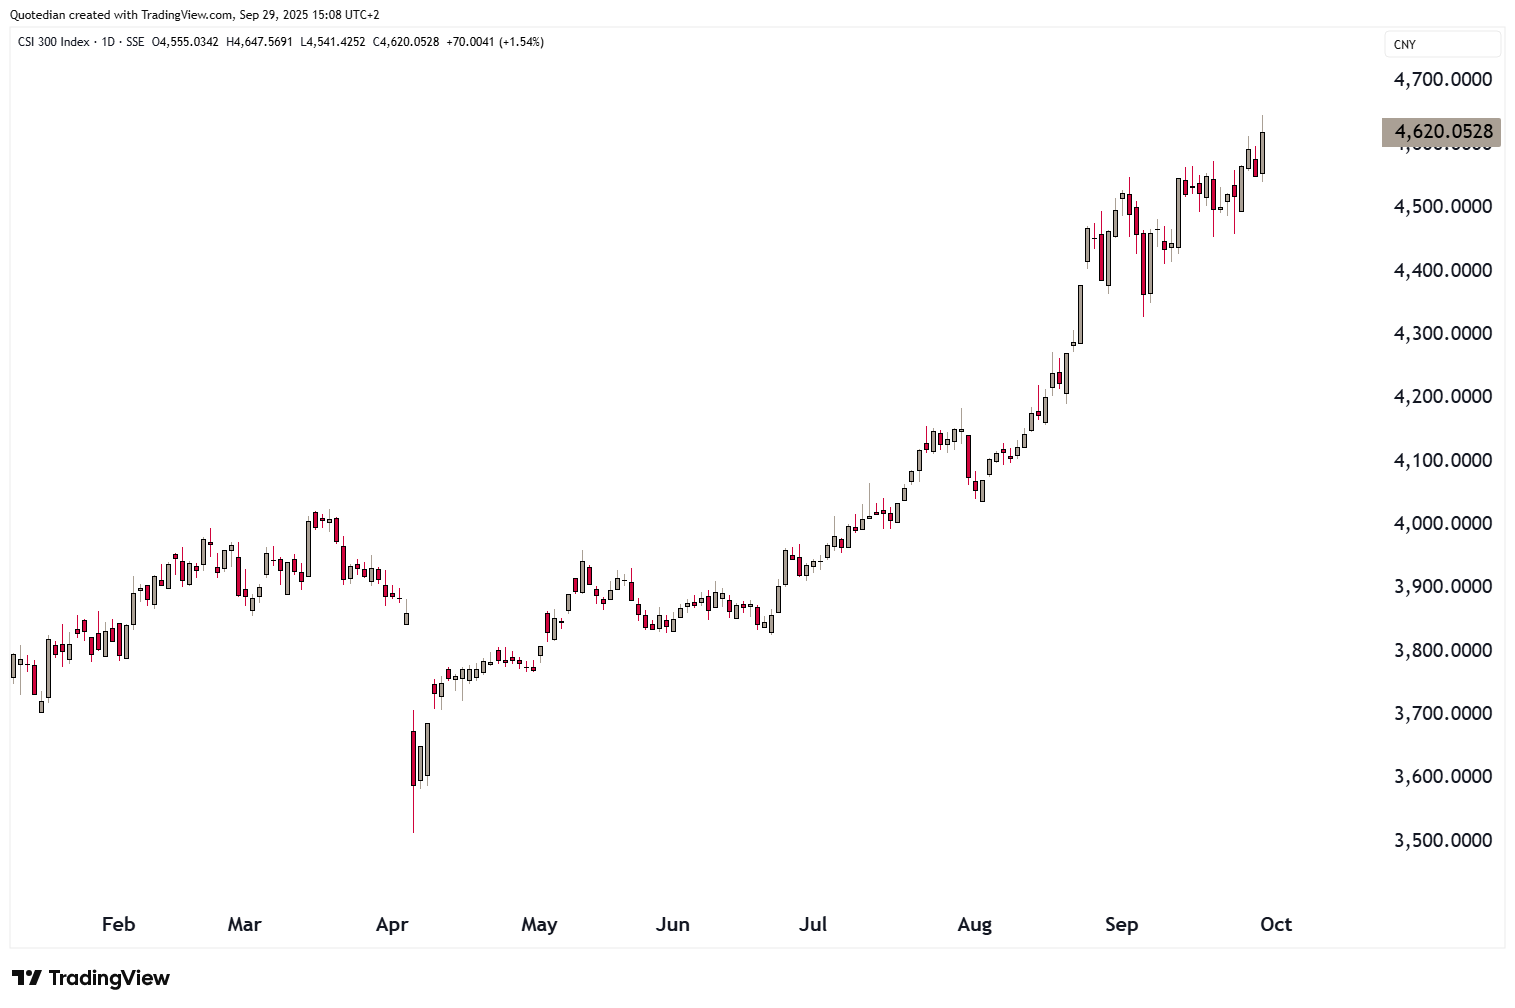
China mainland stocks are flying again and it seems there are still very few foreign passengers on the plane:
Indian stocks (Nifty 50) on other hand, have turned lower again and put in six consecutive sessions of lower prices:
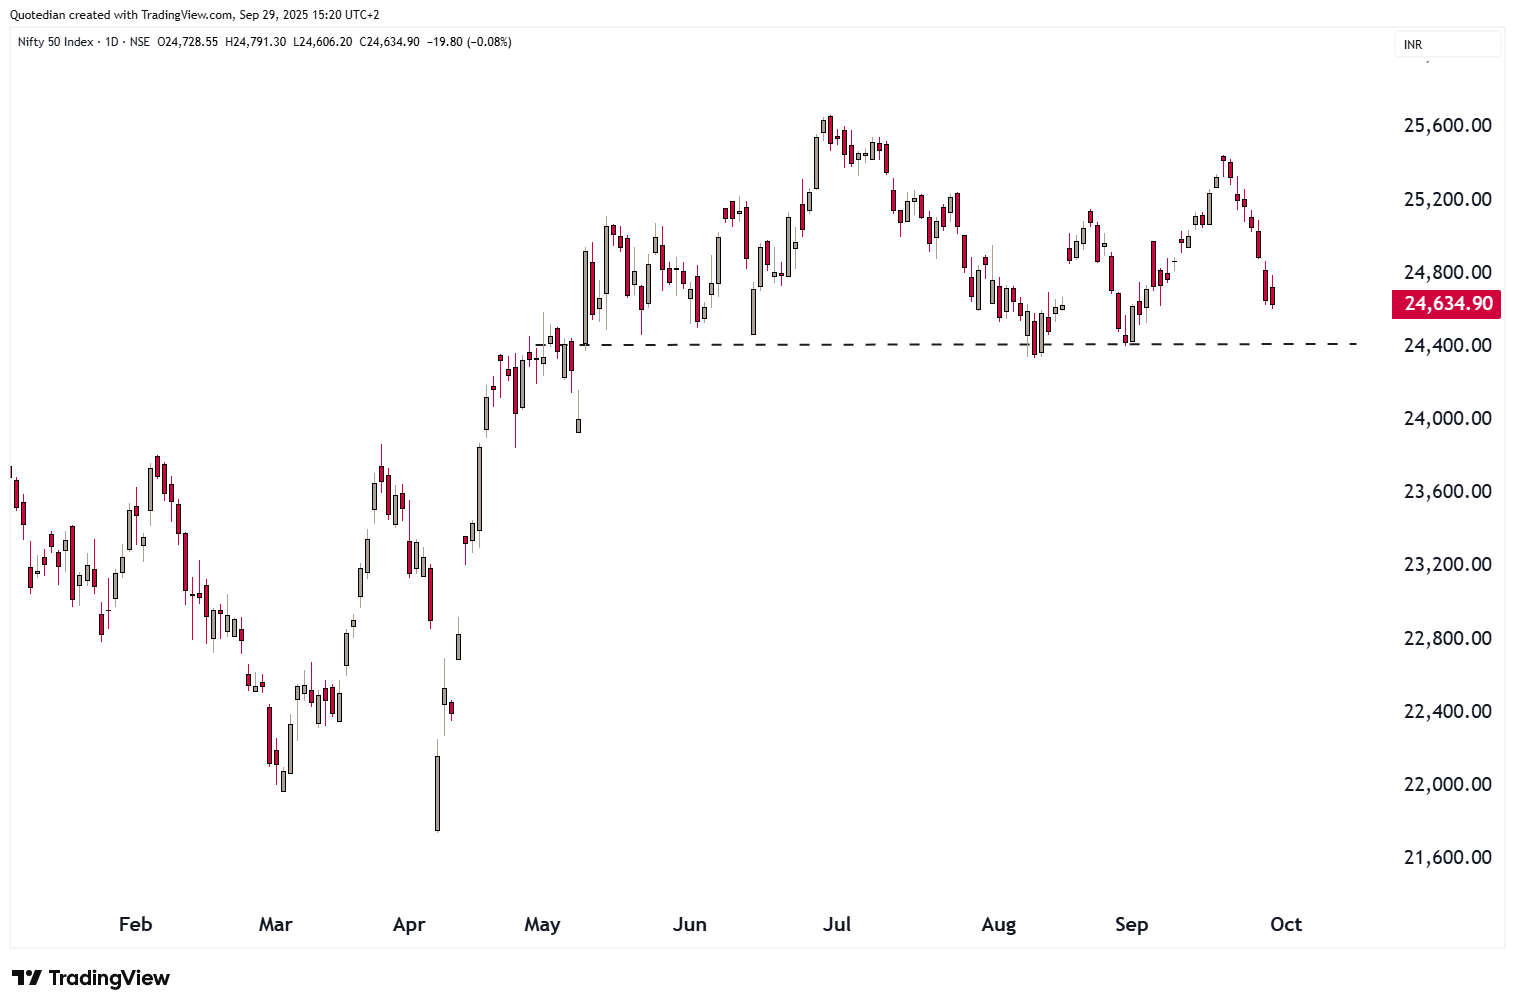
Key support (24,400) is now less than a percentage point away…

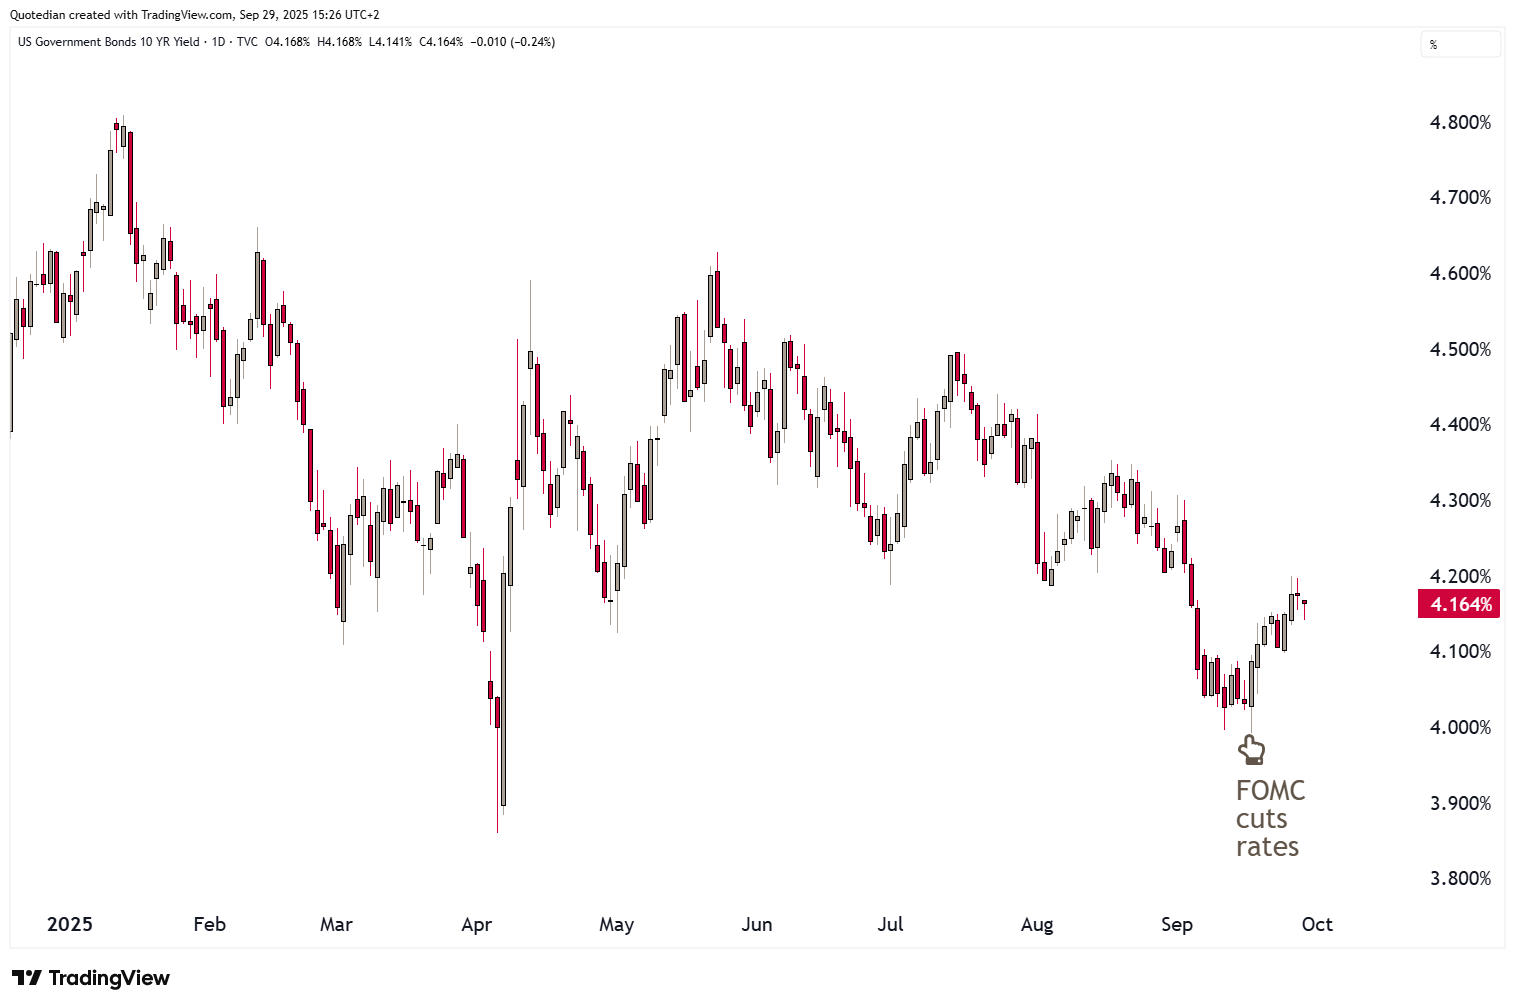
As I wrote in Friday’s QuiCQ (click here), for now, the Fed’s reignition of the rate cut cycle is being closely observed by the bond vigilantes, and so far they do not like what they’re seeing:

Imagine what would have happened after a 50 basis point cut…
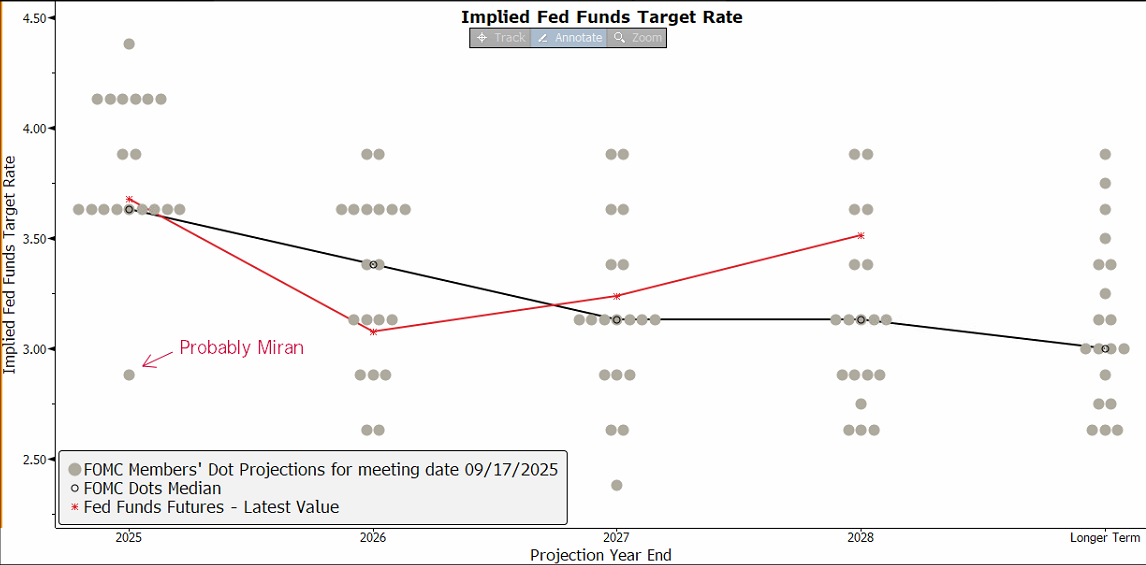
Or, what will happen if Trump’s Fed boy Miran would get his way of five more cuts by year end:
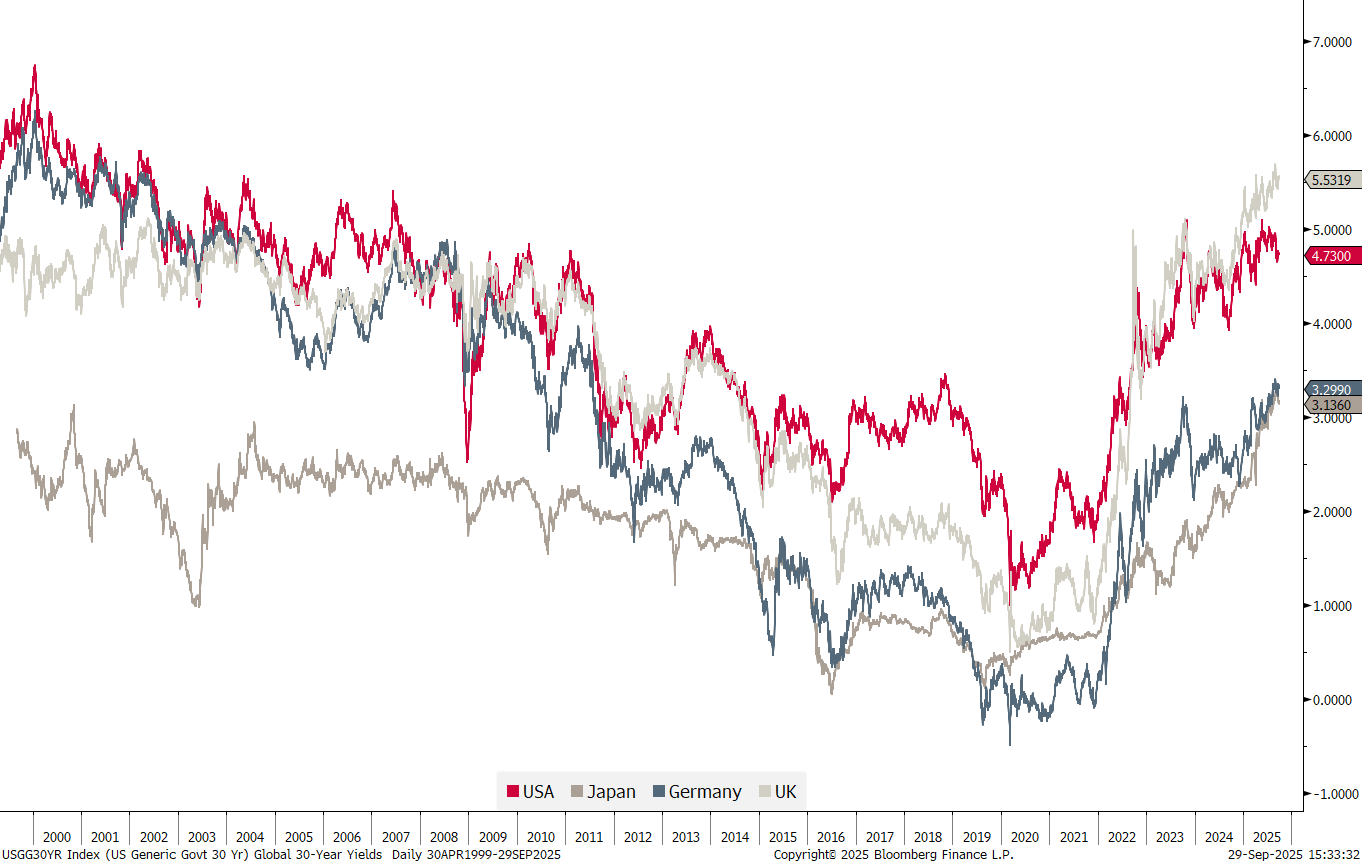
30-year yields are screaming bloody murder anyway:
Not only did we (well, not we, but Trump) rate cuts, but recent economic data has been surprising to the upside too. The chart below shows the Citigroup Economic Surprise index (grey) and the US 10-year yield (red):
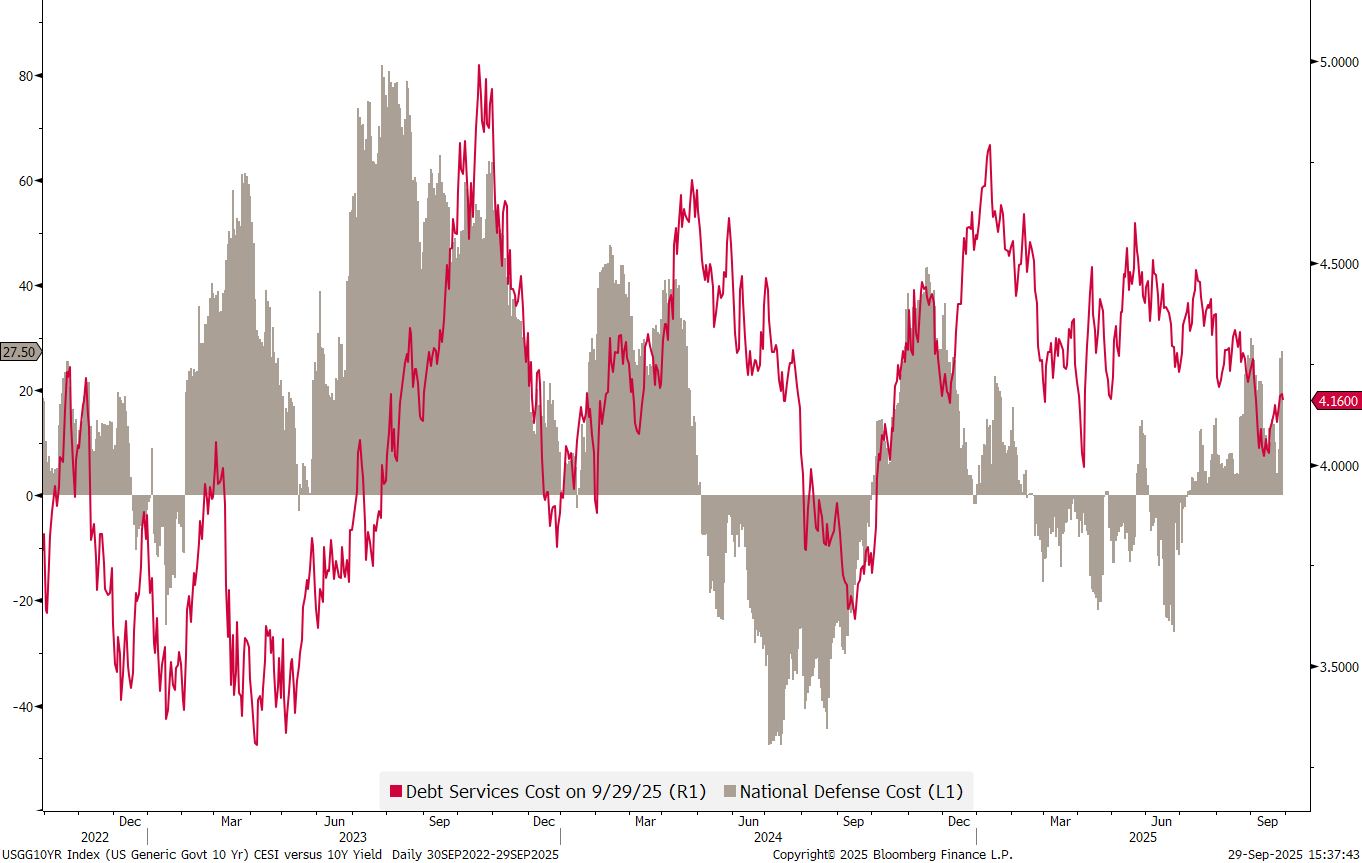
More positive surprises will bring more upside pressure on yields… and in that context, market participants will be closely watching this weeks economic data
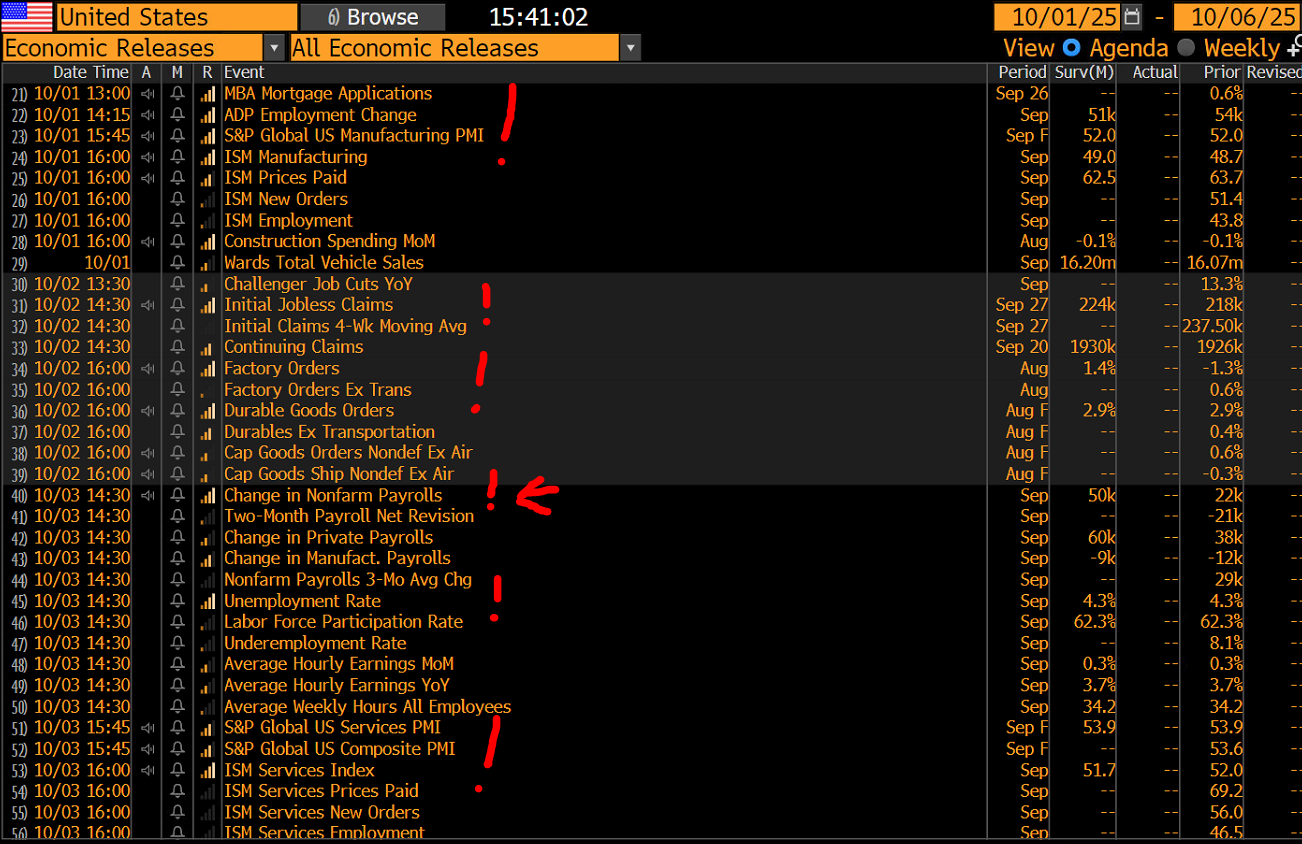
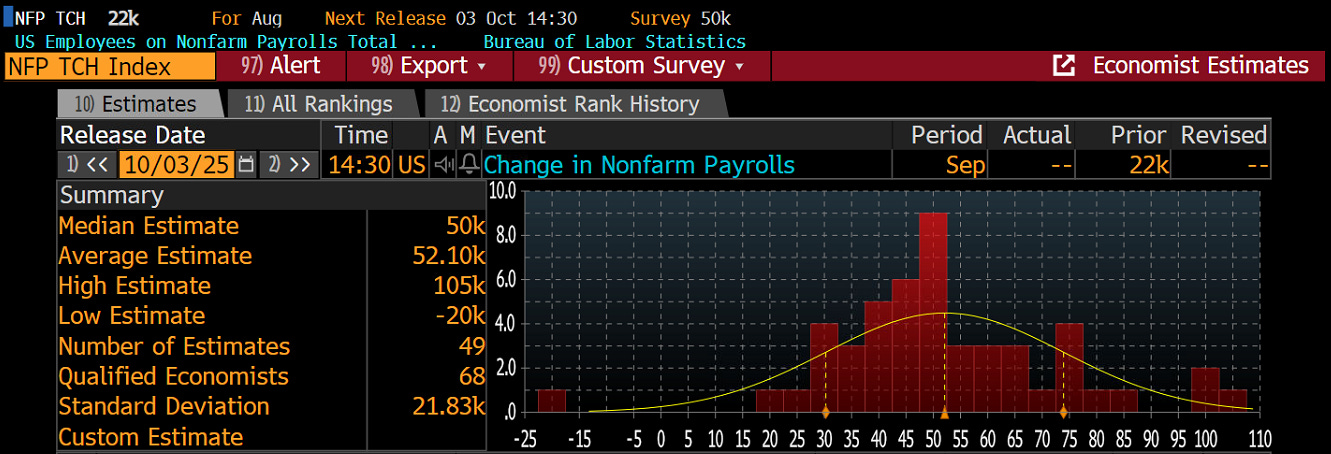
and especially Friday’s non-farm payroll:
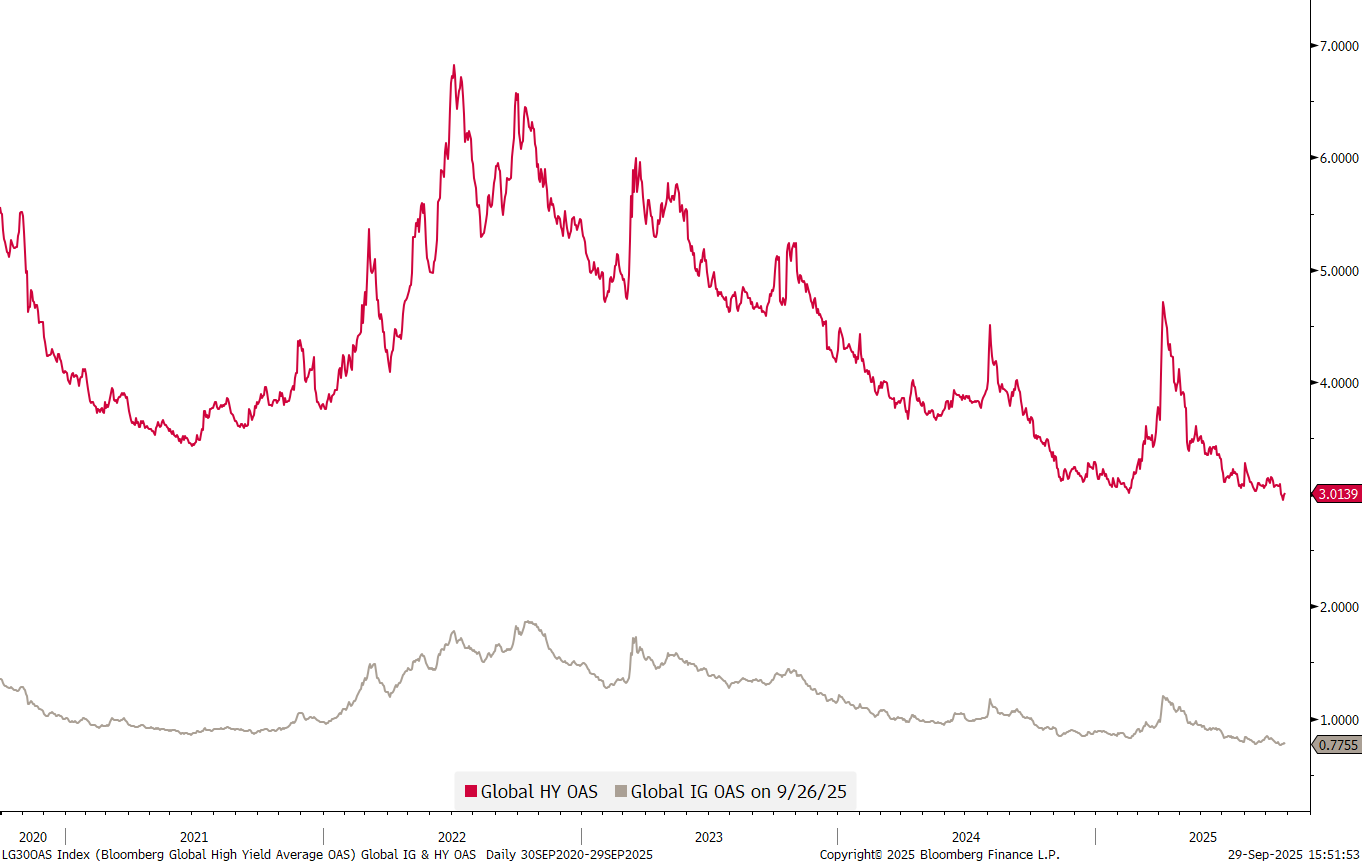
On the credit spread side of matters, the squeeze continues:


In currency markets, the US Dollar is hanging (just about) on to its wide, long-term uptrend channel:
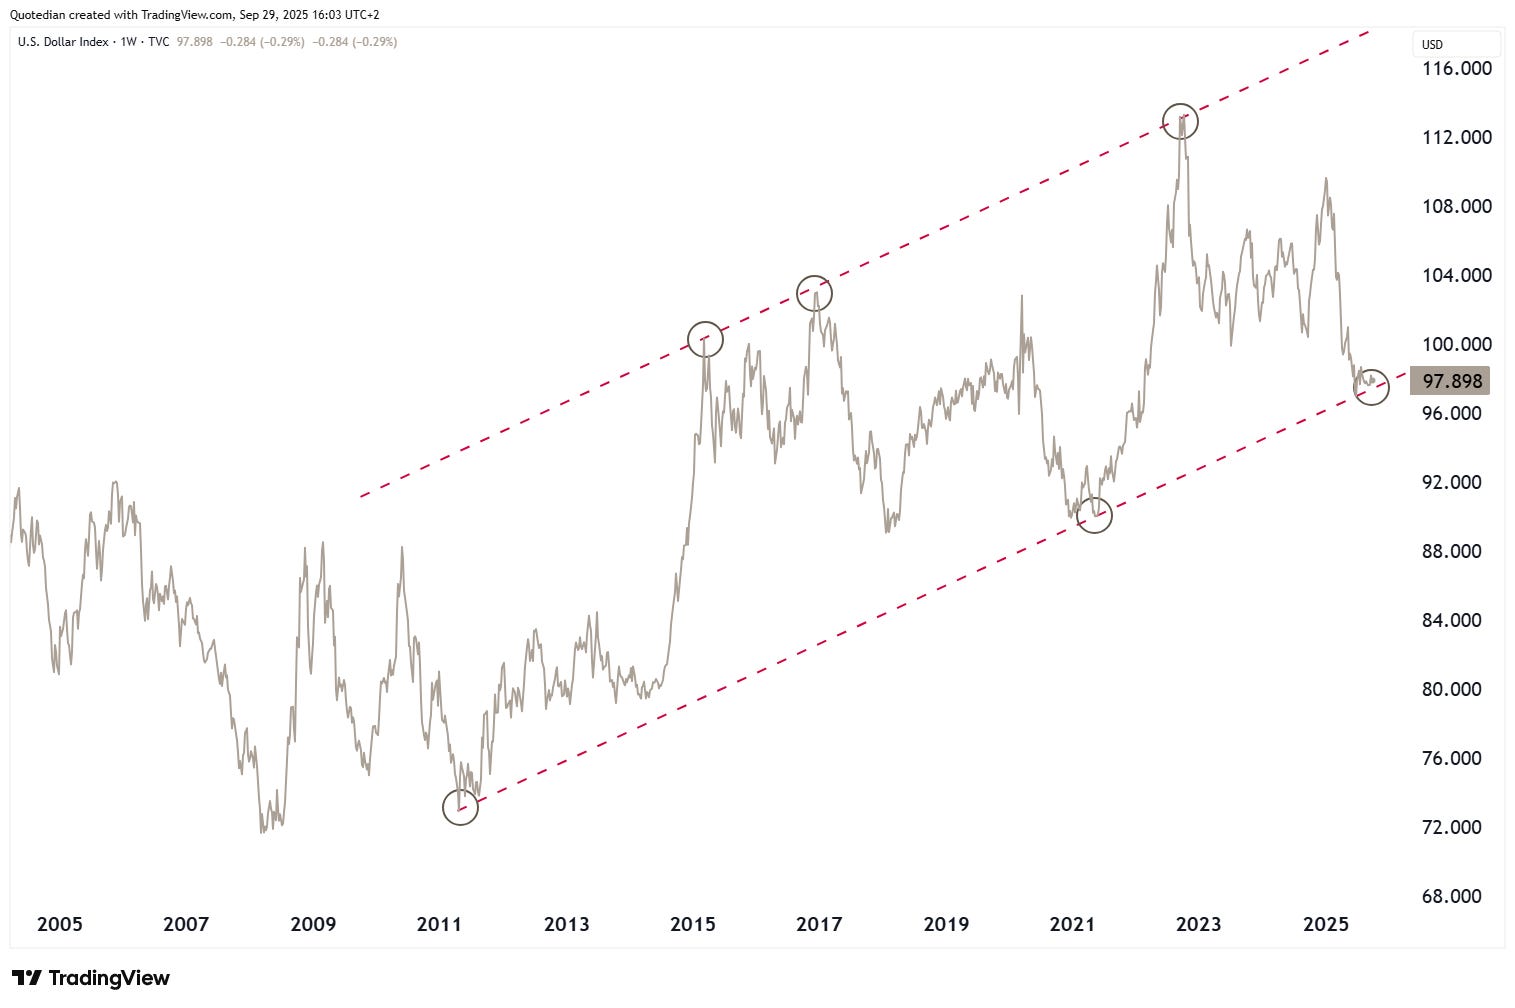
If the Trump I versus the Trump II playbook continues to hold, the US Dollar could turn higher from here:
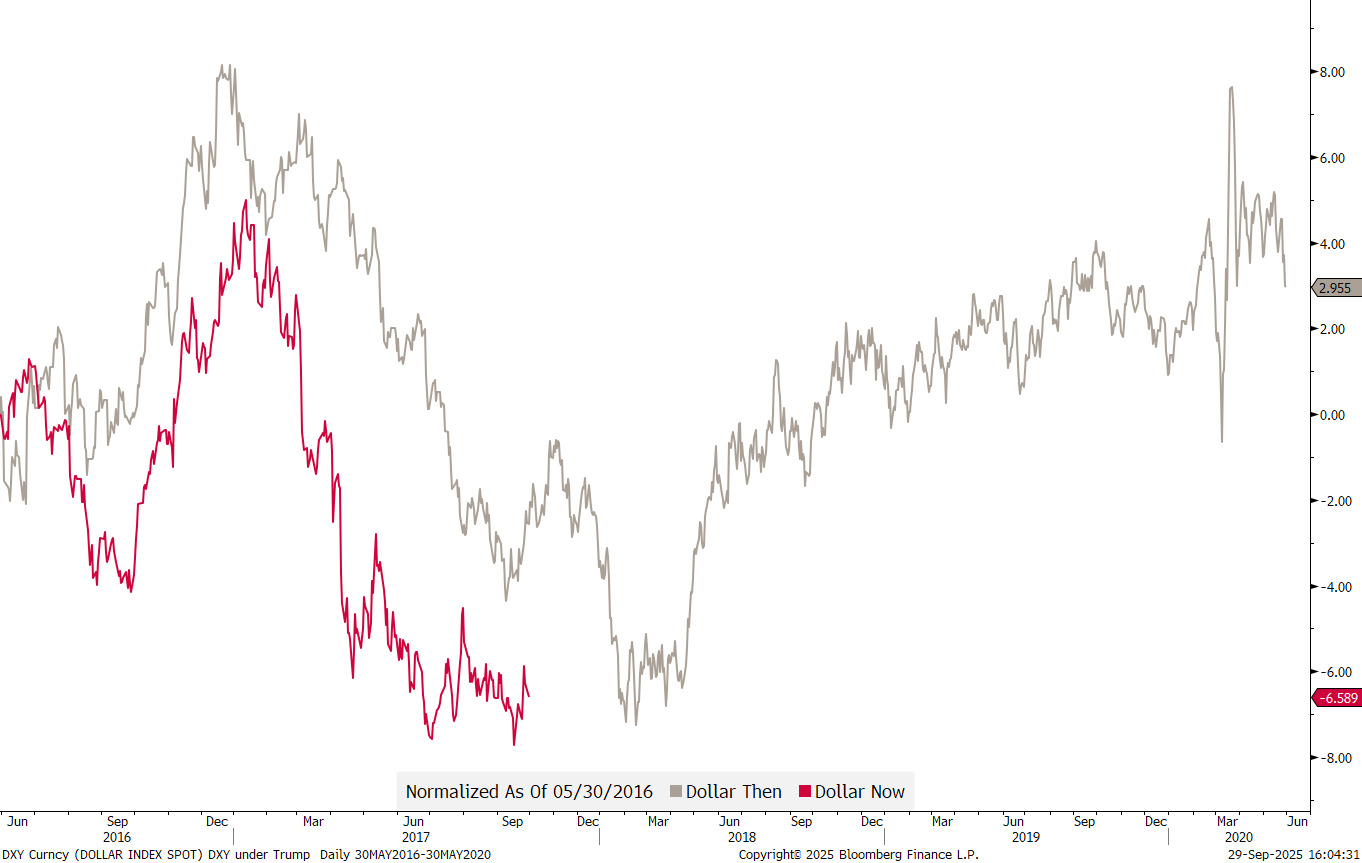
But as expressed in our last quarterly outlook (click here), this is not our main view. Rather, we see additional Dollar weakness ahead:
Remember that Citigroup Economic surprise (grey) and US 10-year yield (red) chart from the previous section? This happens when we also overlay the US Dollar index (DXY):
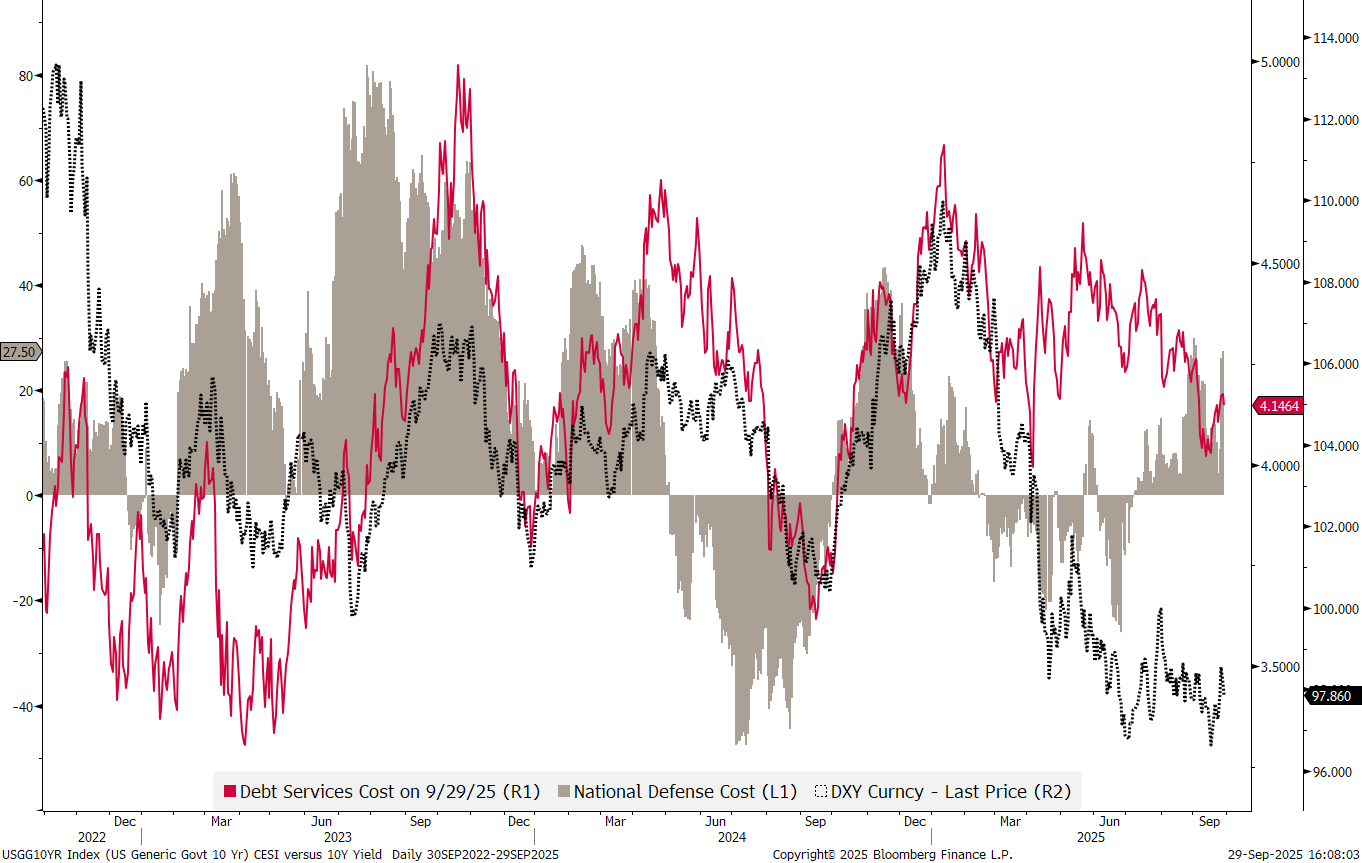
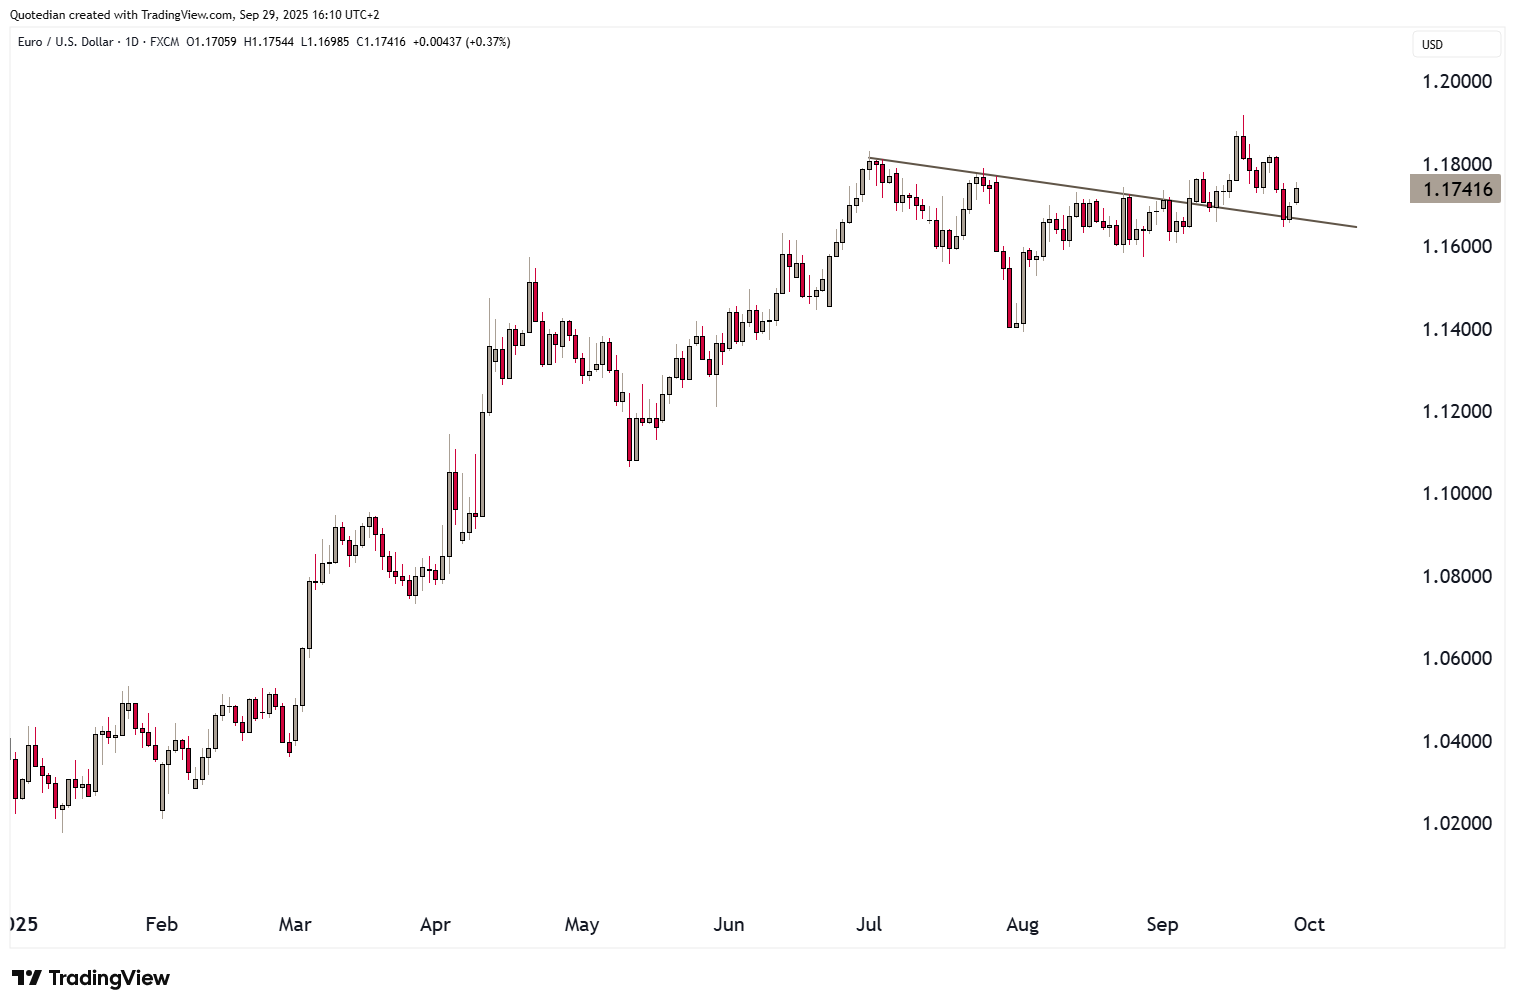
Very, very little $-strength given the pick up in the CESI and yields. Furthermore, the chart of the most important $-cross, the EUR/USD looks bullish the EUR (i.e. bearish the US Dollar):
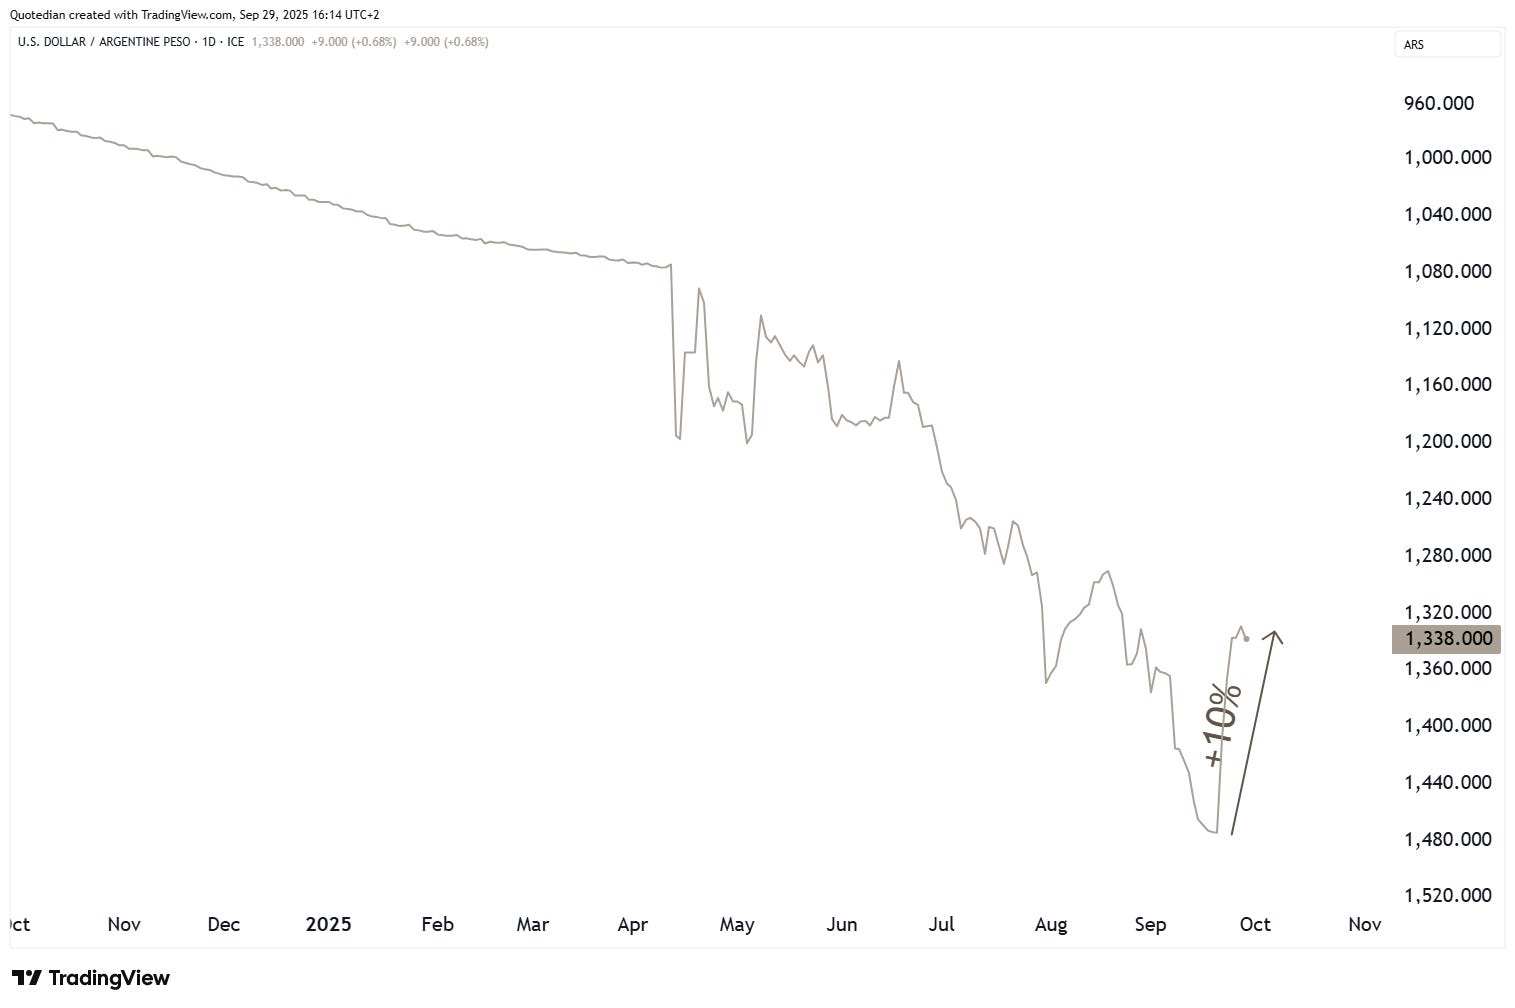
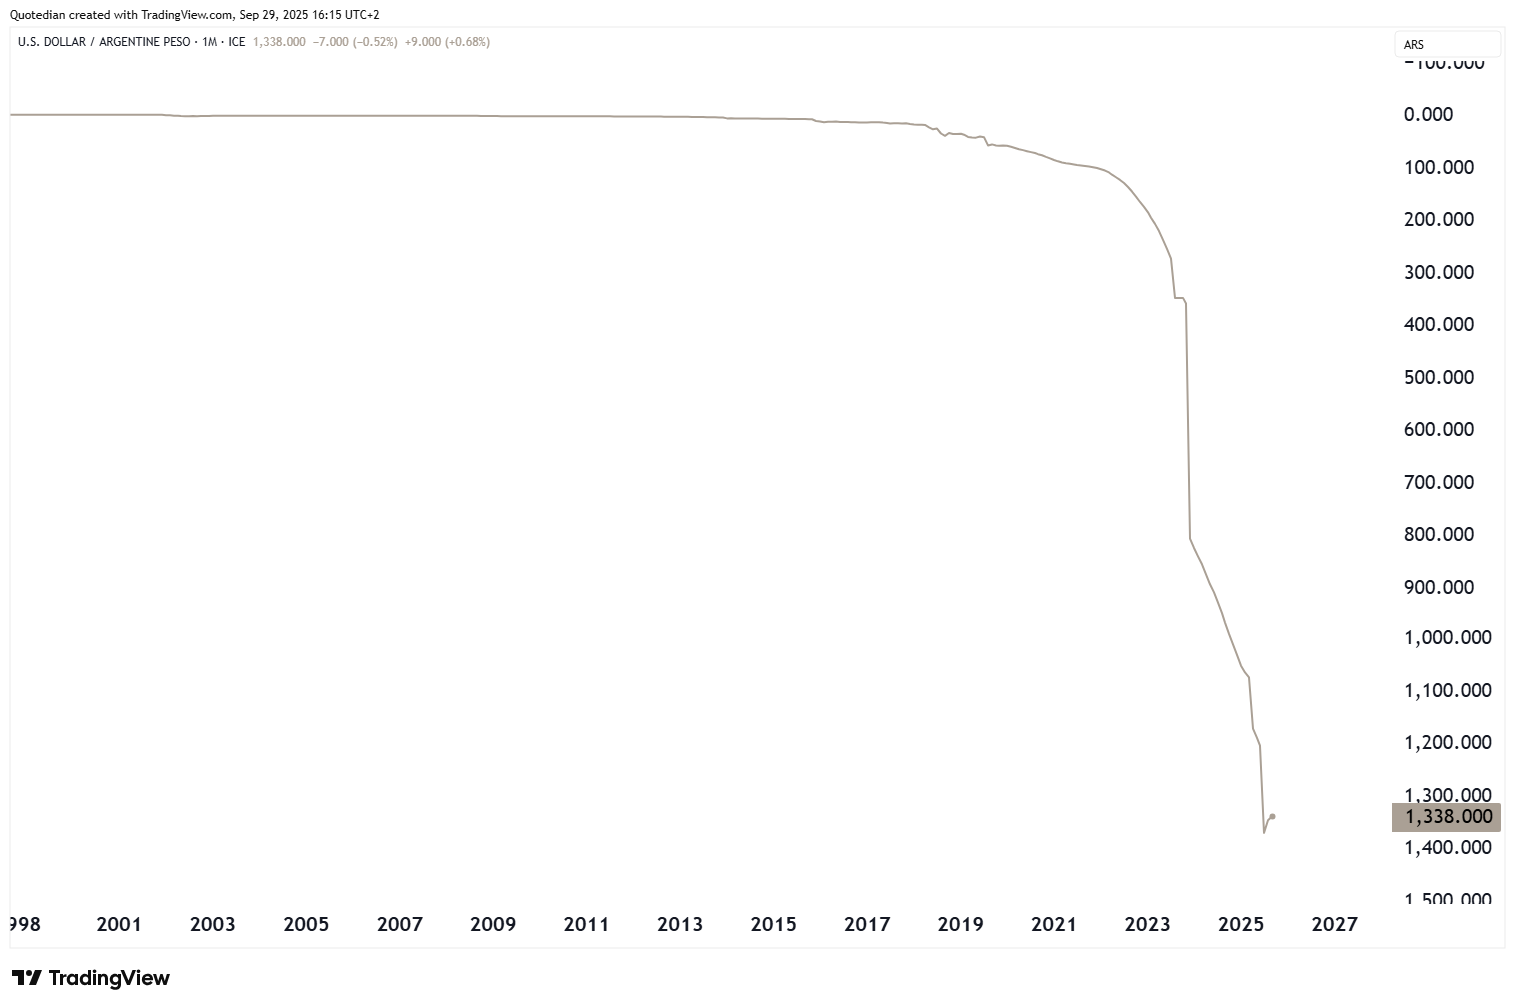
In Latam, the Argentina Peso (ARS) has been able to rally 10% as President Javier Milei is racing to contain the crisis:
In the bigger scheme of things however …
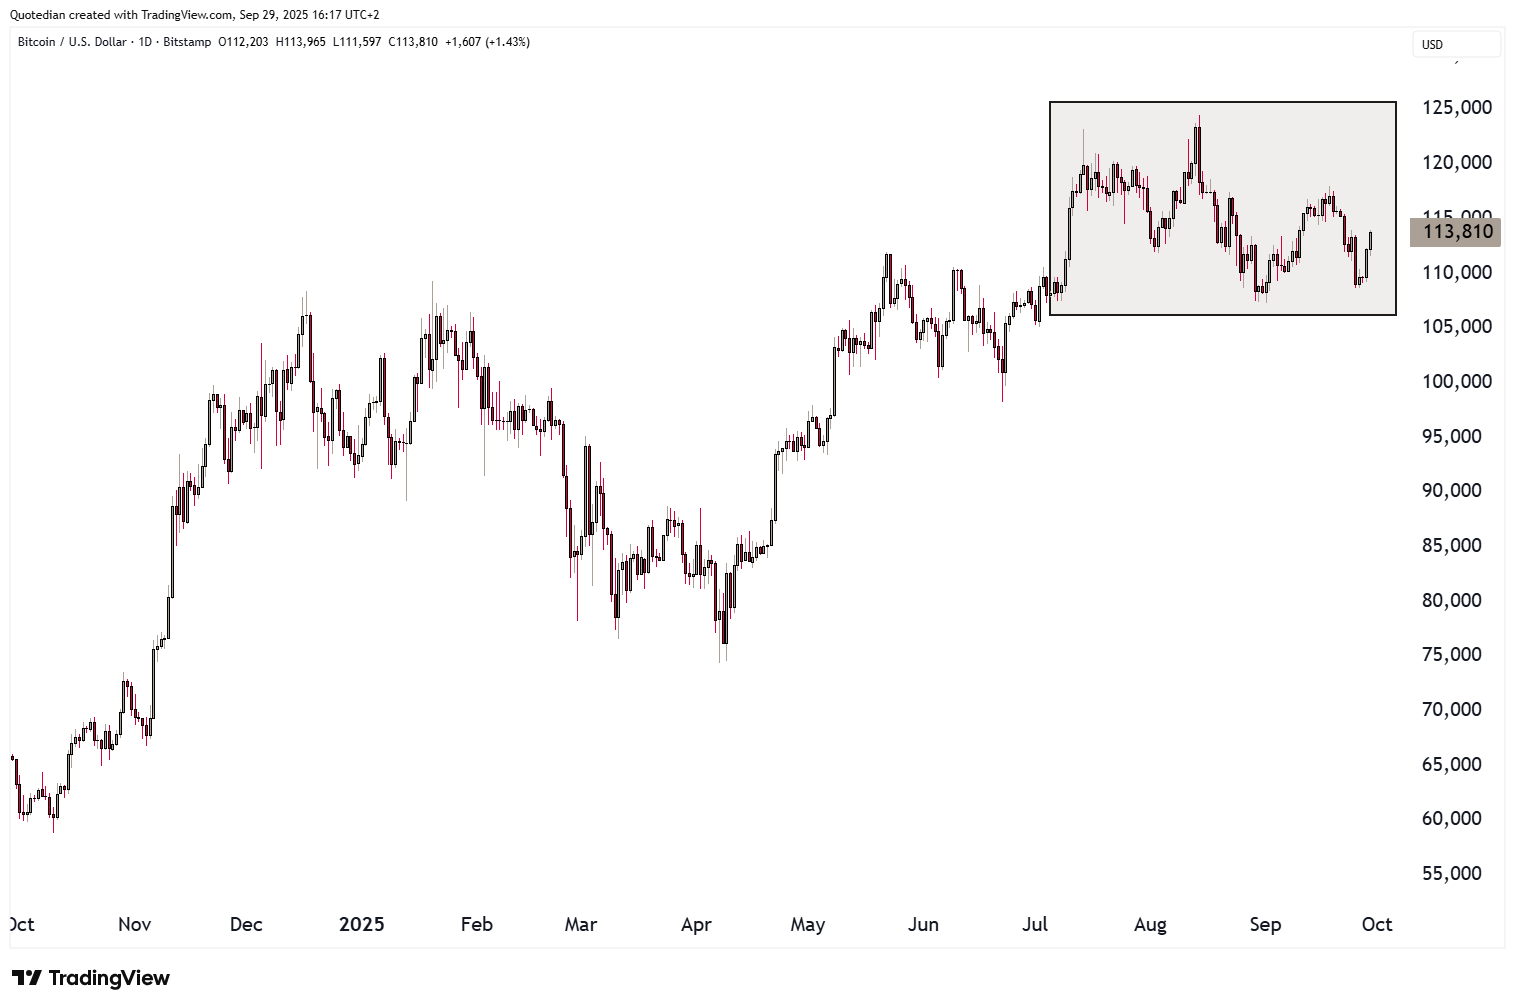
In cryptocurrencies, Bitcoin continues within its ‘consolidation box’:

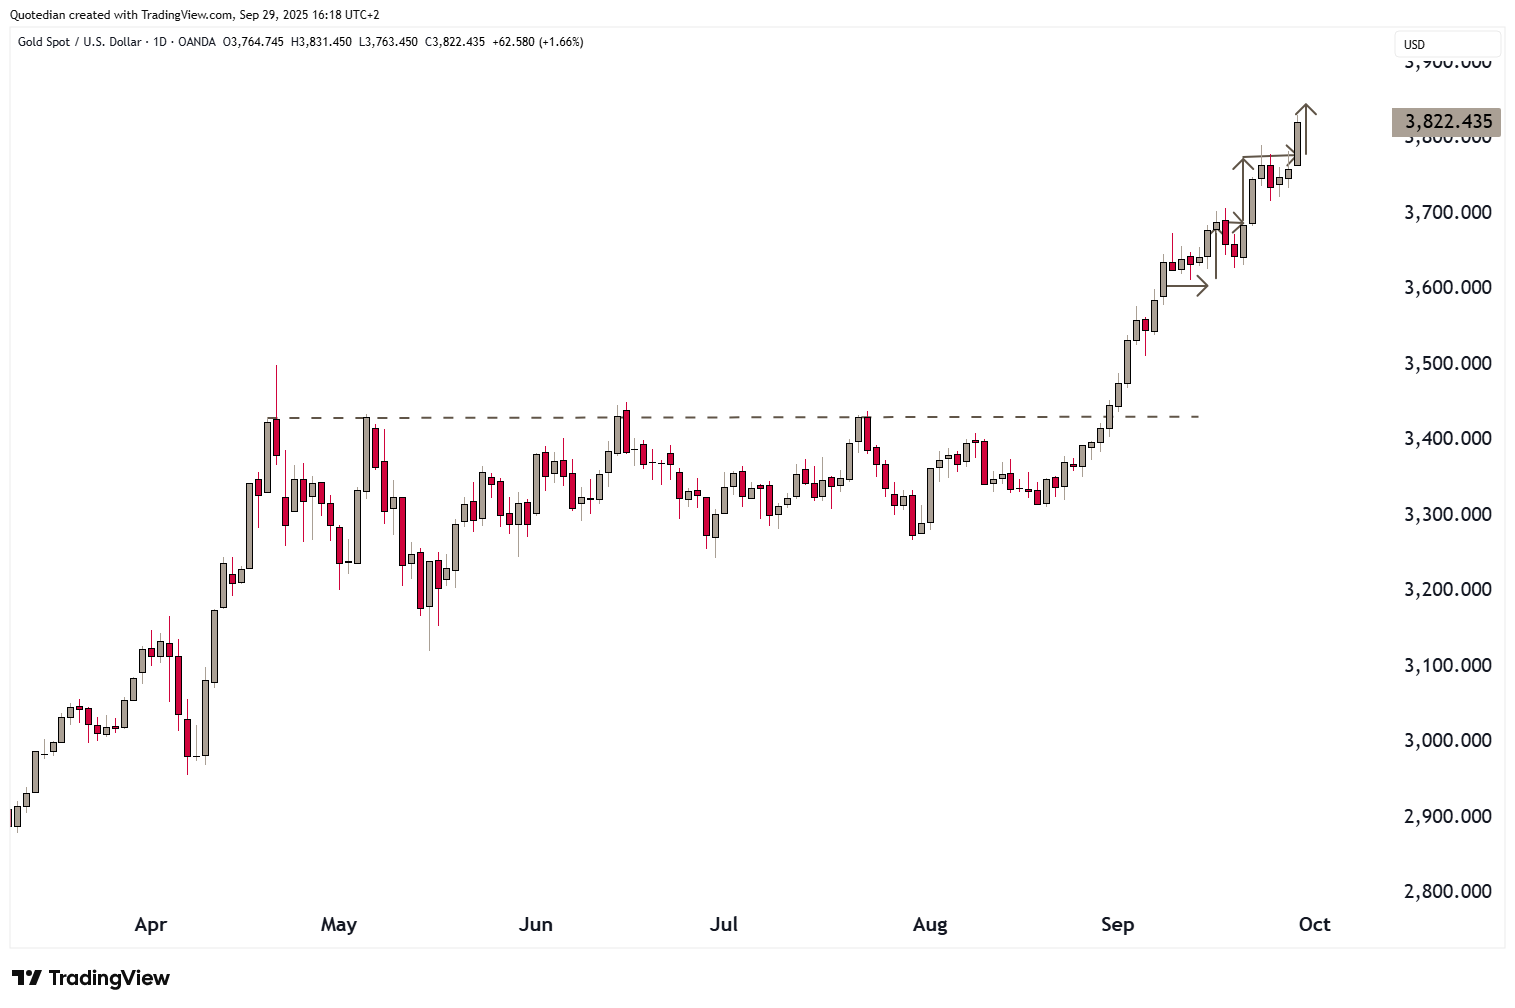
And finally, in global commodity markets, Gold has continued as expected its uptrend:
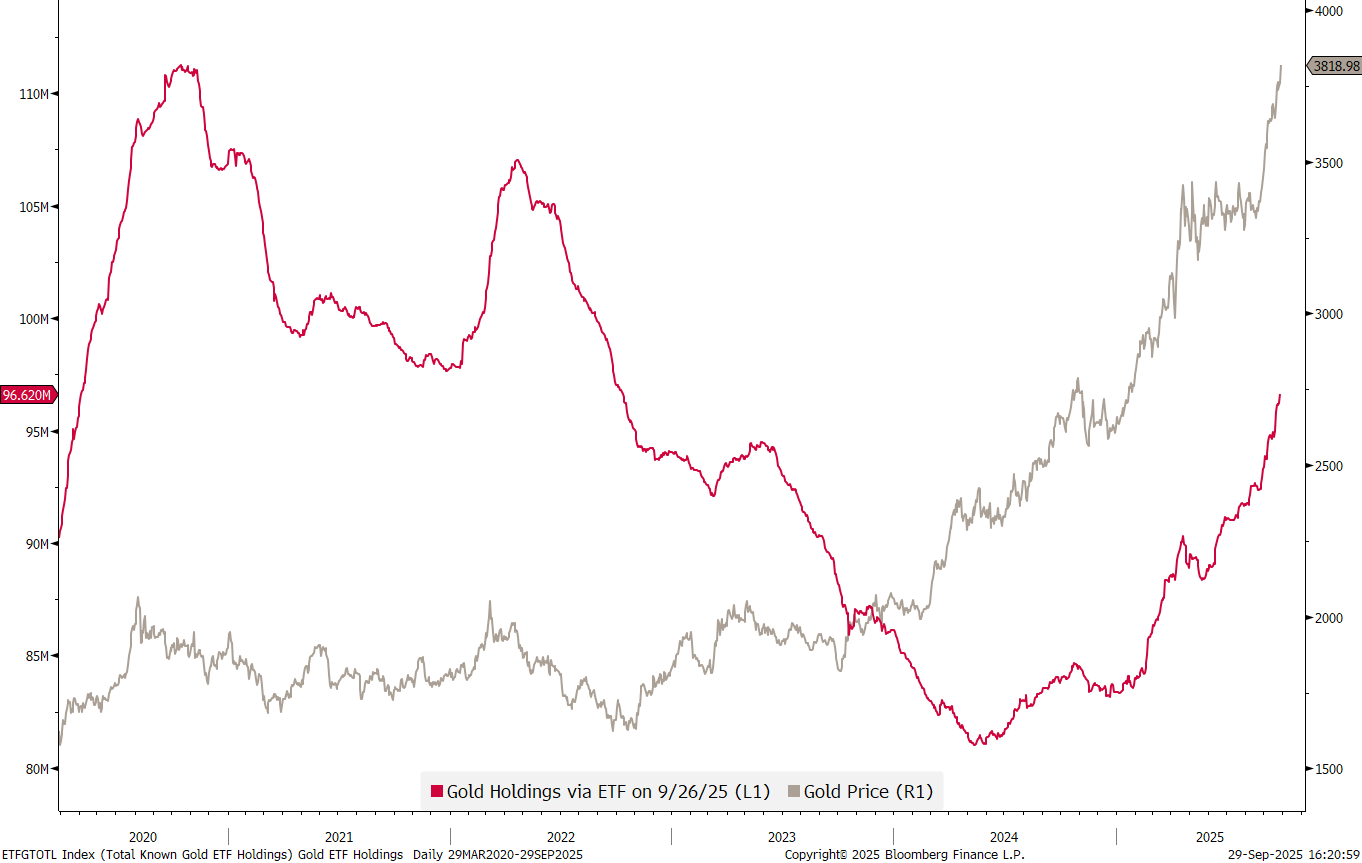
Gold is living through a “goldilock” (pun intended) period - not only are inflationary pressures and general central bank buying helping, but also retail investors are now jumping on the bandwagon, as witnessed by the amount of gold holdings via ETFs (red line):
And back to the theme of central bank buying … when countries in, let’s call it the global south, are seeing news headlines such as the following,


I am sure they will have second thoughts on how many Euros they should hold at the ECB…
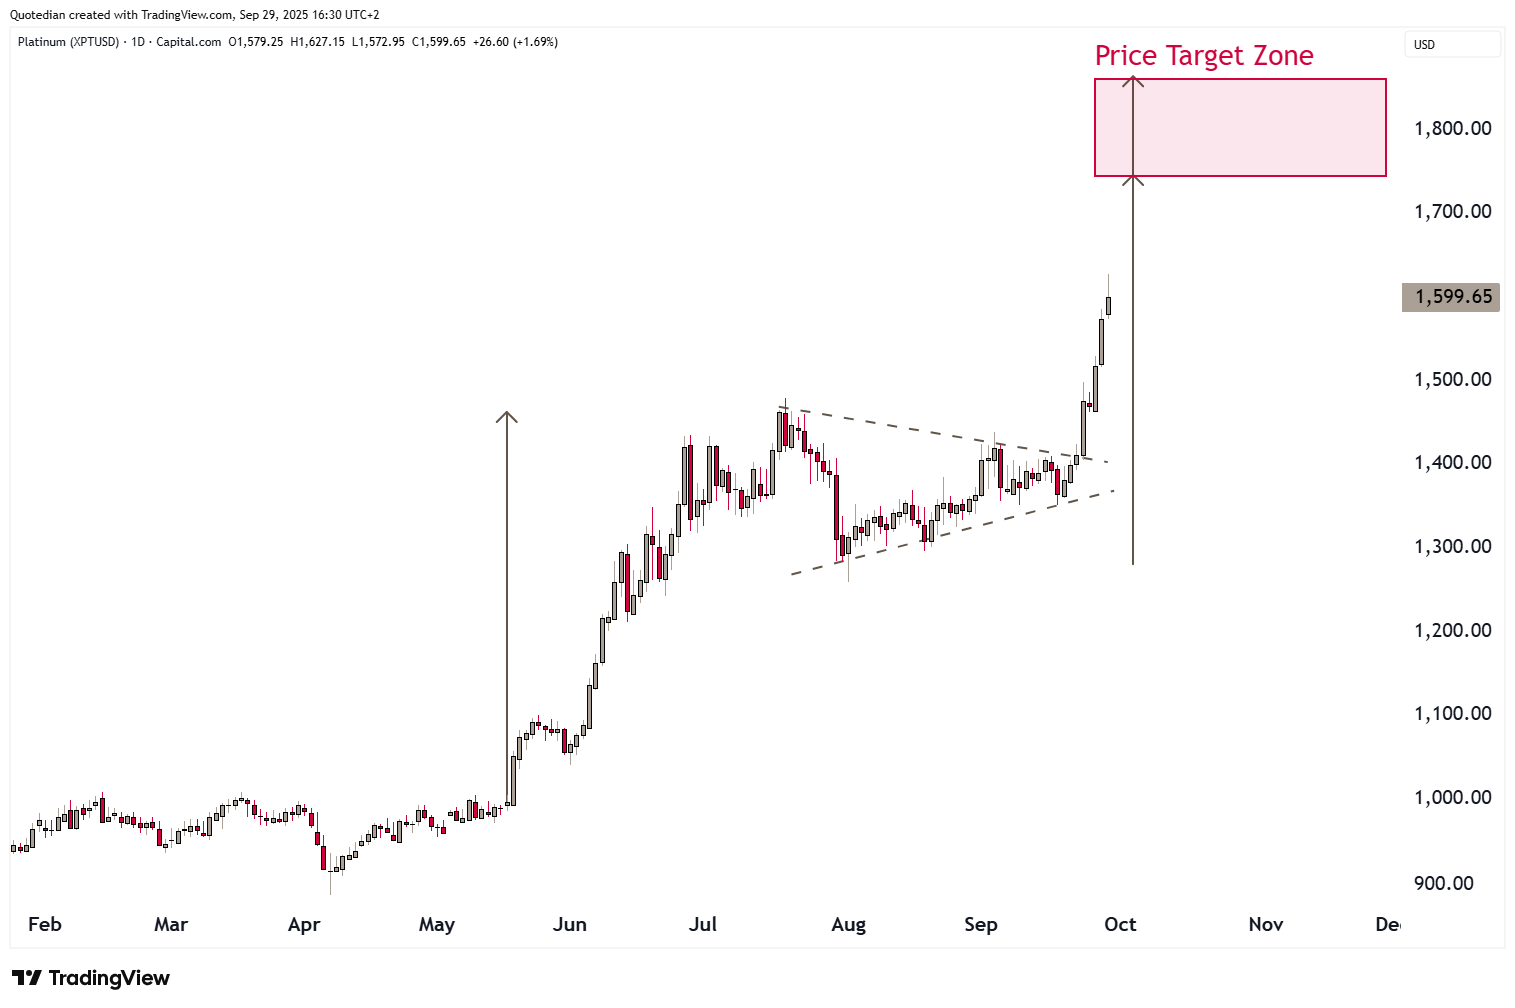
But the real superstar continues to Platinum (XPT) which from a technical analysis point of view has price target zone somewhere between 10% and 15% higher from the current price:
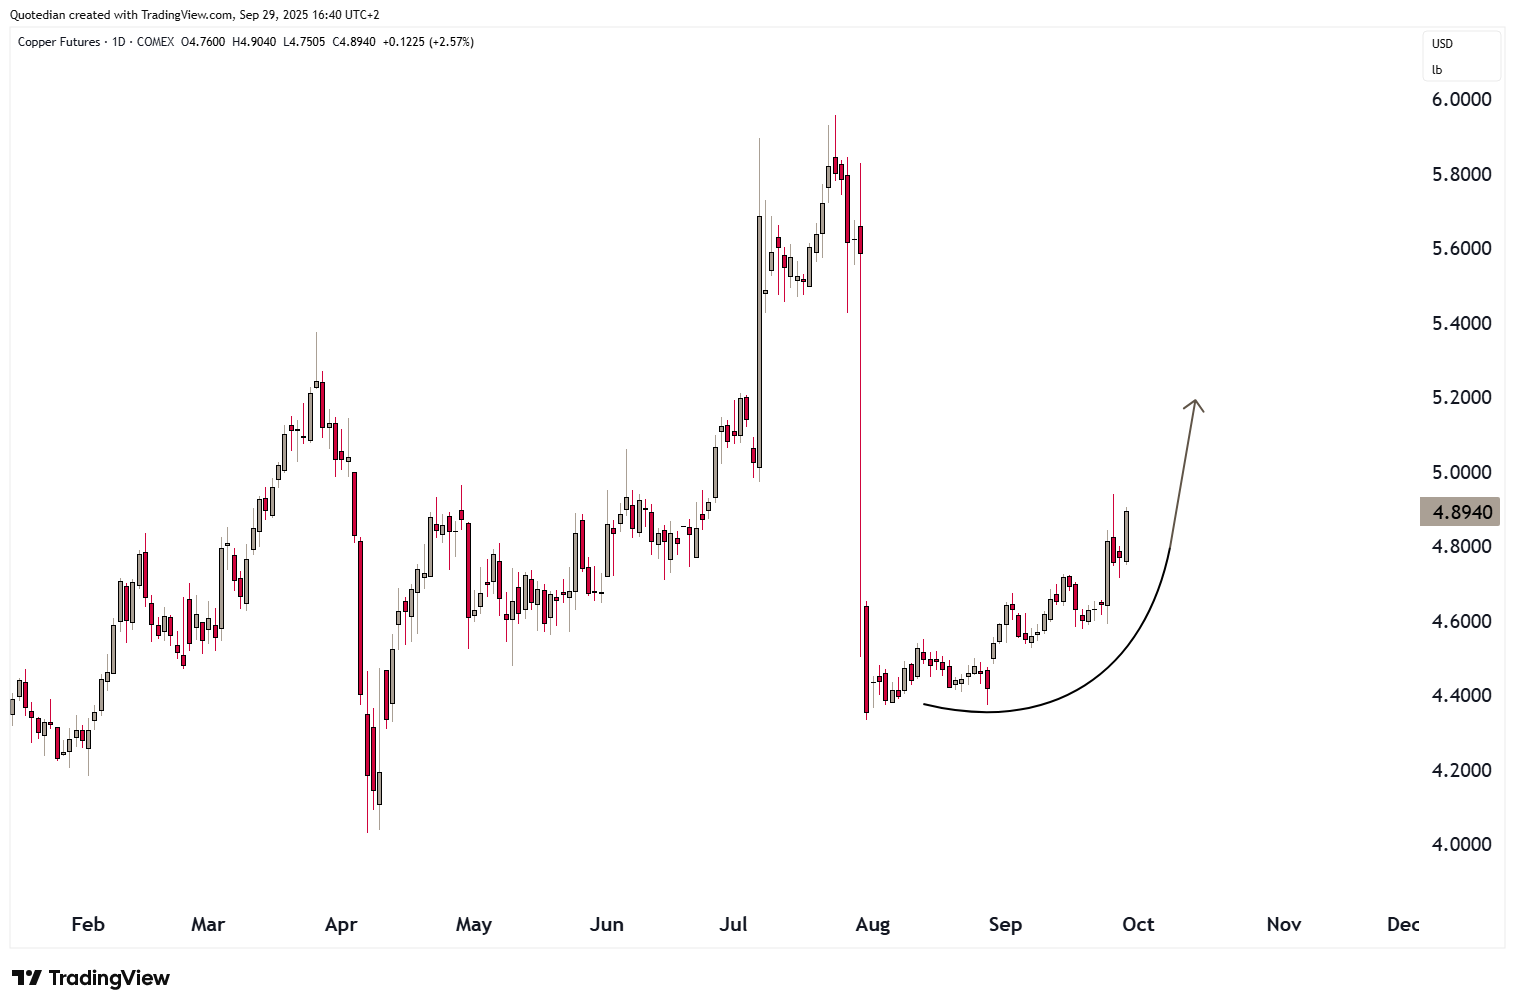
And finally, last week I also mentioned a possible upcoming rally in Copper, which indeed it seems we are getting. Here’s the chart of Copper futures:
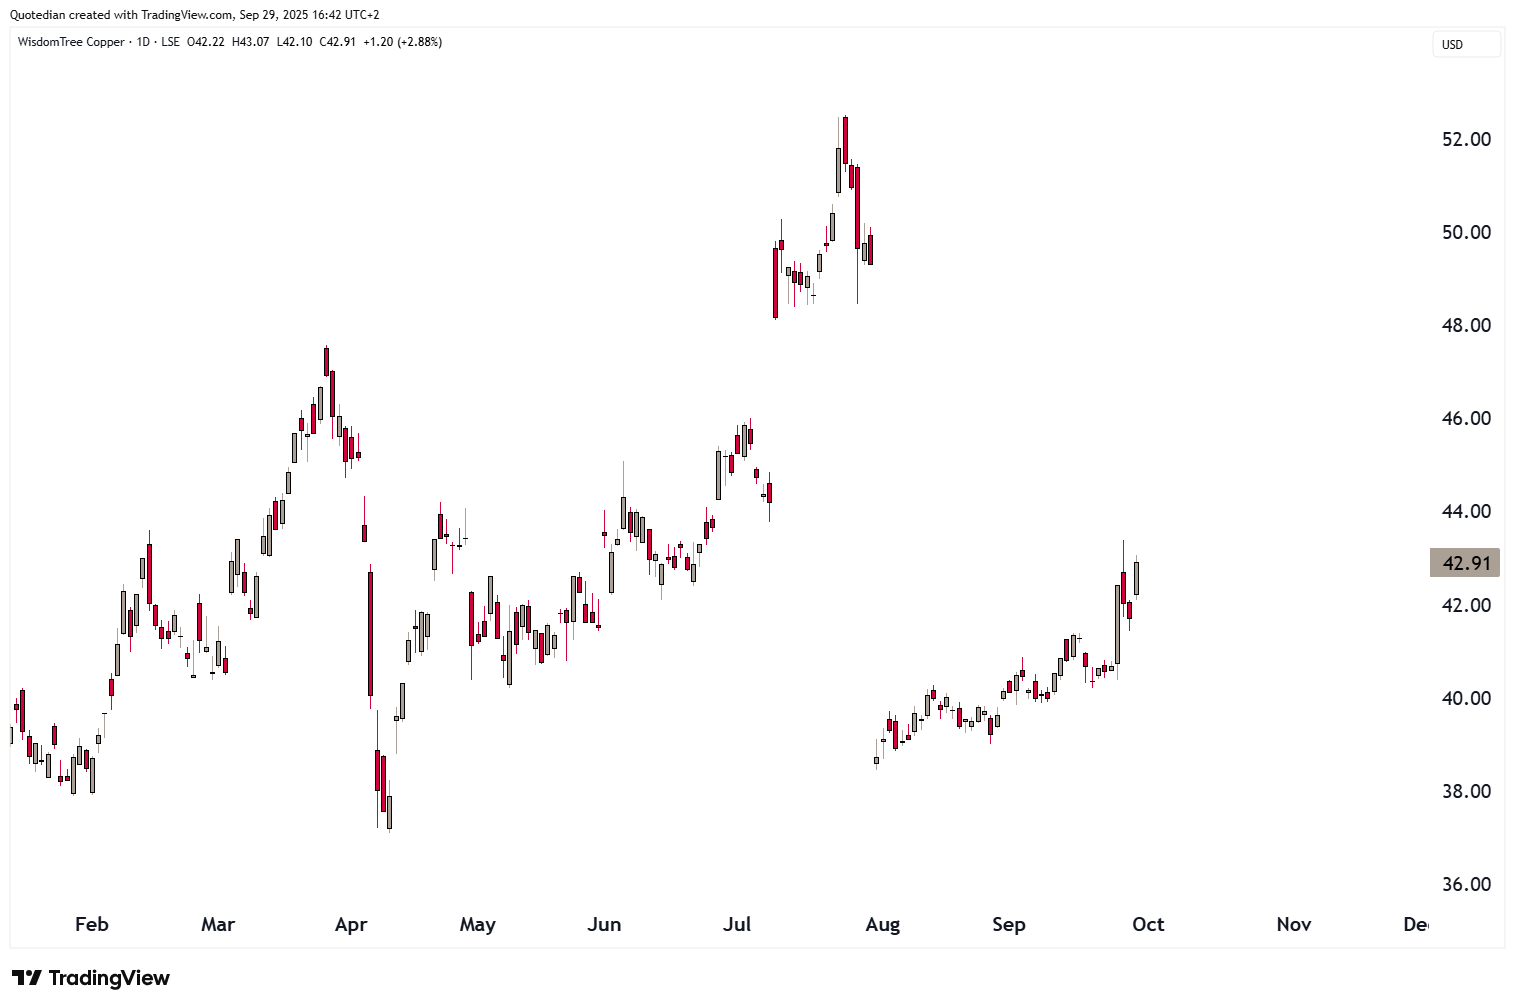
I am aware that not everybody can trade copper futures, however, the WisdomTree Copper ETF (COPA) let’s you participate in the underlying:
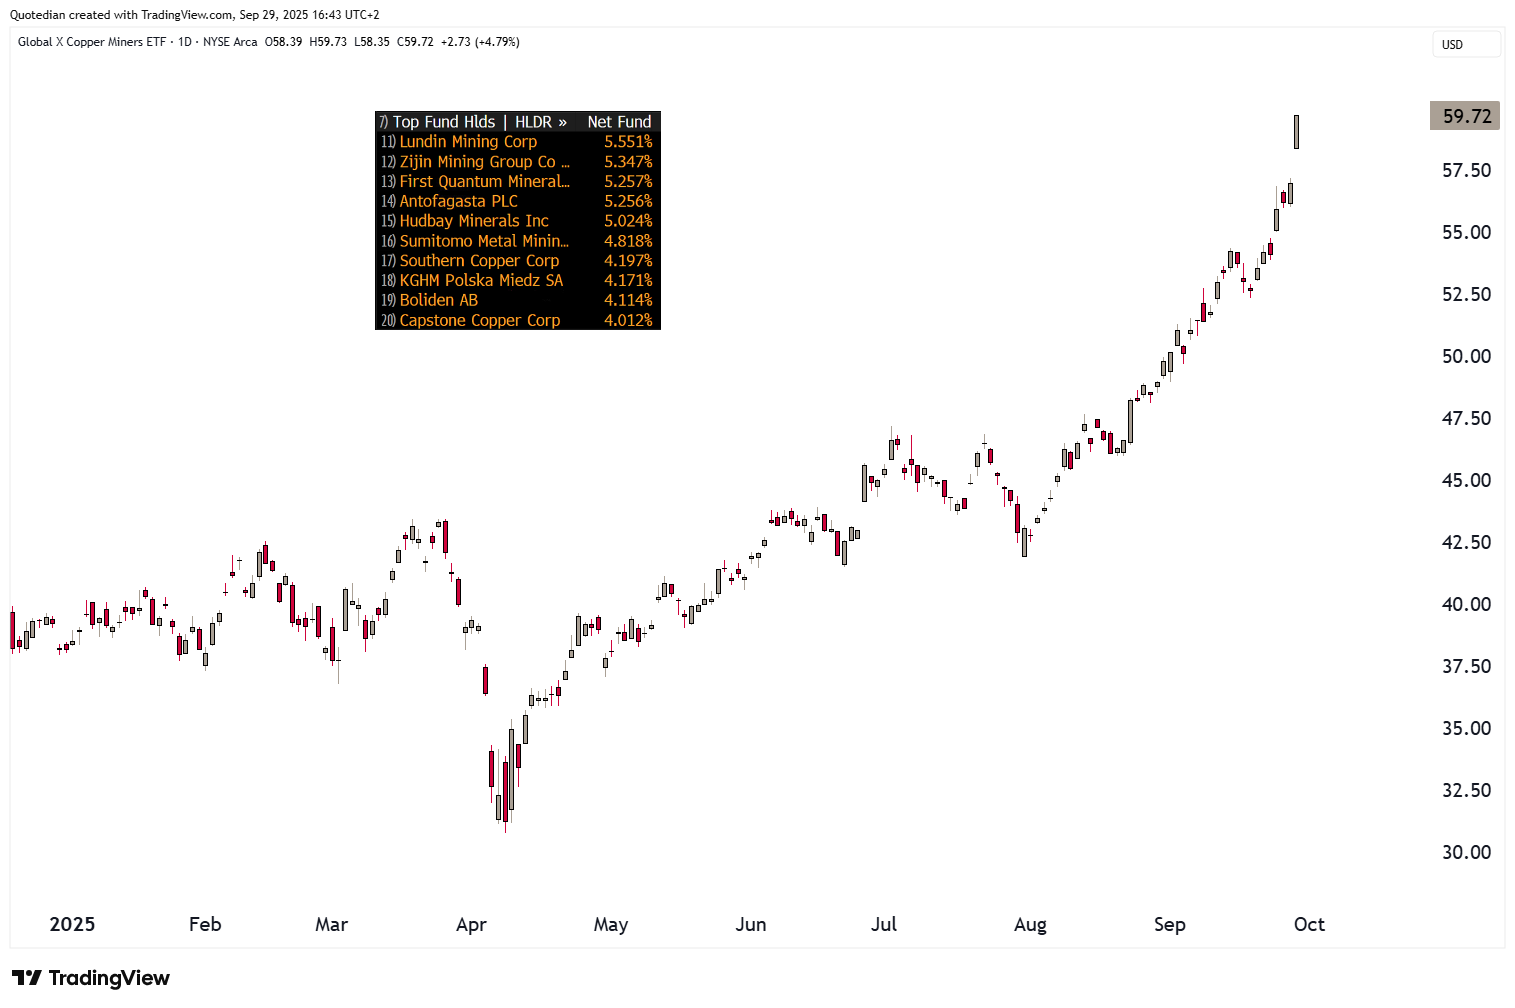
Or maybe even better, some ‘leveraged’ exposure via a Copper Mining Shares ETF, such as the Global X Copper Miners ETF (COPX):
Alright, that’s all for this week. Do not hesitate to drop me a comment in the comment section
but ABOVE all, hit that LIKE button!!


In reality, you need no other Disclaimer than the one above, but just in case:
Everything in this document is for educational purposes only (FEPO)
Nothing in this document should be considered investment advice
Investing real money can be costly; don’t do stupid shit
Leave politics at the door—markets don’t care.
Past performance is hopefully no indication of future performance
The views expressed in this document may differ from the views published by Neue Private Bank AG
I like how you balance optimism with caution, pointing out that higher yields remain the biggest wildcard.