

Operation Epic Folly?
Vol IX, Issue 13 | Simplicity is the Ultimate Sophistication
"I am in blood stepped in so far that, should I wade no more, returning were as tedious as go o'er."
— Shakespeare, Macbeth (Act III, Scene 4)

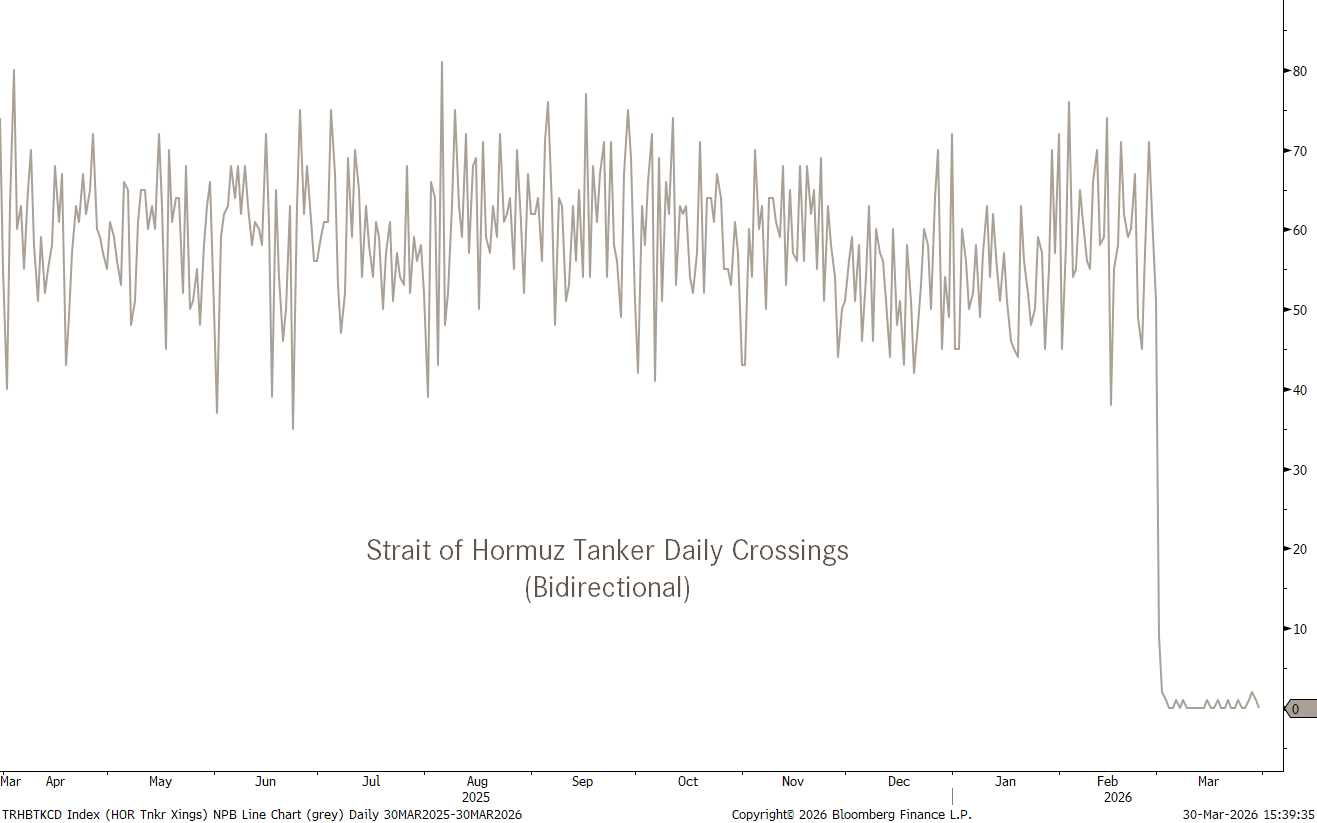
Supply chain stress, not only in oil, is increasing with every day the Strait of Hormuz continues closed.
Equity markets are finally waking up to this reality.
Whilst a short-term, negative sentiment counter rally could develop, the risks remain to the downside.
(US 10-year) Yields at close to 4.50% are stressing the market (and Trump and Bessent)
Despite having risen above 100 again on the DXY, the Dollar rally continues to feel too weak.
Oil remains a worry at above $110 and gold could see some further upside from here

So, let’s see how quickly I can shed readership from this week’s letter or from the Quotedian all together. After all, I have some things to write to upset just about anyone. 🤭
For example, look no further than today’s title: Operation Epic Folly?
If we take Trump’s approval rating (Real Clear Politics)
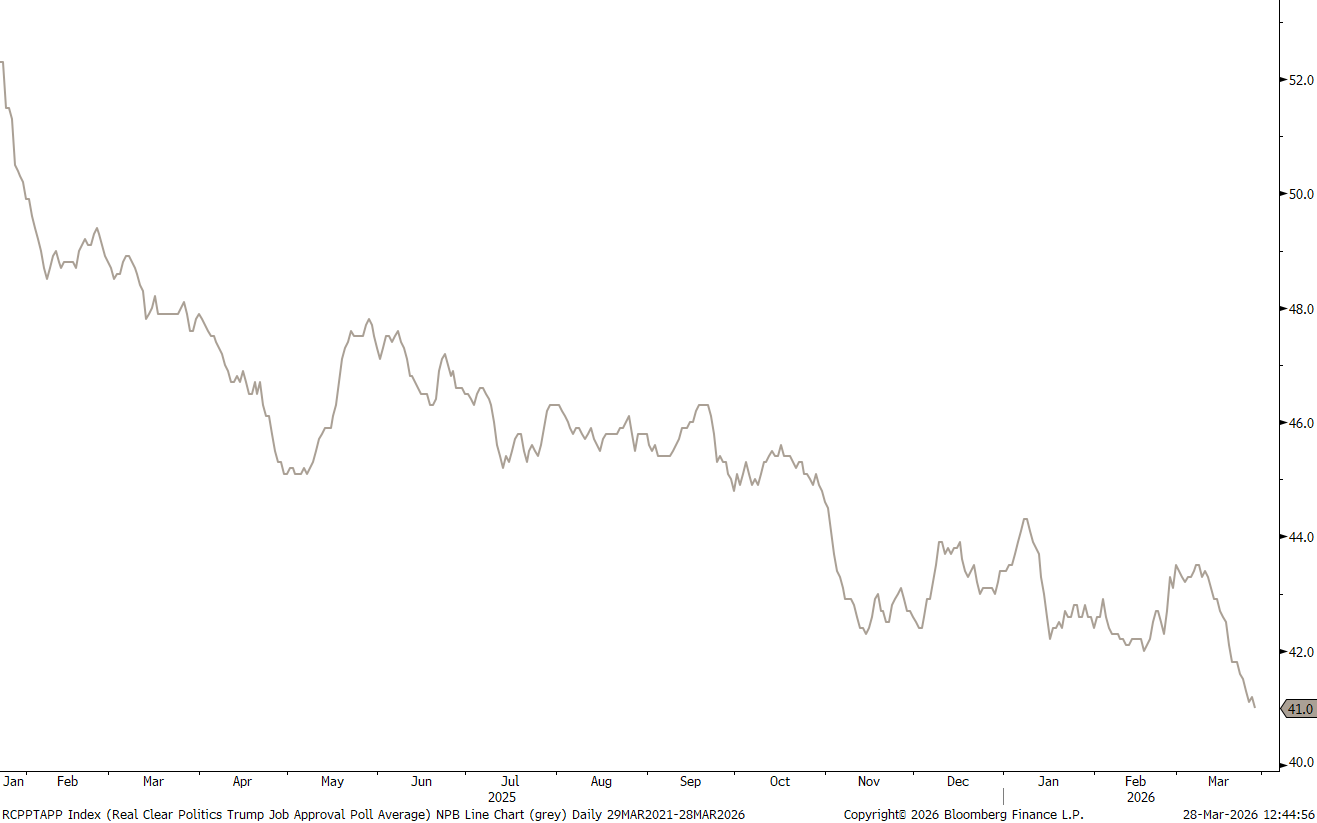
as a proxy, 41% of you are already insulted by the title of this week’s issue of world’s finest free macro markets newsletter. Putting the question market at the end saved me maybe from half of those forty percent hitting the delete button, so let’s say one fifth of the readership has left us already and we haven’t even got started yet…
Truth is that US President Donald J. Trump and his administration seemed to have painted themselves into a corner, out of which they are at increasing desperation trying to find that infamous “off-ramp”.
After Iran called his bluff on destroying the countries energy supply centres, he went for a TACO only a few hours later. That TACO was it seems however not enough as 10-year Treasury yields hit 4.50% on Thursday, so that TACO was converted into a NACHO, i.e. the initial “deadline” of five days was converted to endure until after Easter.
Glossary Time:
If TACO stands for “Trump Always Chickens Out”, what does NACHO stand for then?
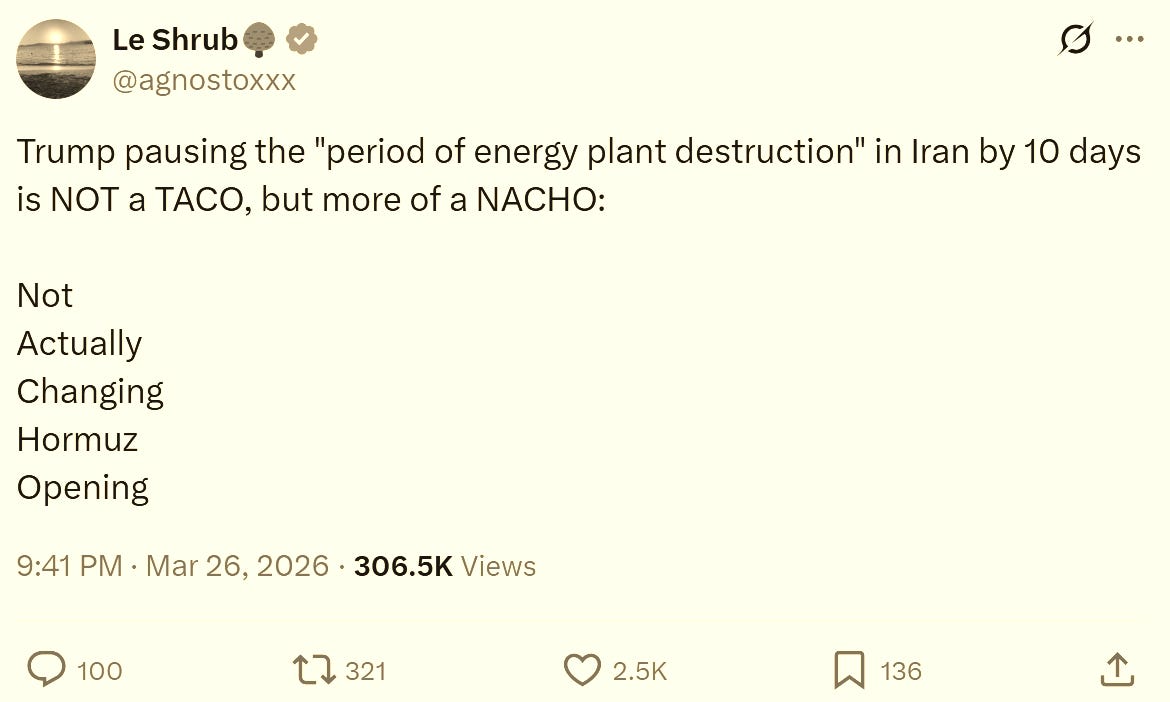
There you go.
The world is getting nervous as voices are getting louder that another two to three weeks supply constraints will push us in a COVID-lockdown scenario, but not out of political dumbness (well, in a way, yes), but rather just due to these constraints.
And it is not just about fuel for our flights to our favourite holiday destinations this summer. The implications are WAY, WAY wider.
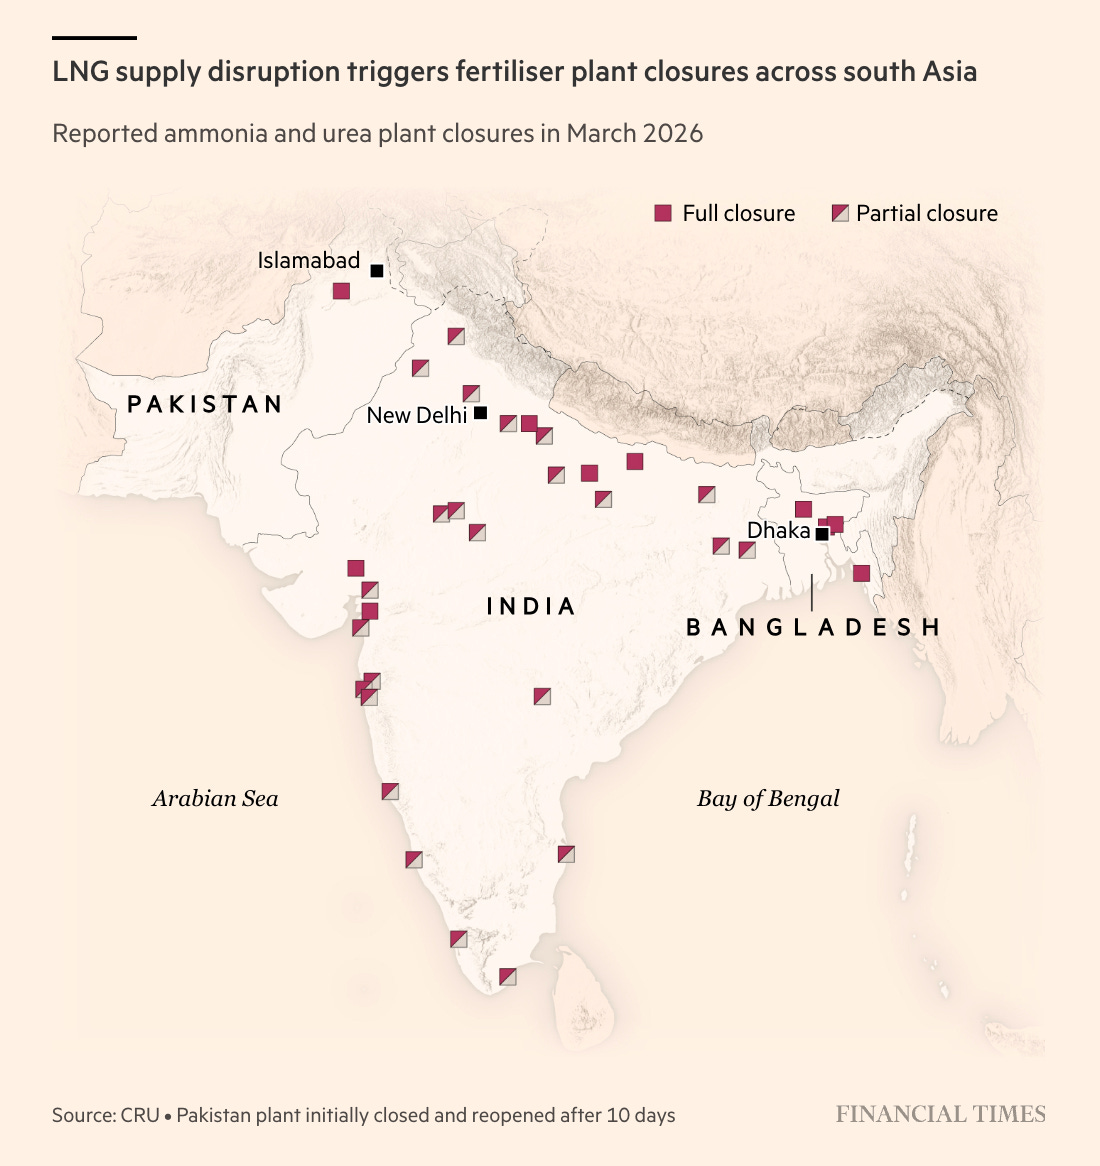
As we discussed at some length in last week’s edition title “PerFert Storm” (click here), fertilizers are natural gas energy-intense as they are exposed to the Haber-Bosch process (click here and click here), and supply constraints/higher prices are already having dire consequences. Take the India/Pakistan/Bangladesh fertilizer business for example:
Further signs of supply chain distress: A third of global Helium production, a key “ingredient” in semiconductor assembly, is was taking place in Qatar. Unfortunately, Helium spot prices are not publicly available, but let’s use the share price of Pulsar Helium (CN:PLSR) as a proxy:
BTW, did you notice that “Price leads narrative“? 😉(click here)
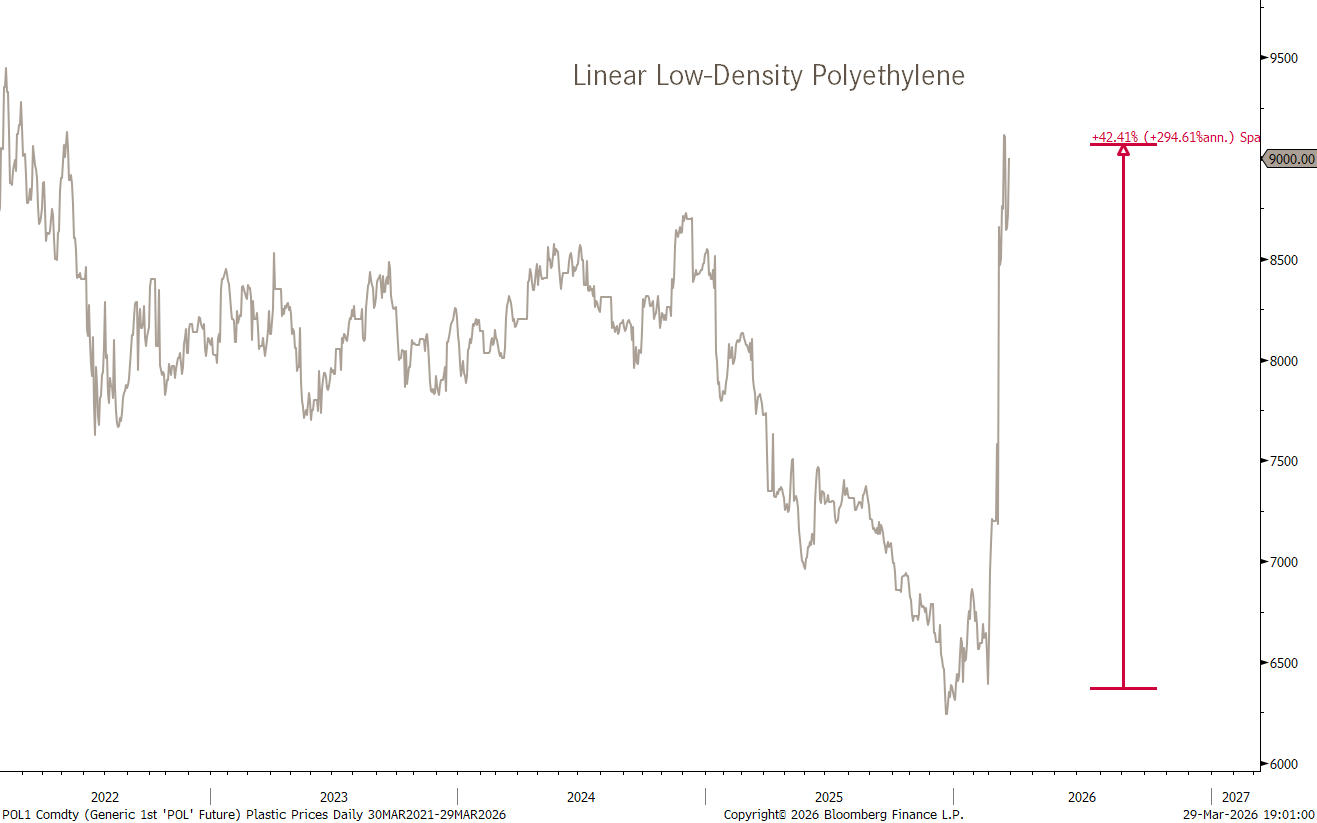
More distress signals? Plastic prices:
With all of this, it is probably no surprise that equity markets finally started puking on Friday. Here’s the S&P 500, which has ‘finally’ fallen out of its range box:
As I advised in Friday’s QuicQ (click here): “Nothing ever good happens below the 200-day moving average”. Actually, not my words, but rather Paul Tudor Jones’ …
Or, as they say, if you panic, panic early! Is it too late to panic? I simply do not know. But I truthfully think that between global conflicts, private credit, high equity concentration (US) and a equity BTFD culture there is potential for some more pain. Add the wealth effect to that, and …
Regarding high equity concentration, the chart below illustrates what happens to passive investors into market cap weight indices (red line), when its main components (Mag 7 - dark grey line), start falling:
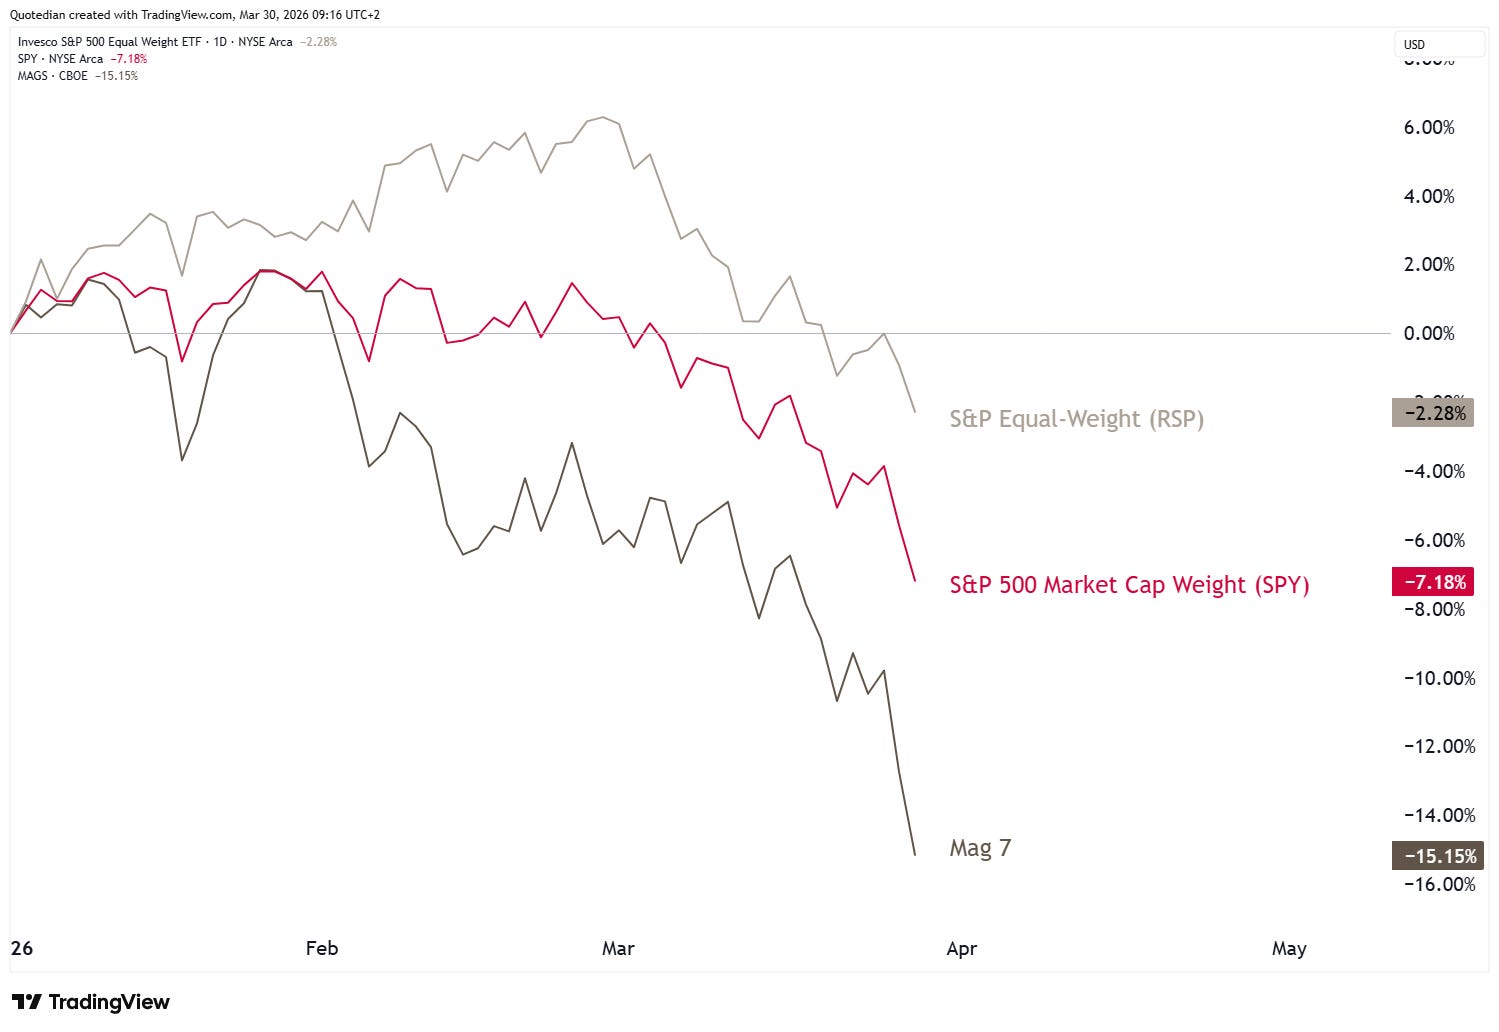
Luckily, we positioned our discretionary-managed client portfolios into the light grey line back in February.
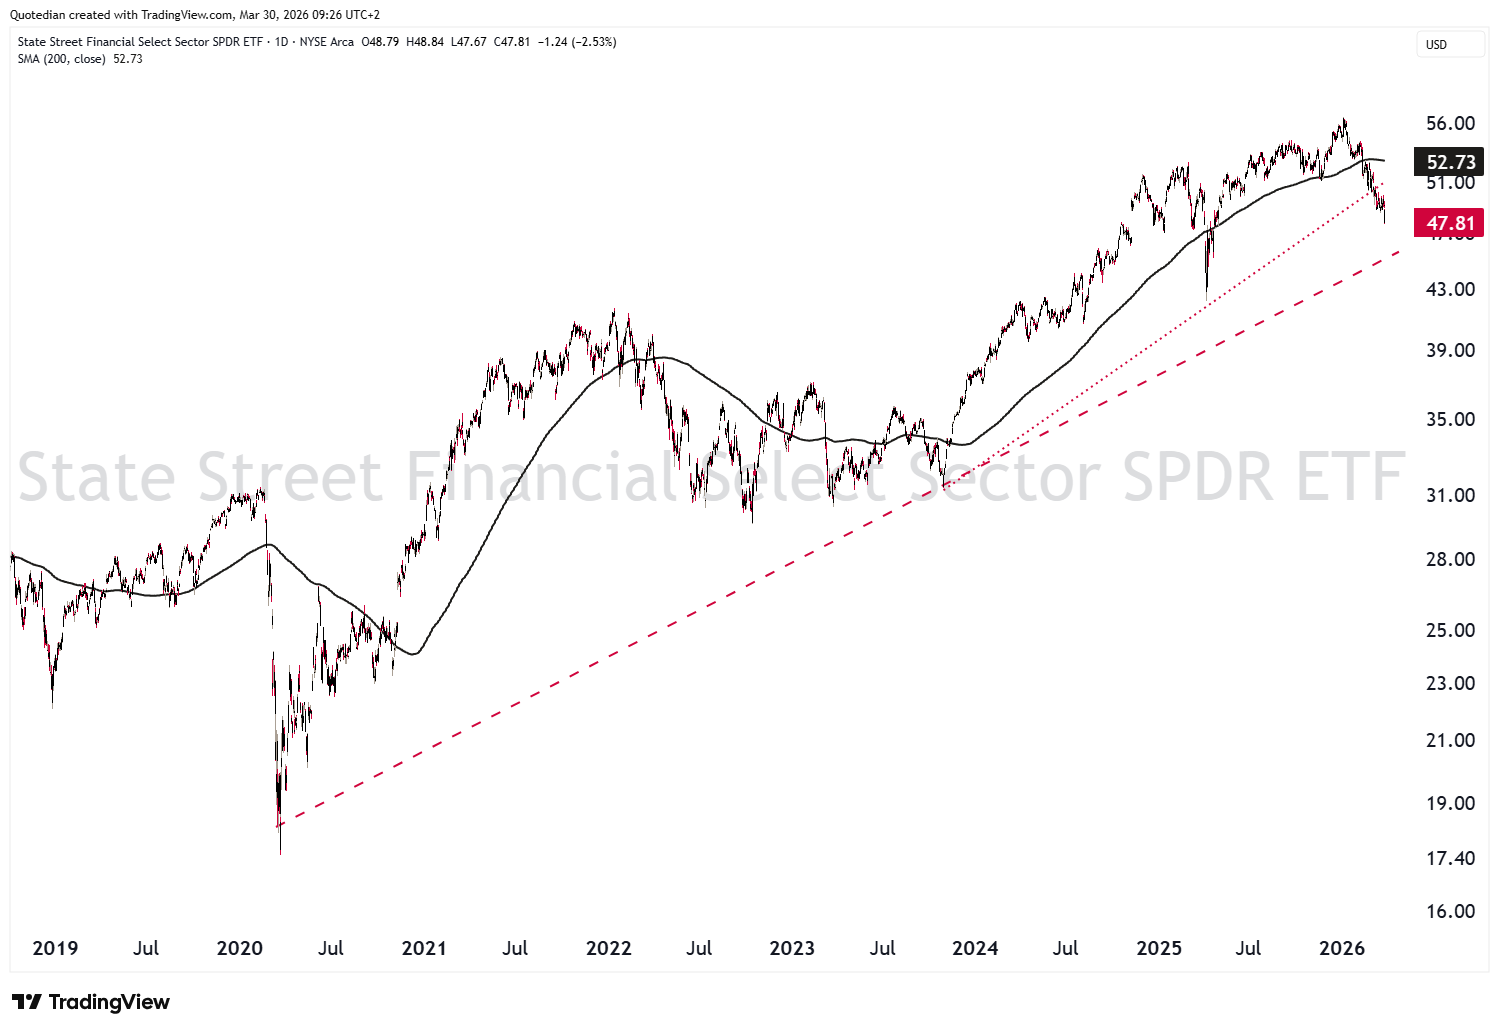
Private credit
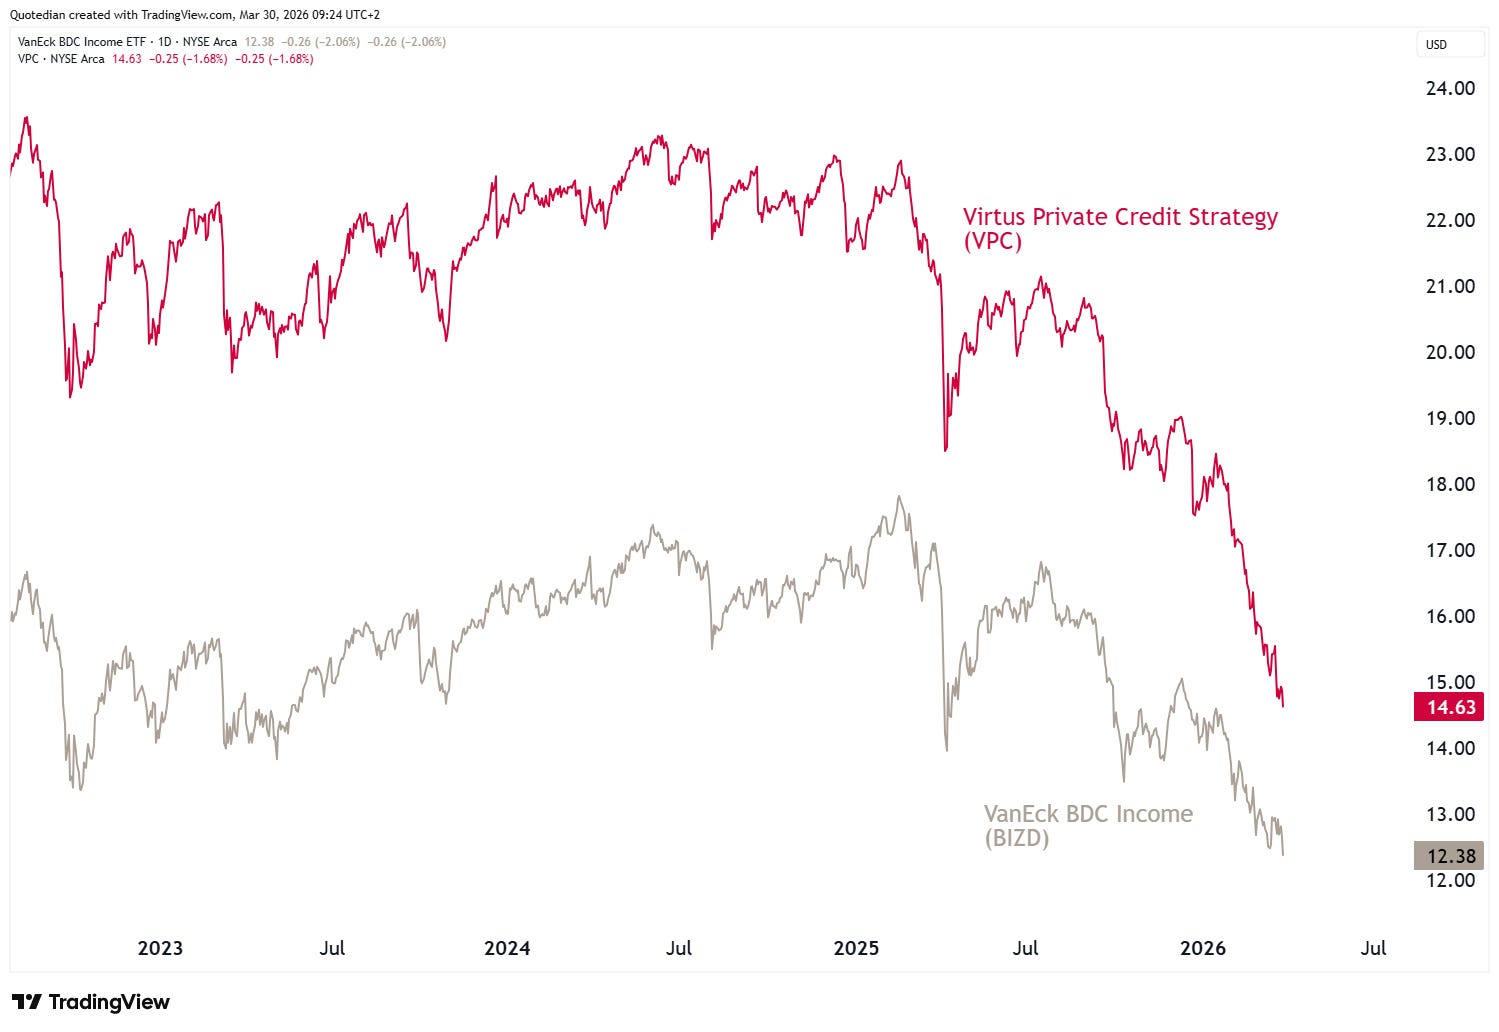
continues to be a thorn in the side of financials, which are trading below their 200-day moving average (XLF) and quickly approaching their secular uptrend support line (red, dashed):
The Dow Jones Industrial index has fallen “officially” into correction territory, with a drop of >10%:
Surprisingly, small cap stock (Russell 2000) are still above their 200-day MA:
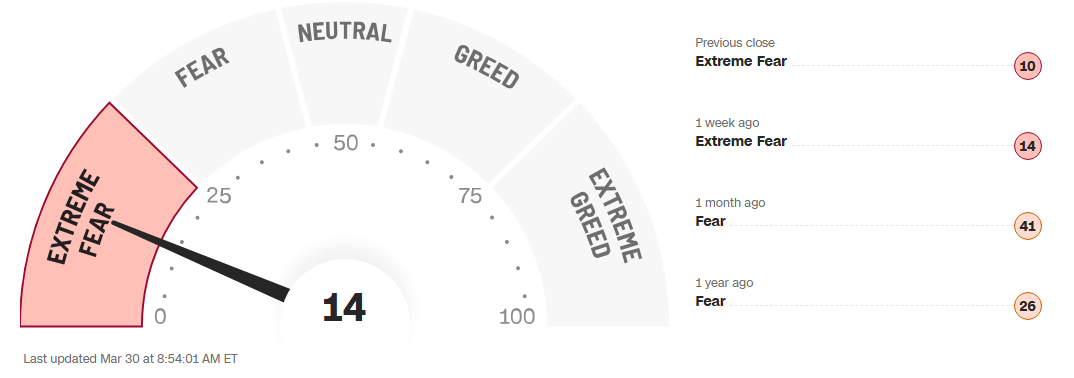
So, overall the move lower does not seem to have finished yet, though we may be in for a bounce early this week, as sentiment is negative enough for such a move, as witnessed via the CNN Fear and Greed Indicator:
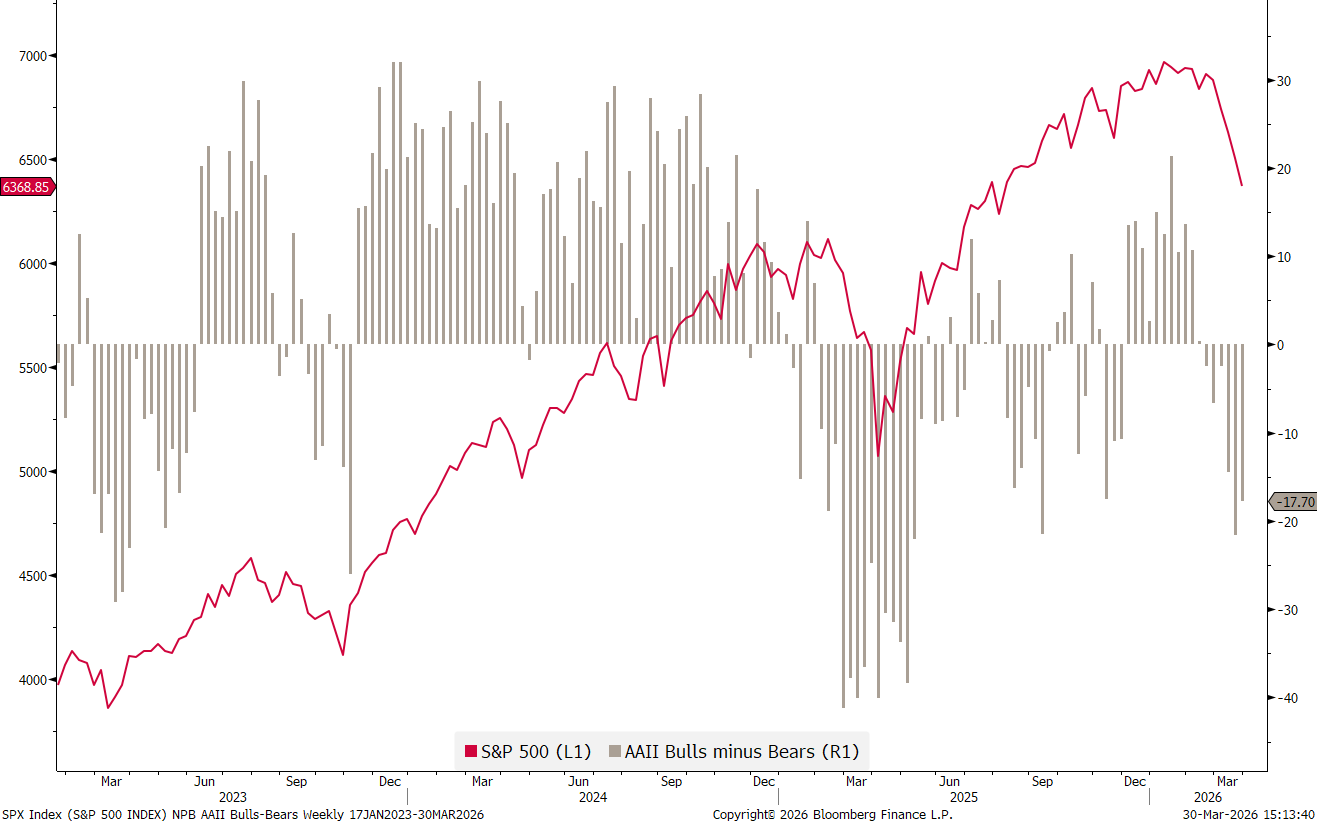
Even though the retail cohort, measured via the AAII bull & bear survey, is not as negative yet as it was at the “Obliteration Day” bottom a year ago:
And then there is this dude, which is usually wrong when he has public appearances and is currently trying to bottom fish:
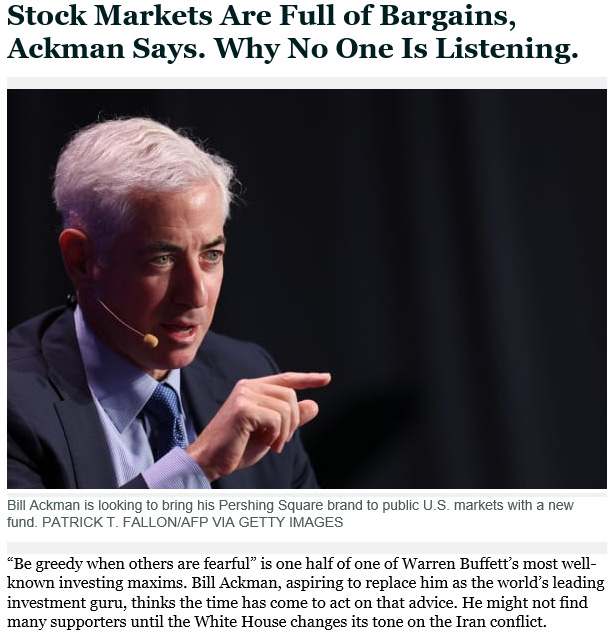
A living contrarian indicator.
Now, to get rid of the next 20% of our readership, let’s turn to Europe, where the EU leadership is fully exercising one of its key competences. Exactly, DOING NOTHING. Neither joining the US in its fight for _______ (fill in your own reasoning), nor condemning it.
With energy (gas) prices through the roof,
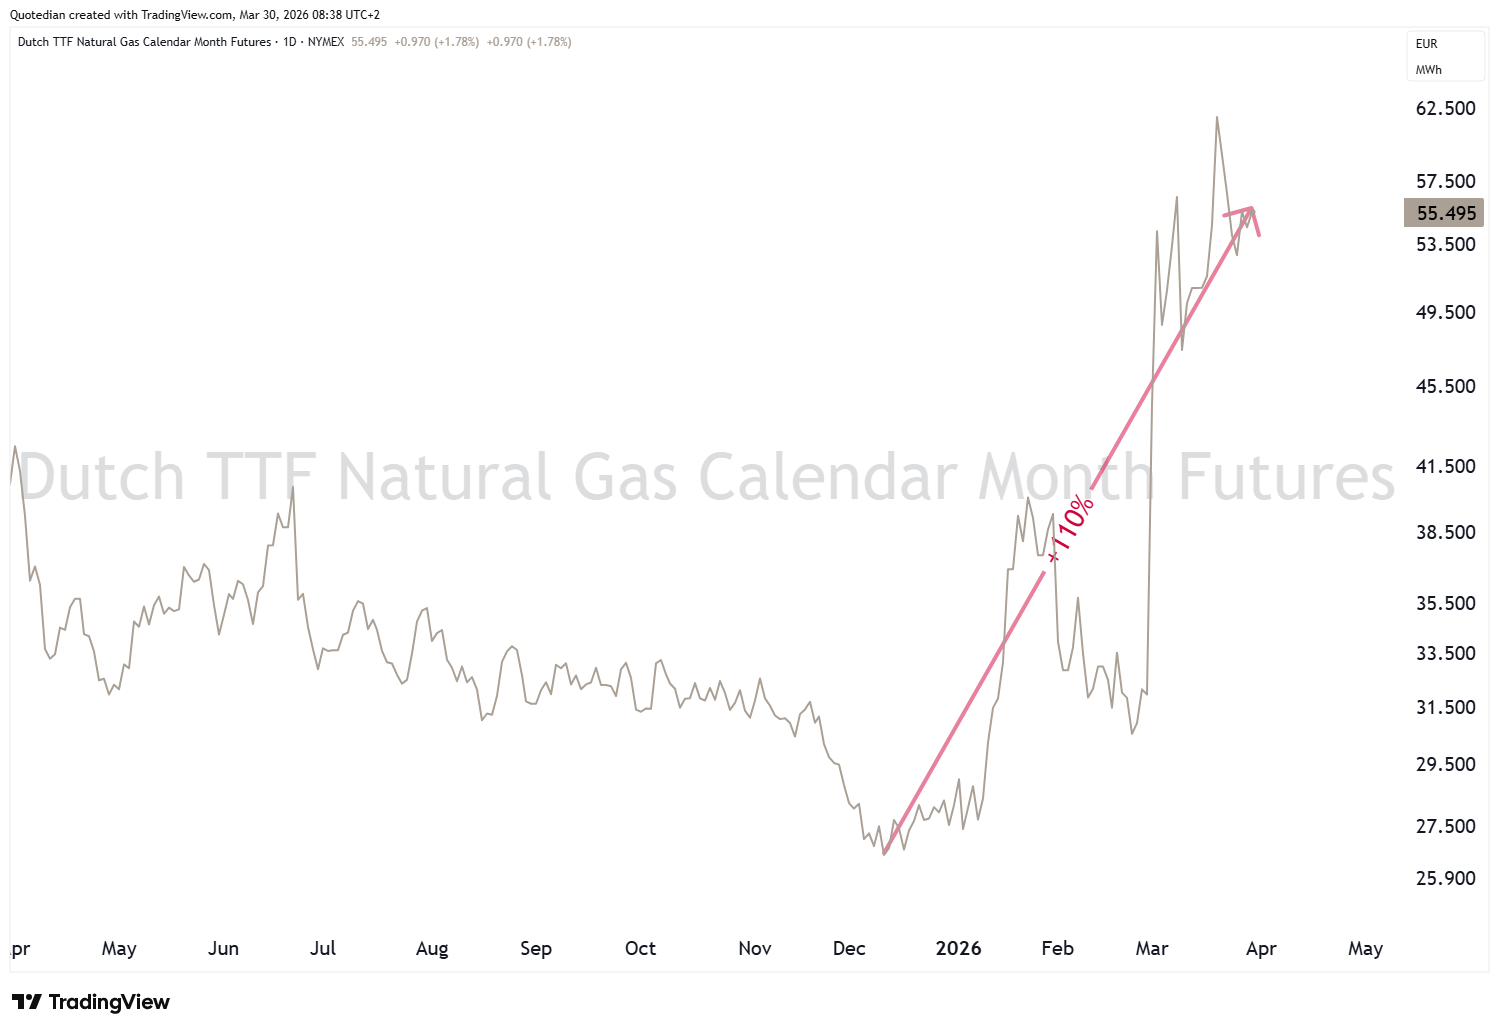
should not more gas from Russia be flowing into the Union? (Blasphemy, I know). Or should Germany not be relaunching its Nuclear energy program? (Blasphemy, again, I know).
Meanwhile, European stock markets are suffering, not least the German one:

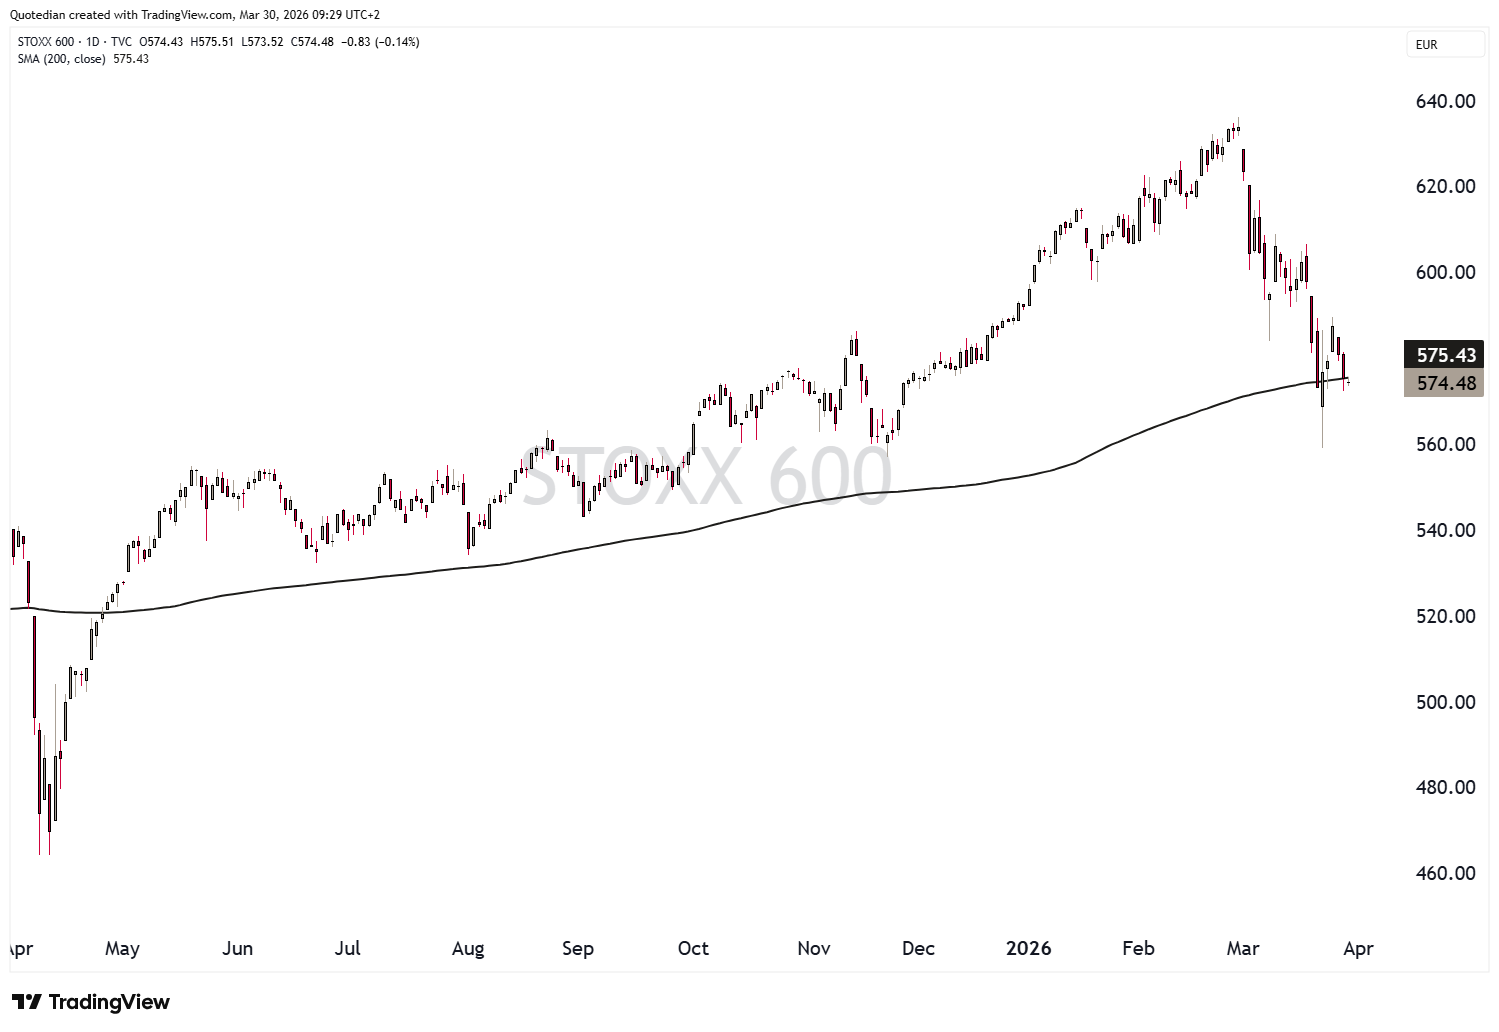
The broader STOXX 600 Europe index (SXXP) is flirting with a break below its 200-day moving average:
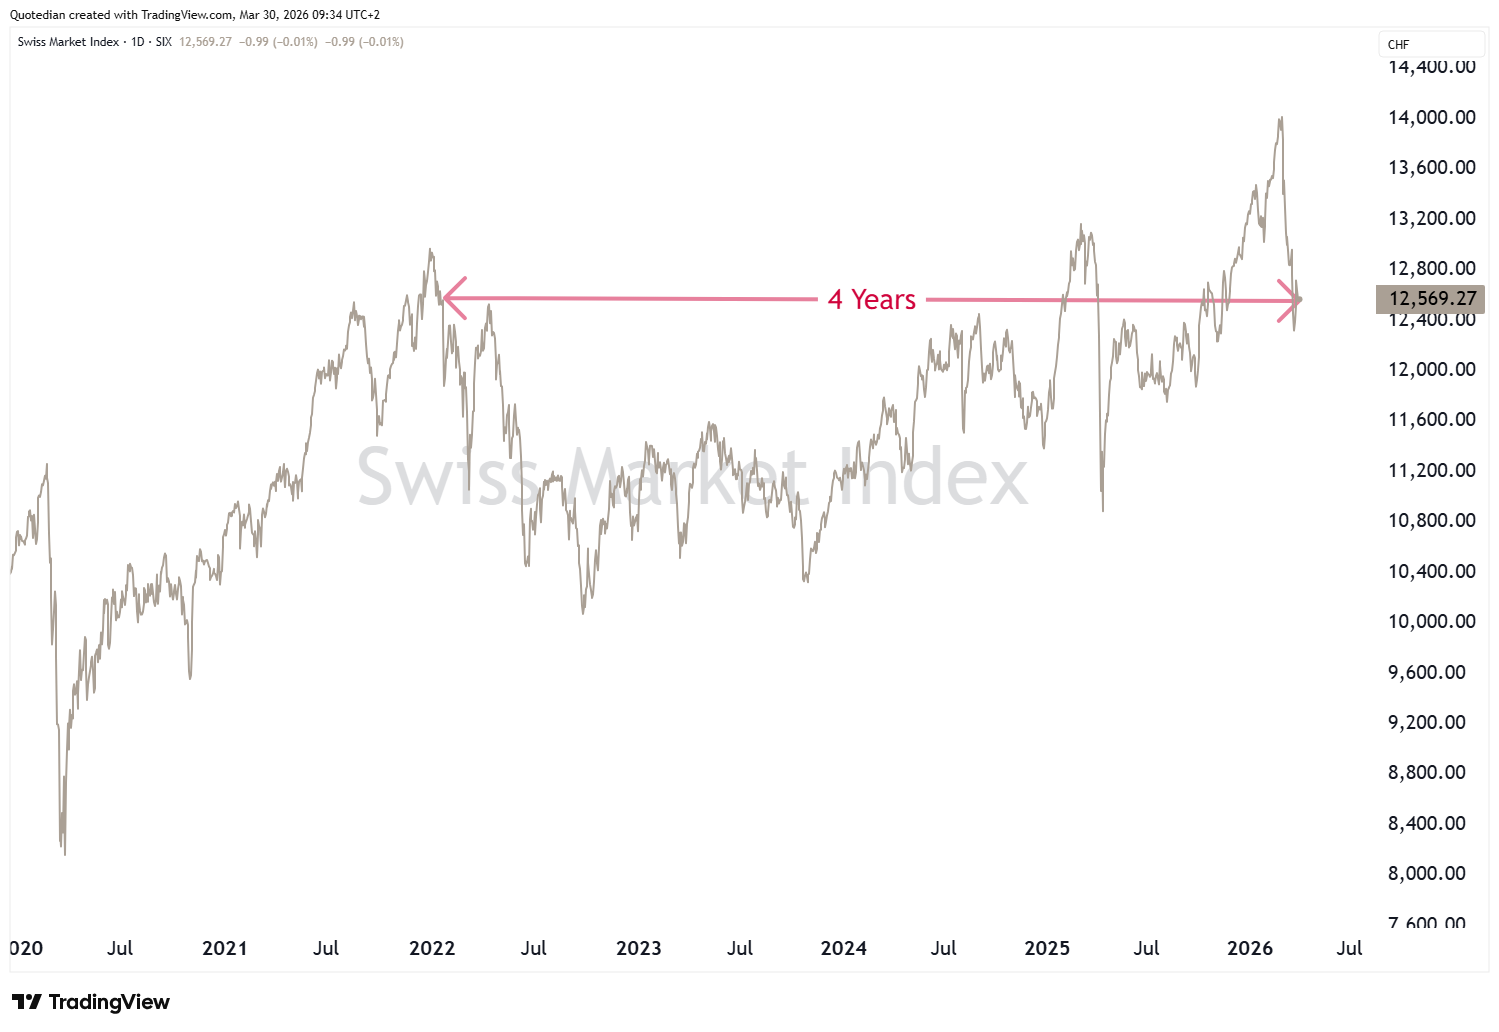
Switzerland’s SMI has provided four years of nothingness:
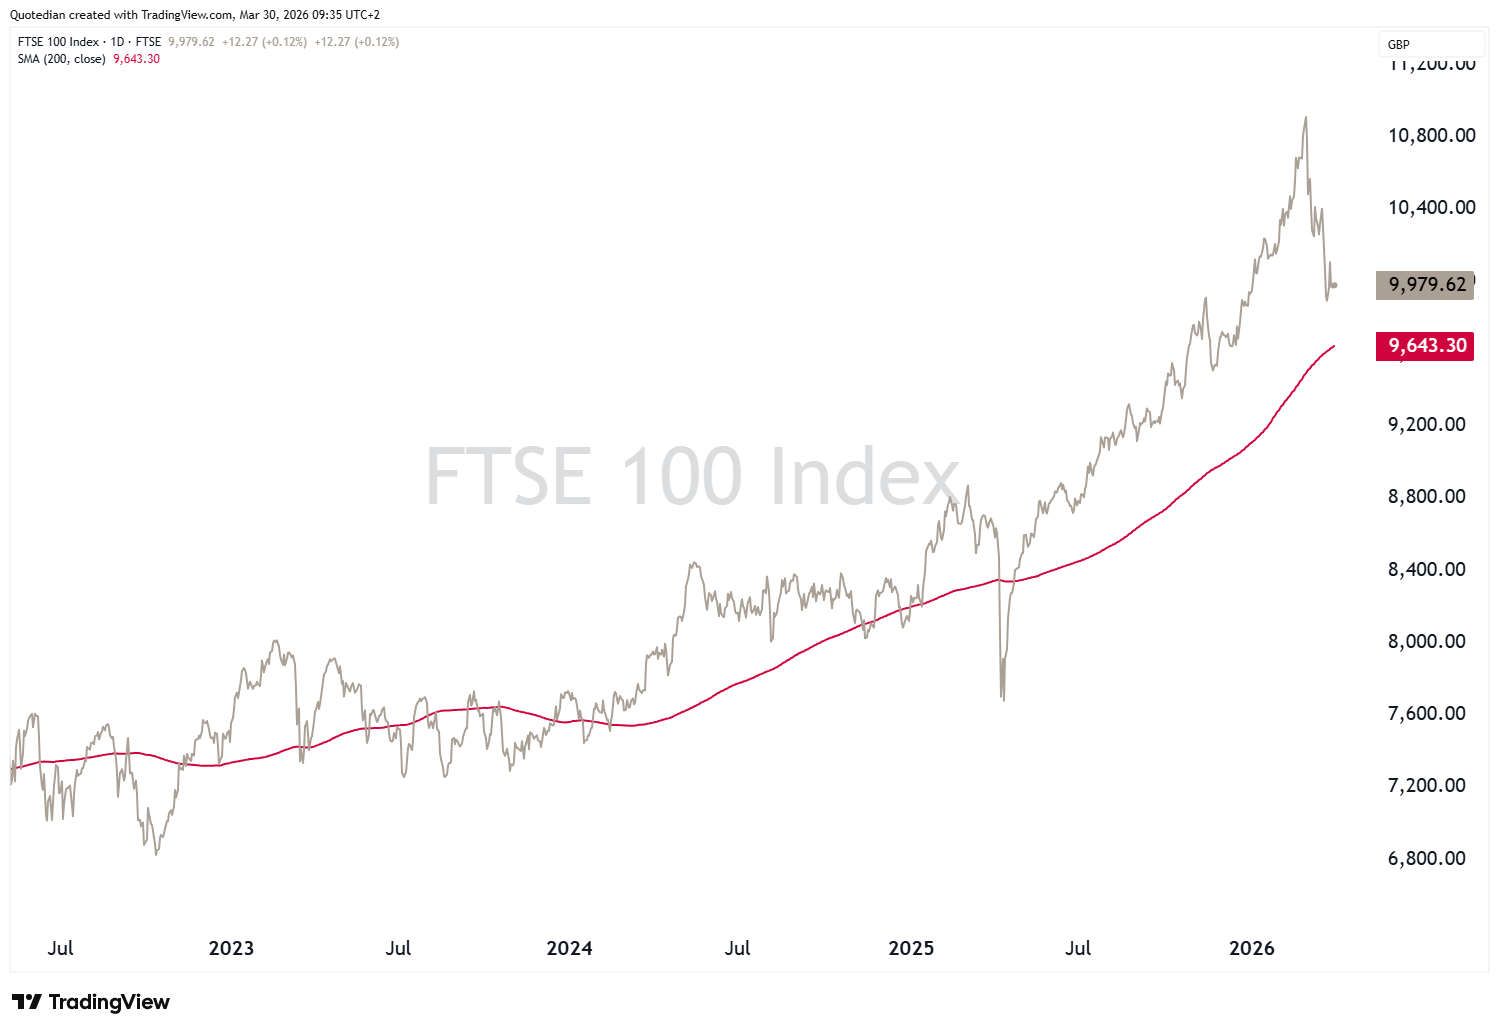
UK’s FTSE-100 (aka Footsie) is still trading above its 200-day MA, but has dropped the 10k milestone again:
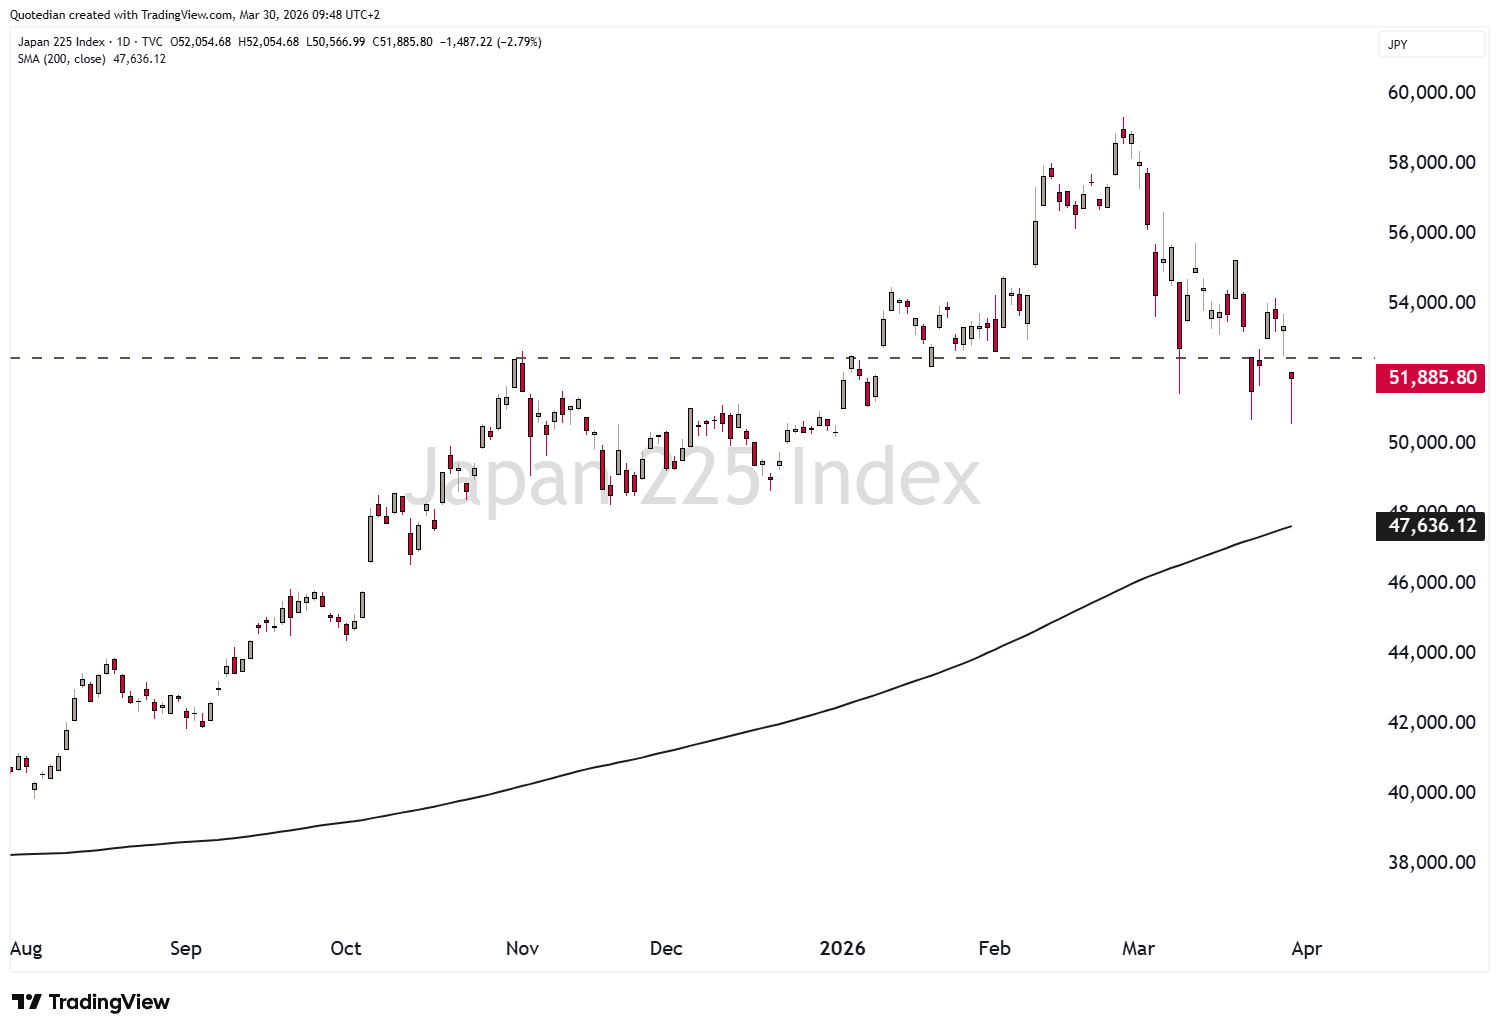
Turning to Asian equity markets, we need to keep in mind that most countries on that continent are pretty much energy-price sensitive. Take Japan for example, which sees the Nikkei 225 index still trading way above its 200-day MA, but mainly thanks to a strong rally at the beginning of the year. Peak to current trough, the index has given back more than 12%.
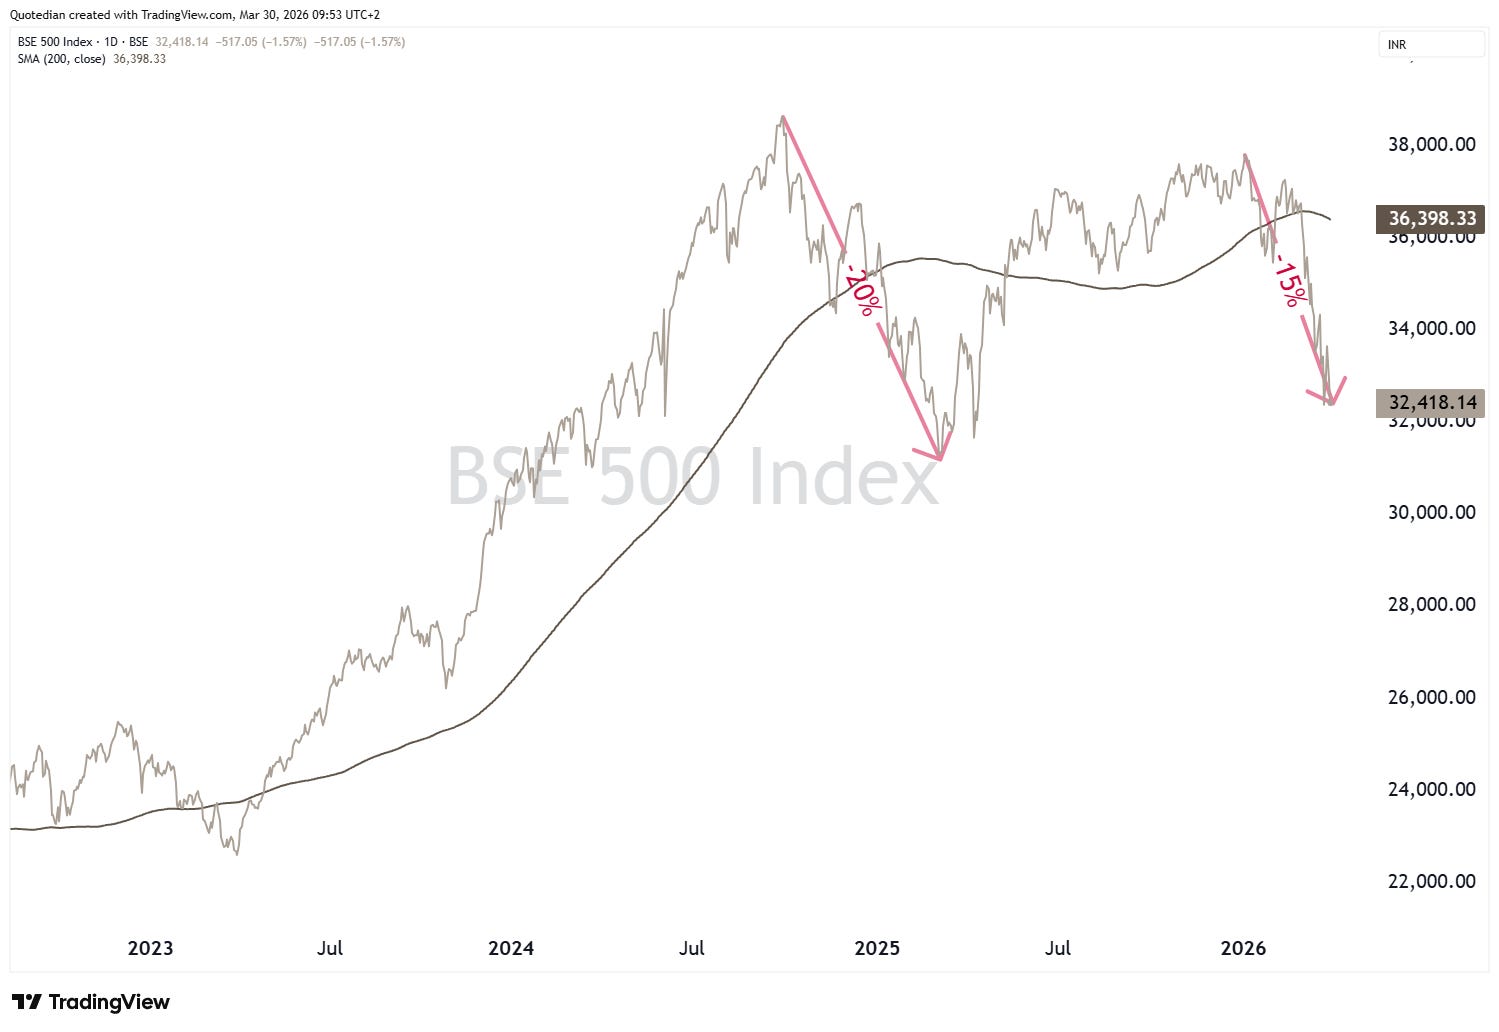
But one of the worst performing markets continues to be India, which has now been in a bear market for one-and-a-half years:
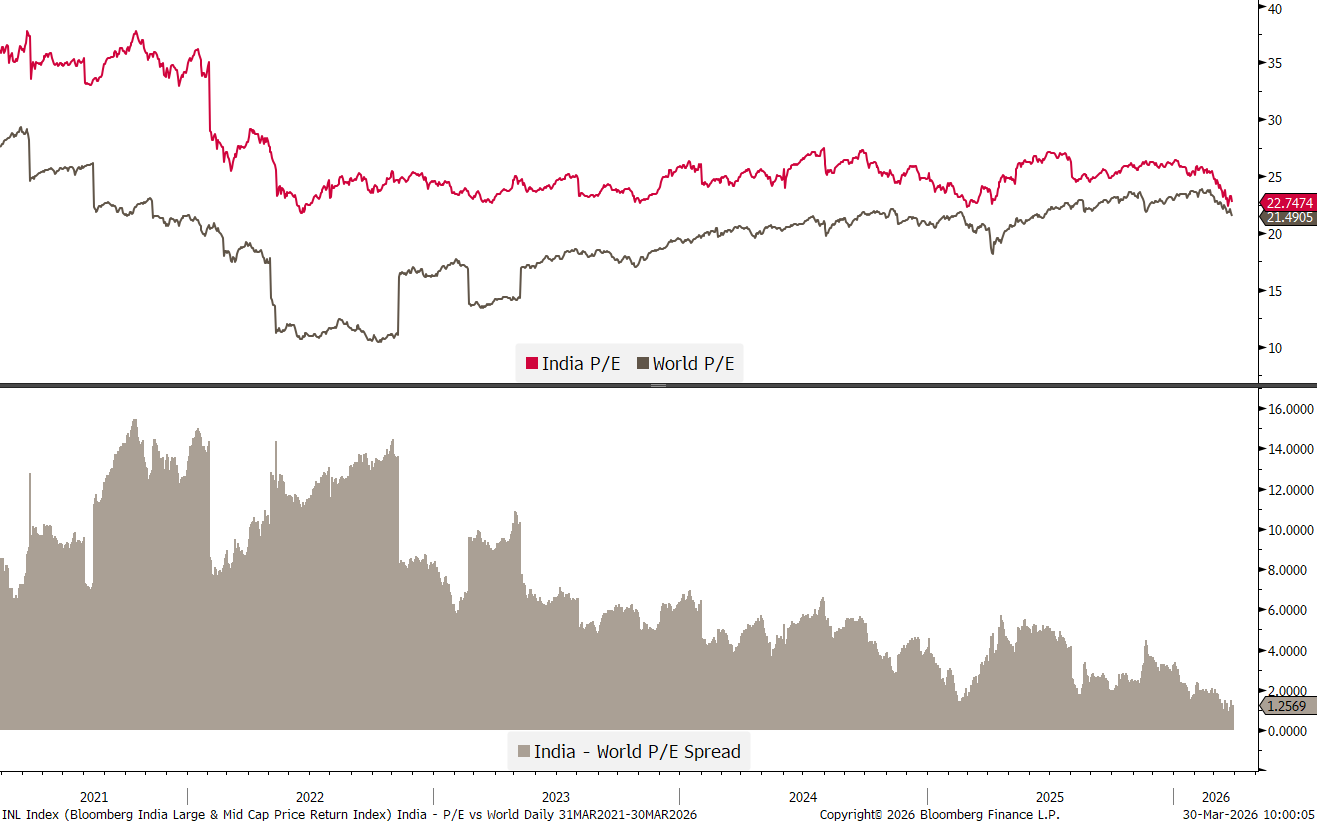
The valuation premia of the Indian stock market is now nearly gone:
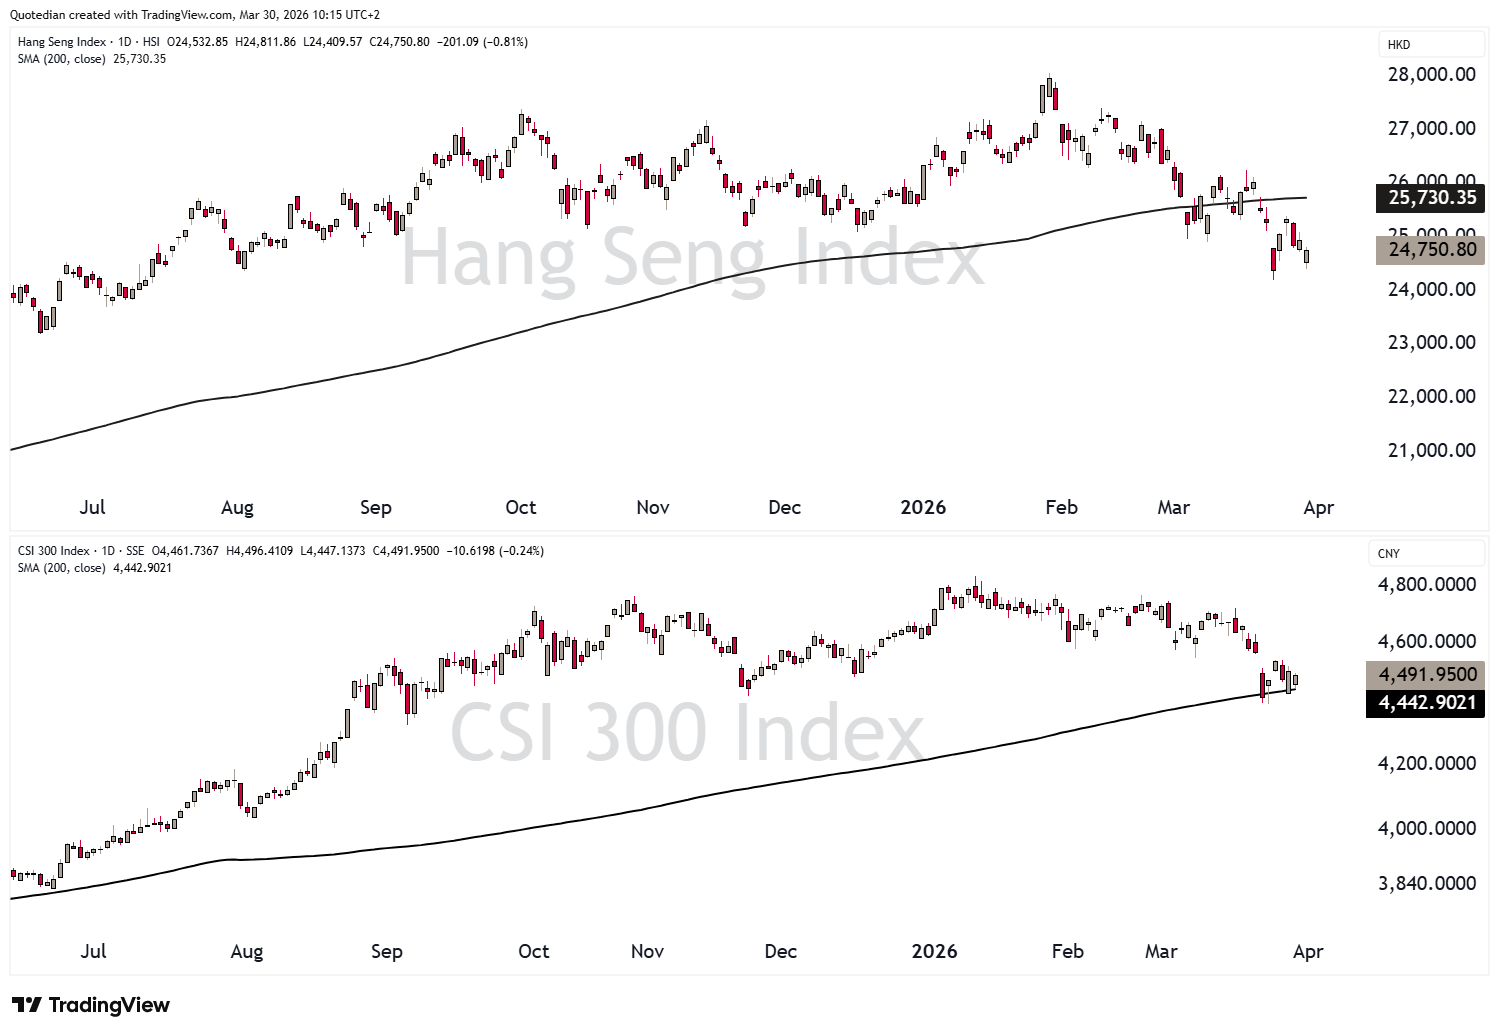
The Chinese equity complex is seeing a bit of mixed fortunes, with Hong Kong’s Hang Seng Index (top clip) down 12% from its peak and trading below its 200-day moving average, whilst the CSI 300 (bottom clip), a measure for mainland stocks performances, is down only about half that and still above the 200-day MA:
Time to head over to bond markets now, where the US 10-year Treasury yield nearly reached 4.50% on Thursday,
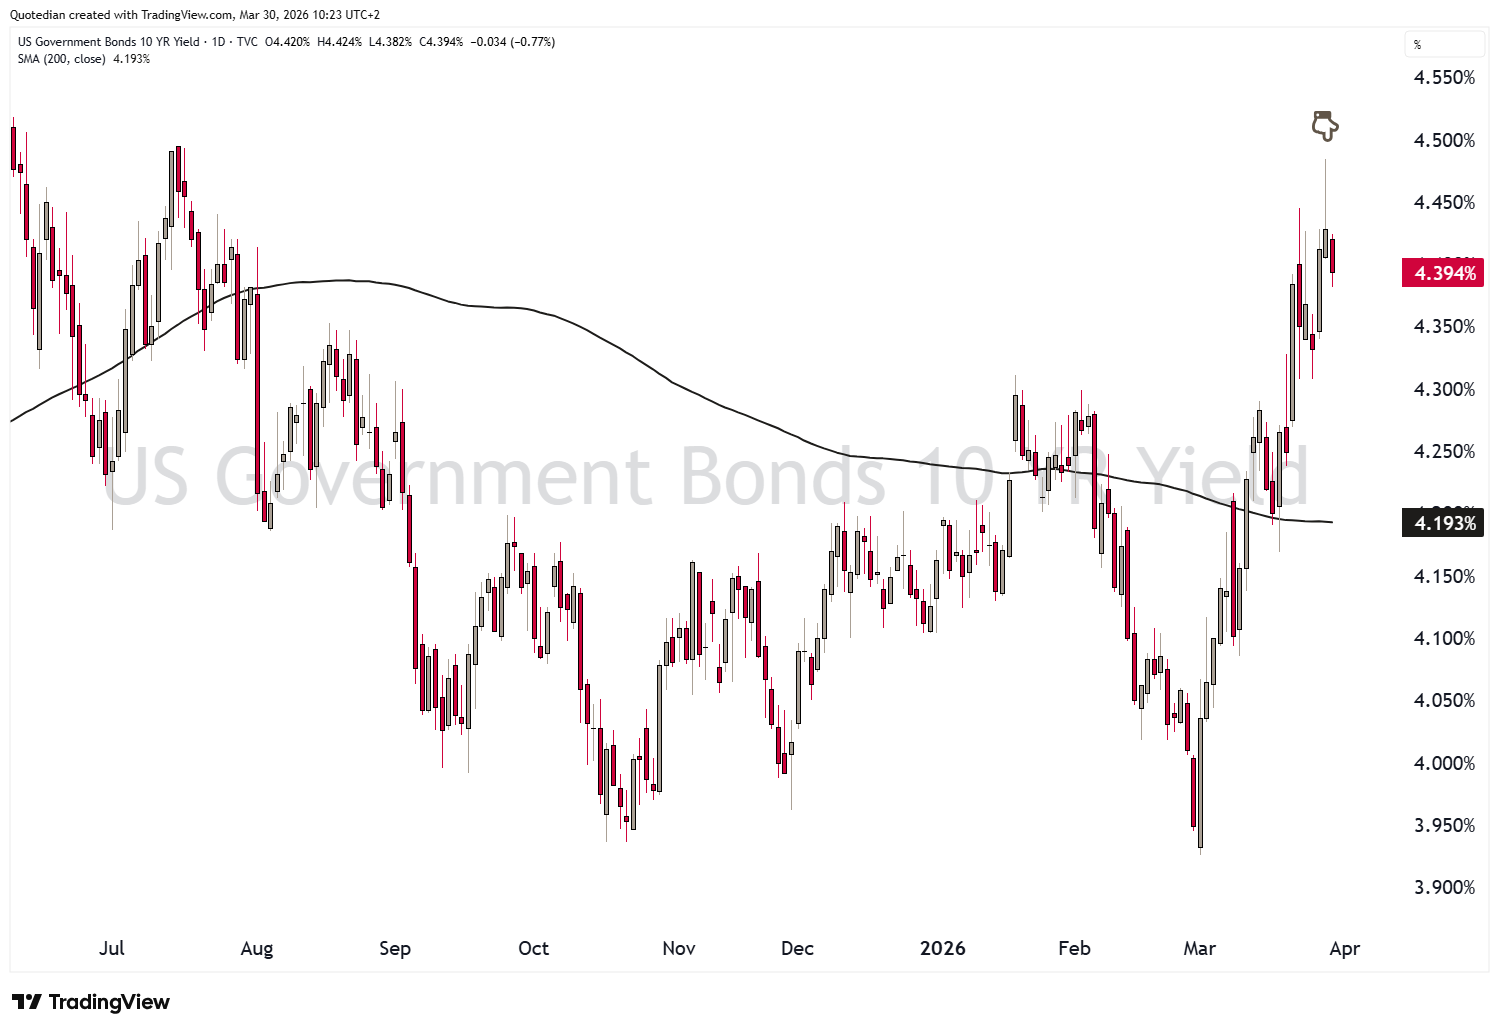
probably leading to Trump converting that previous weekend TACO into a NACHO.
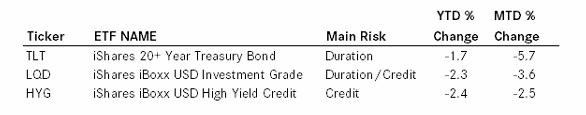
For bonds, it is turning out to be a difficult year, both from a duration point of view as increasingly also from the credit risk side. The table below shows some popular ETFs and their performance since the beginning of the year and especially since the beginning of March, which is of course exactly since the Iran conflict ensued:
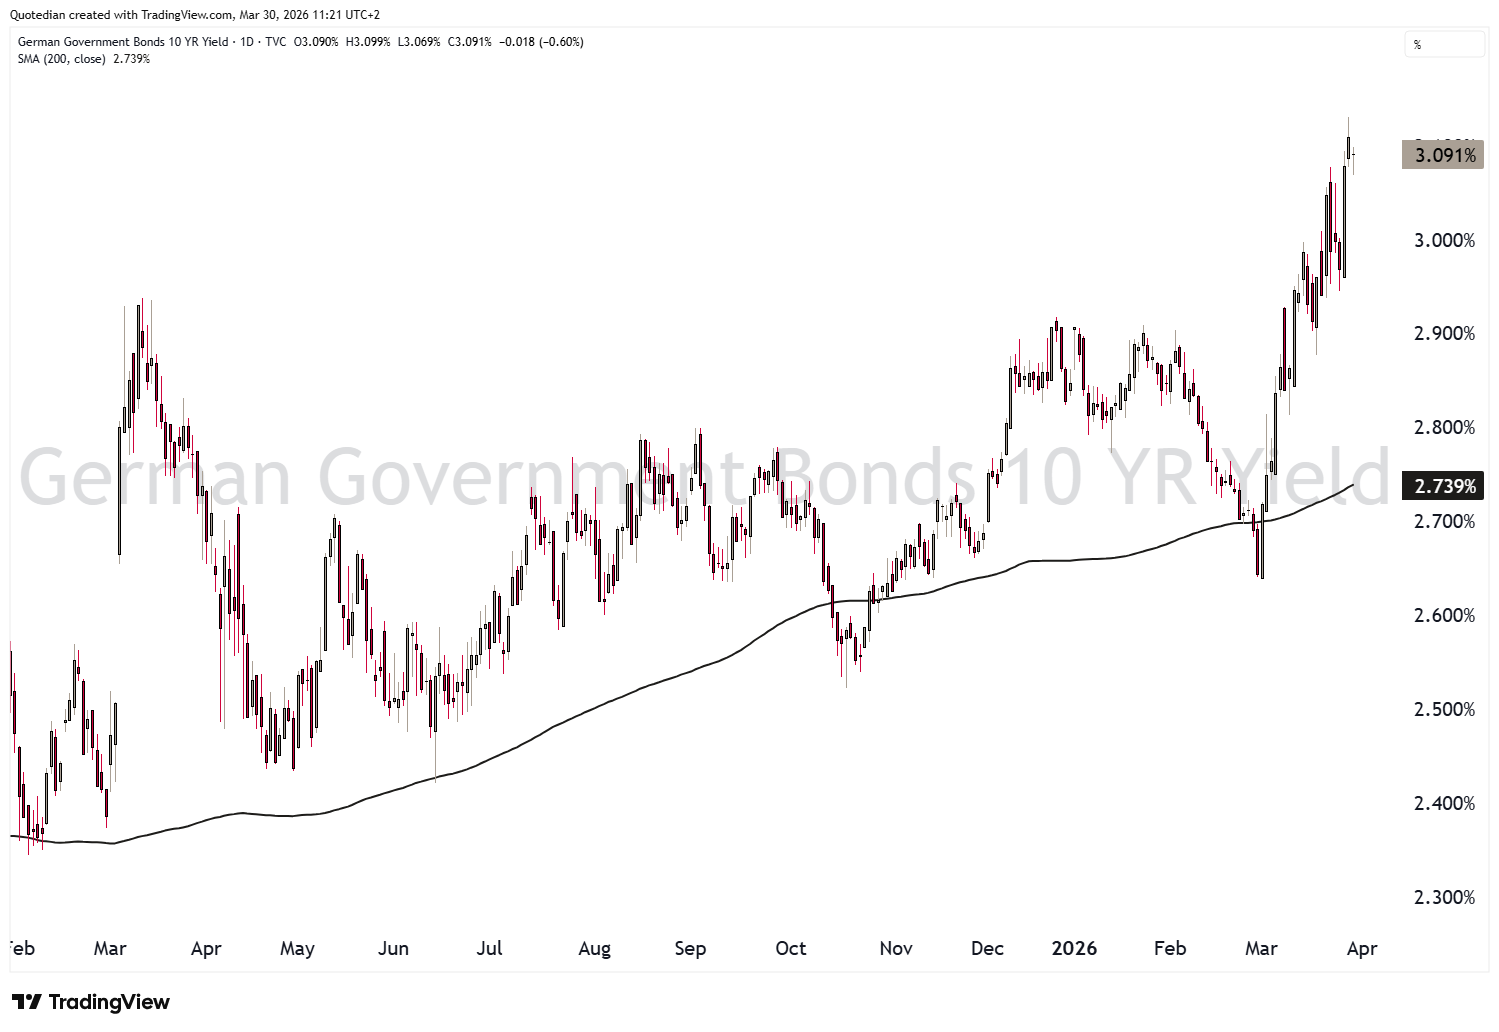
European rate traders are still assuming that the oil shock is inflationary, rather than recession-inducing, as German yields (as proxy for the EU region) continue to climb:
And stunningly enough, the ECB seems to agree with them, as the tone has shifted noticeably more hawkish and futures prices now imply more than a hike by June and up to three hikes by the end of the year:
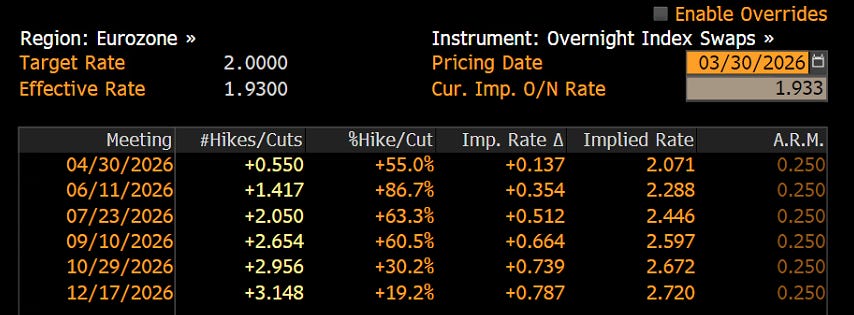
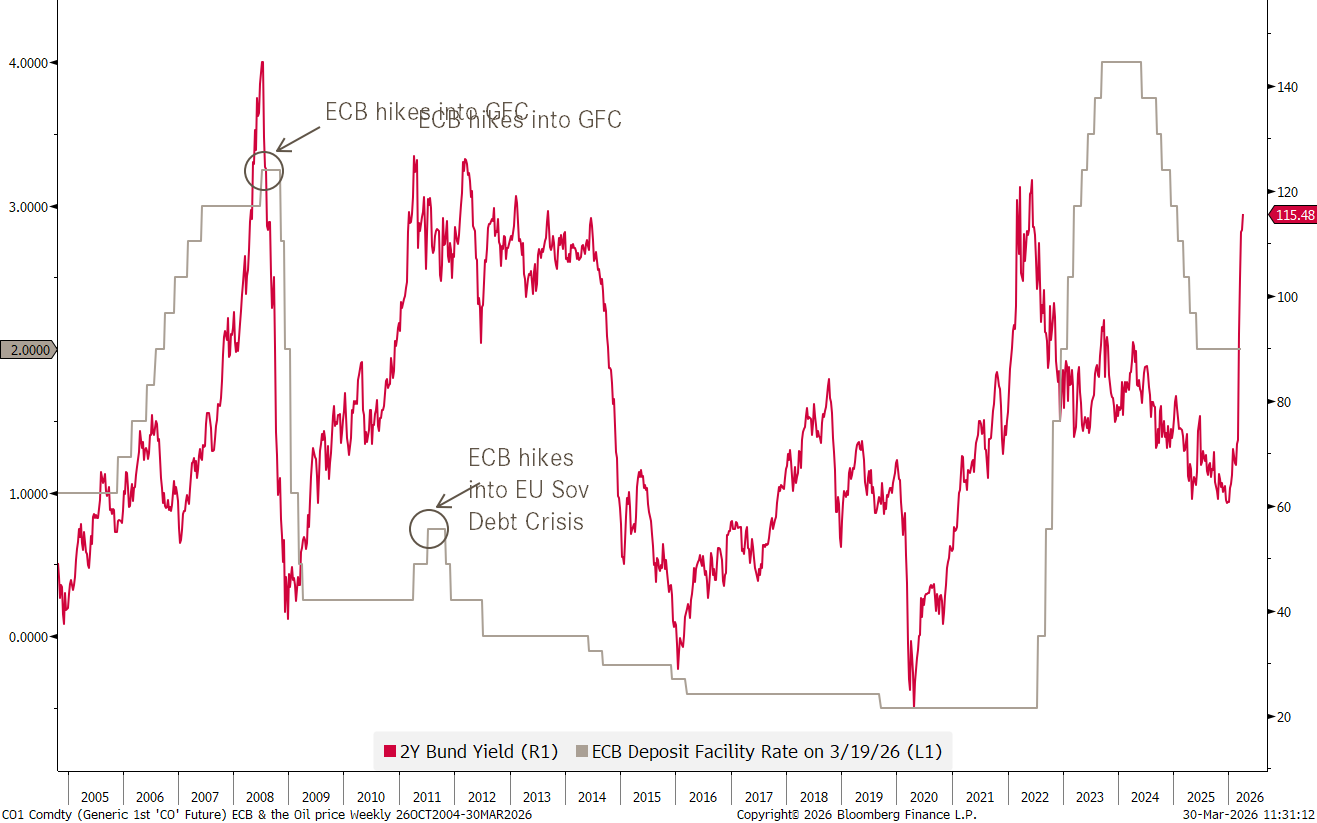
I say stunningly above, as though you could argue that the ECB is only following short-term (2y) rates and is already behind the curve,
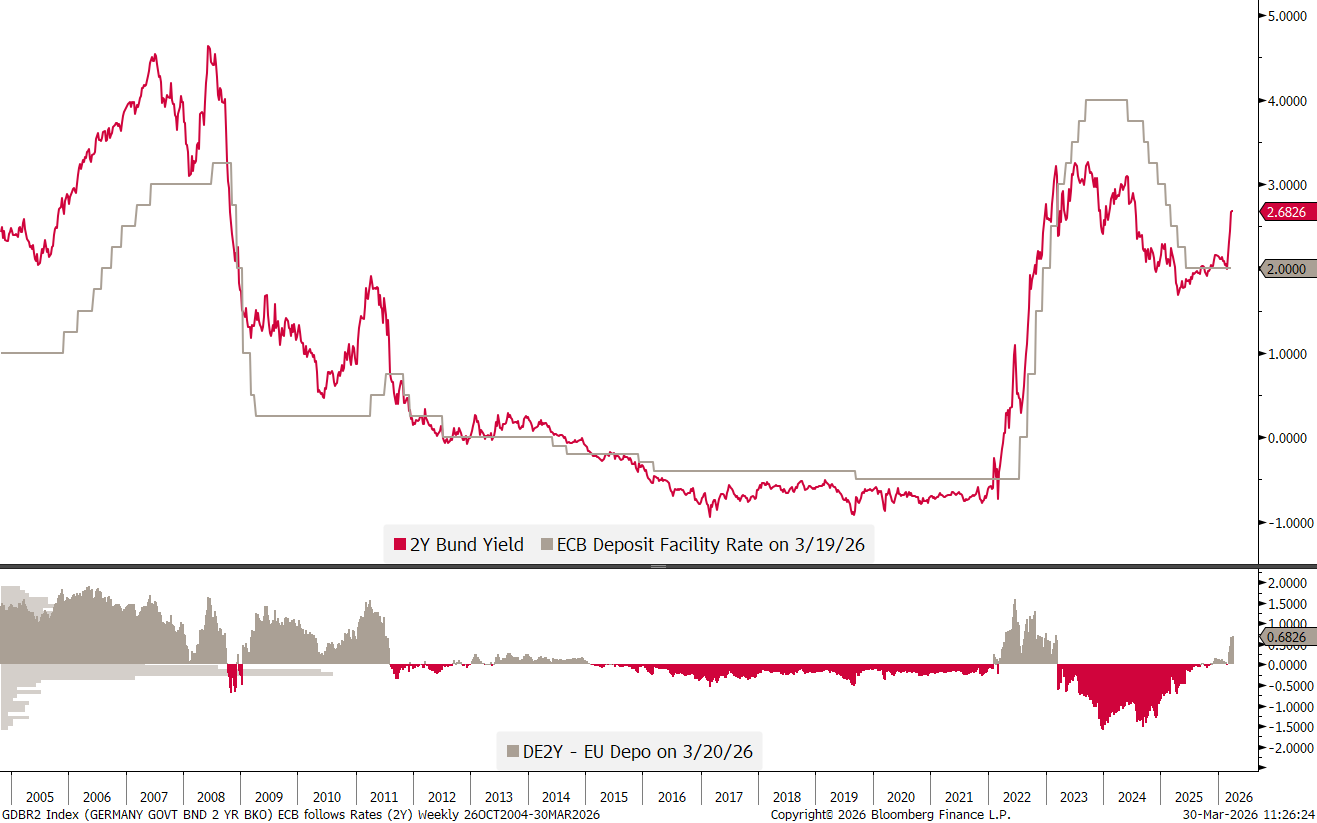
the last two experiences of hiking rates due to higher oil prices alone had been very painful ones…
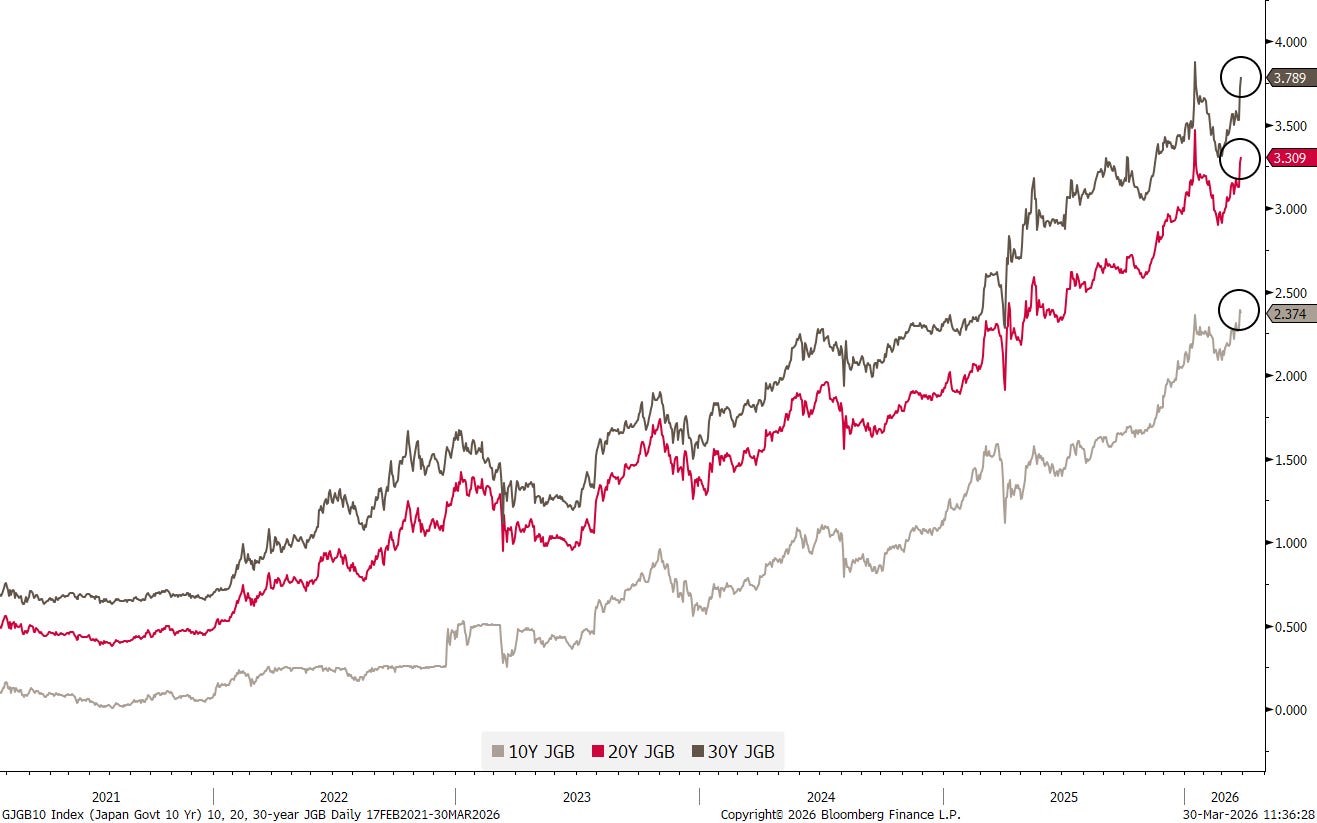
Finally, in Japan, the 10-year version of the JGB yield just hit a new cycle high this morning and the 20- and 30-year yields are close to be doing the same:
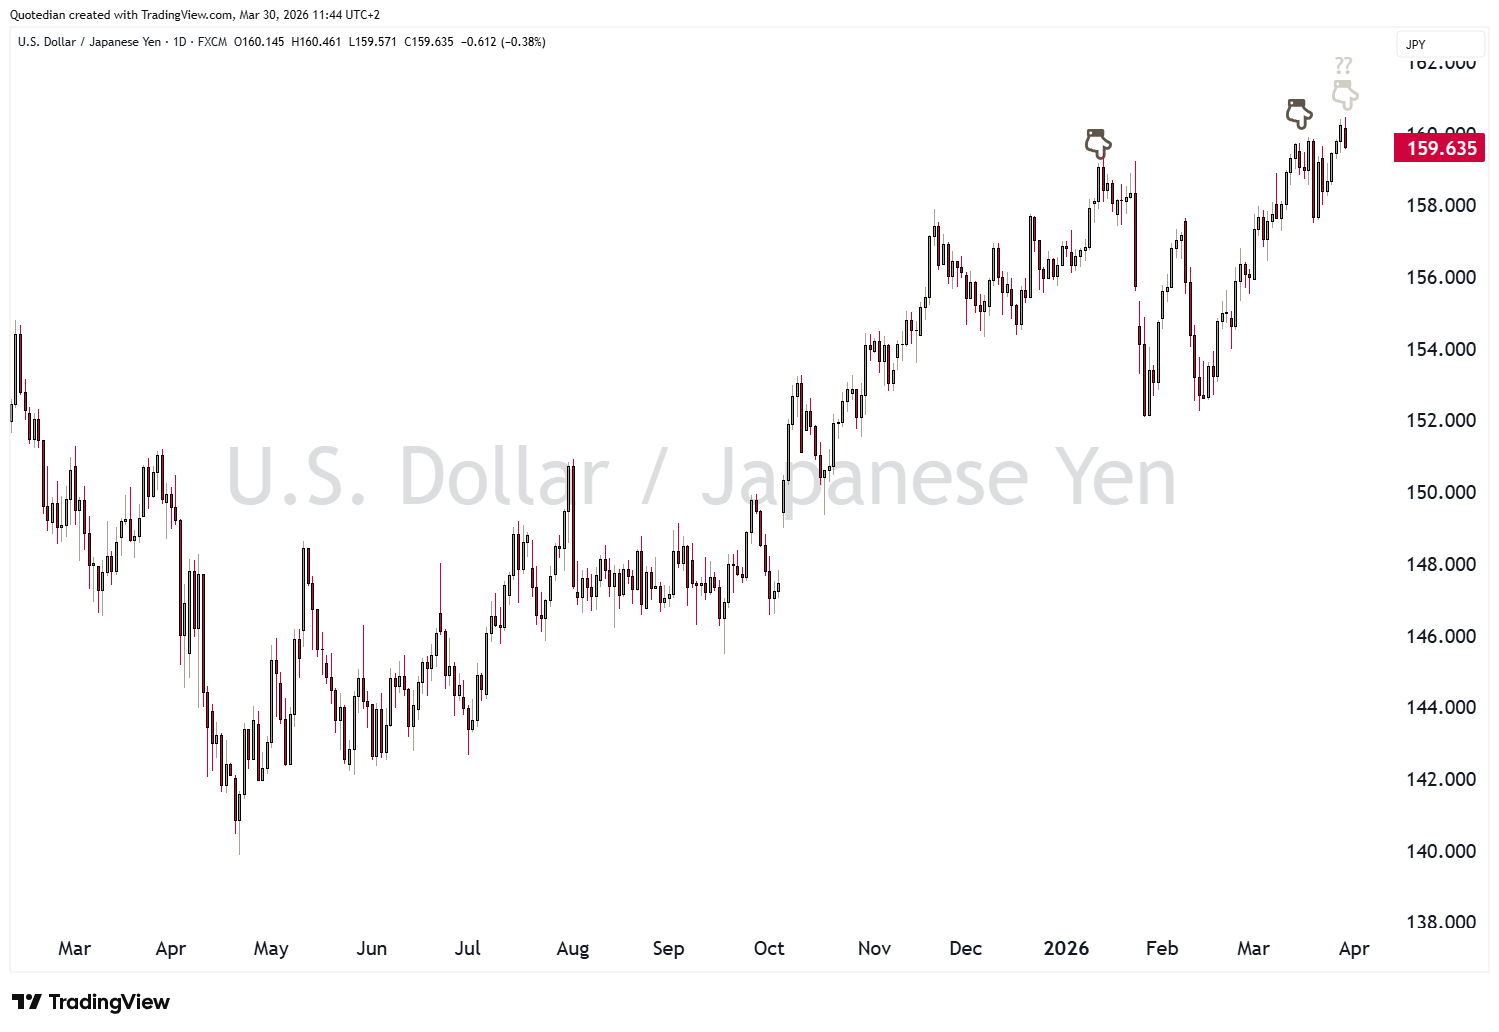
Let’s use this as a segue into our currency market observations, where the interest rate differential between the US 10-year Treasury and the 10-year JGB yield continues to fail to feed into a lower USD/JPY rate:
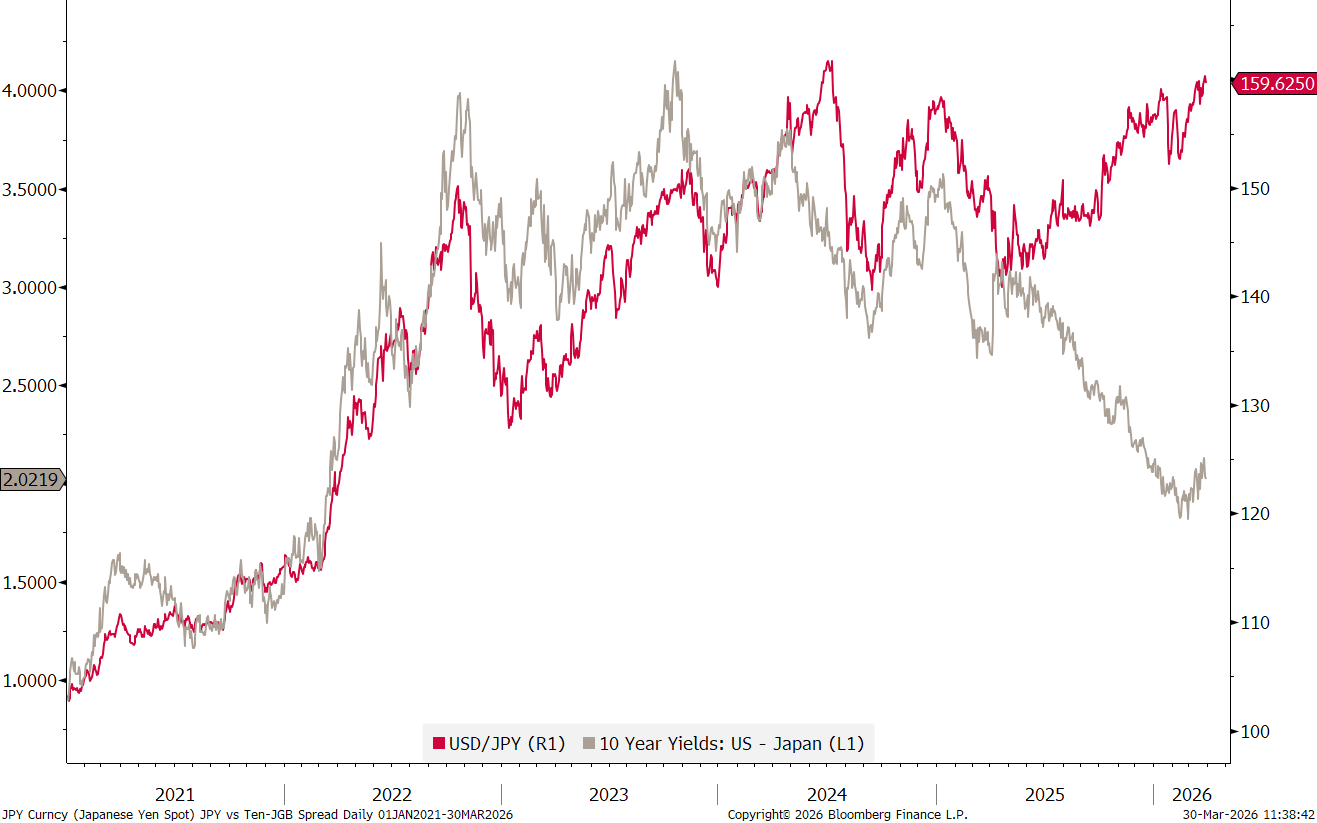
As a matter of fact, the recent quicker acceleration in US yields than Japanese yields, is actually putting renewed upside pressure on the USD/JPY cross … as they say, correlations come and go…
The USD/JPY rate itself at 160 is at previous BoJ/MoF (oral) interventions levels:
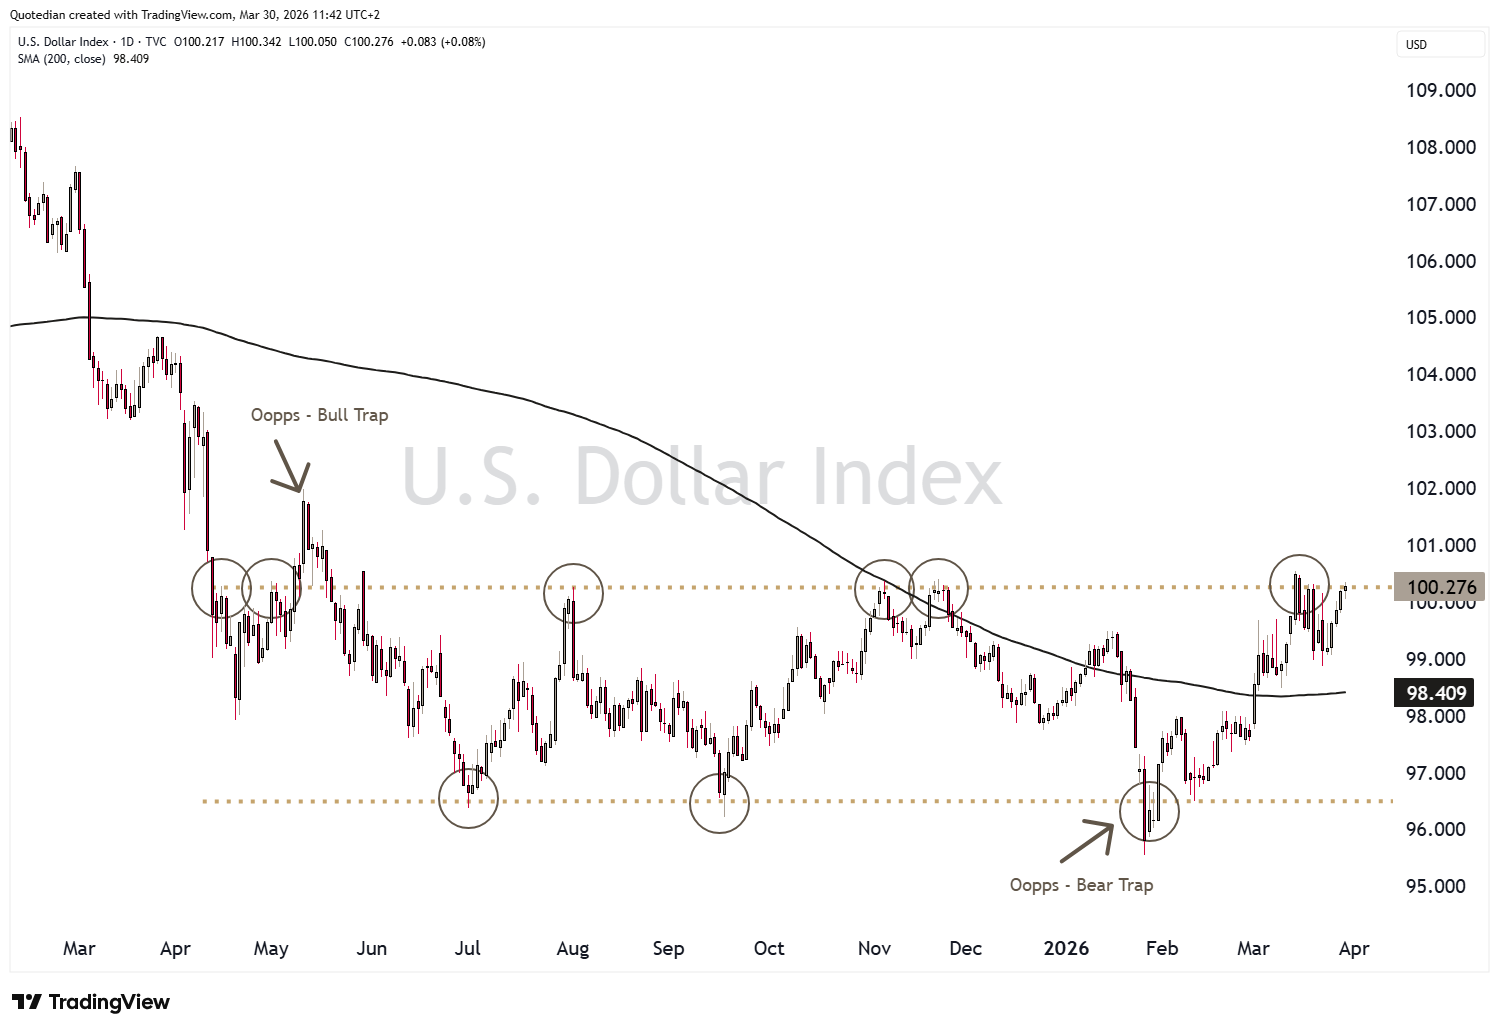
The Dollar Index is trading north of 100 again, but I still miss a clear breakout to the upside (or more pronounced strength overall, as it were):
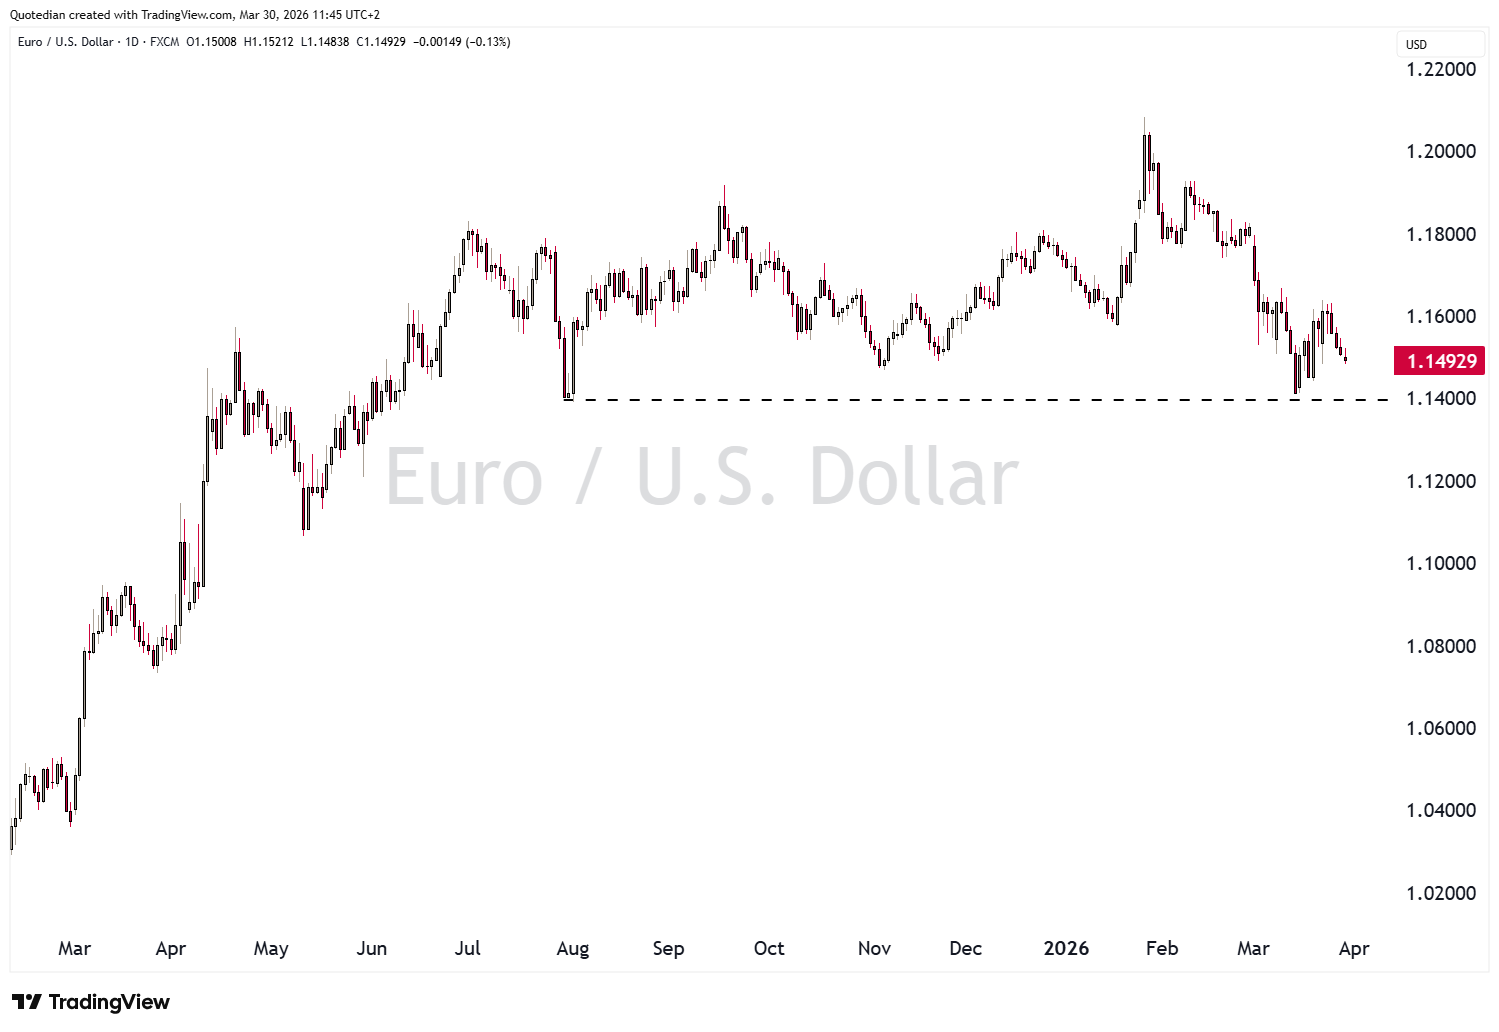
The key support level on EUR/USD at 1.14 is holding for now:
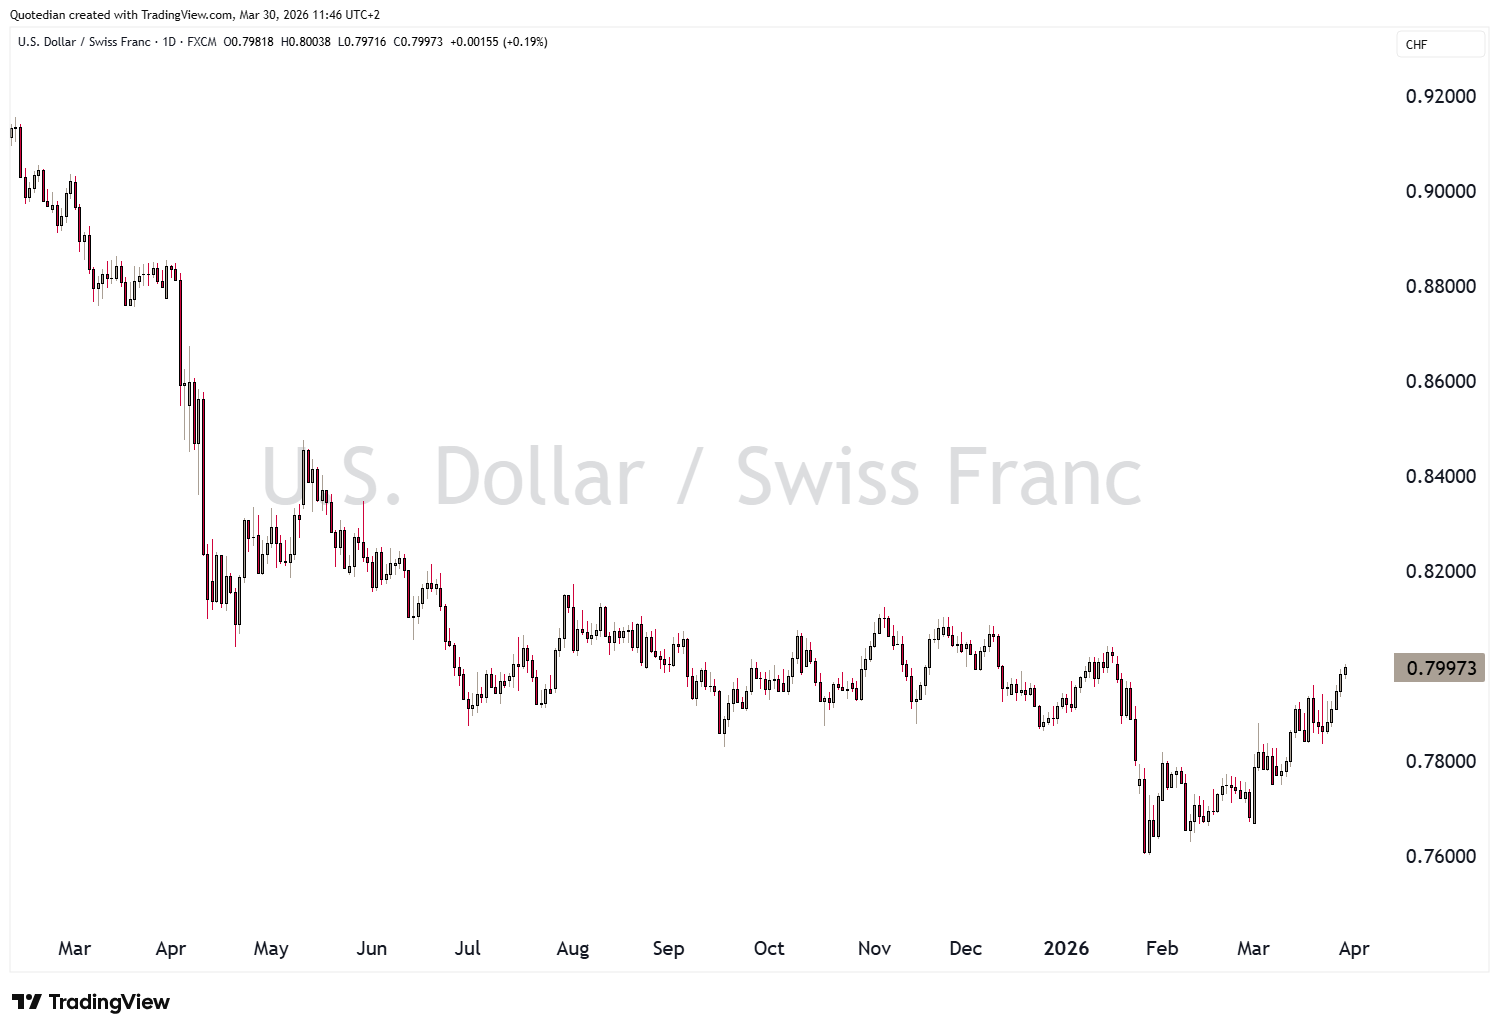
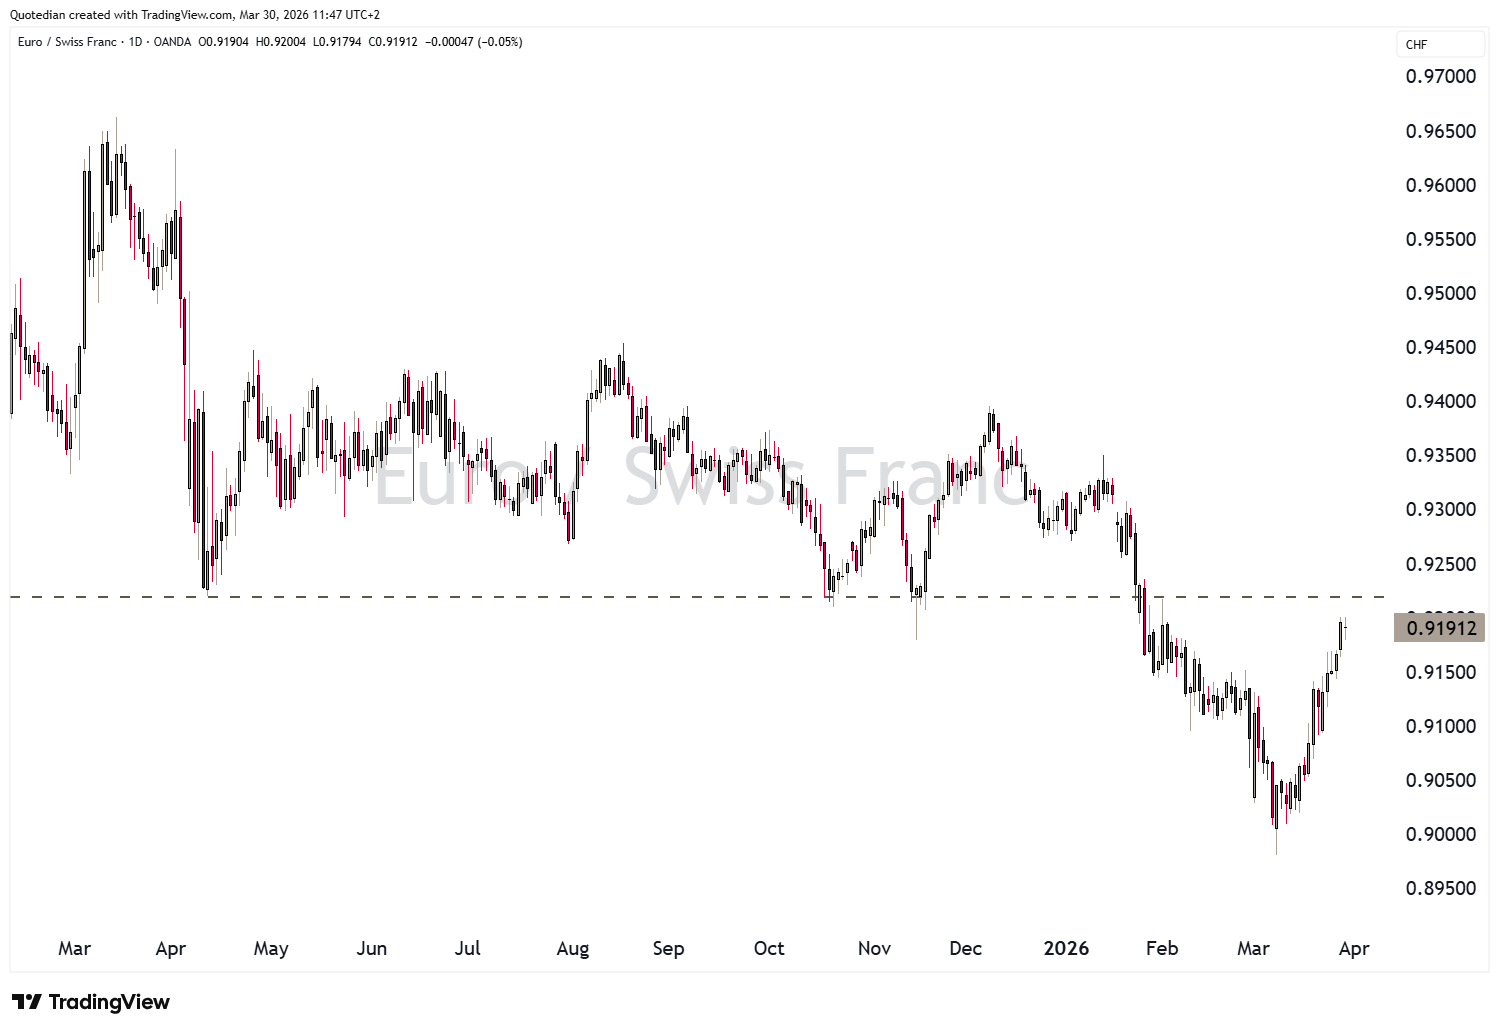
As is the resistance zone at 0.80 on the Dollar/Swissy:
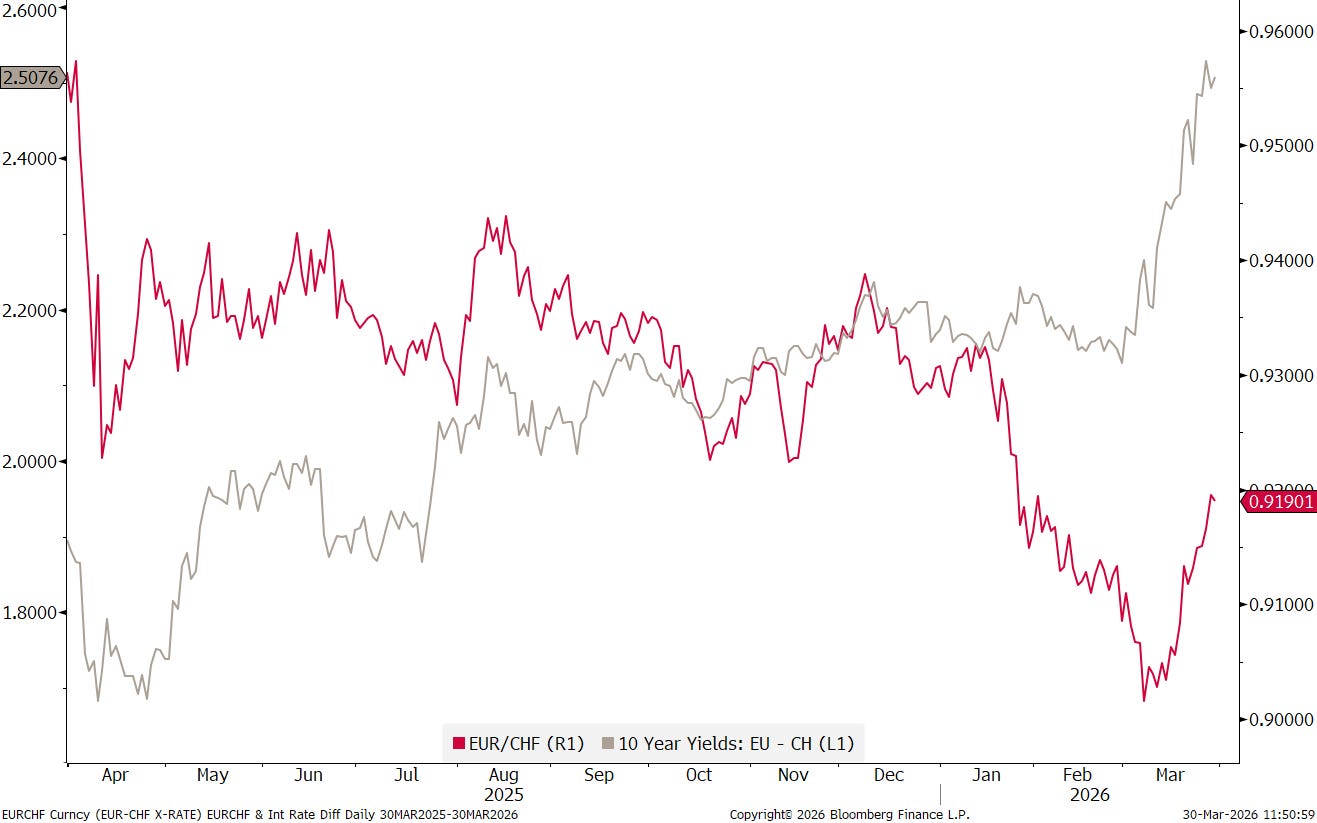
The EUR/CHF cross has seen some strength over the past few weeks:
This is likely due to the rapid increase of the interest rate differential (grey line) between European and Swiss 2-year rates:
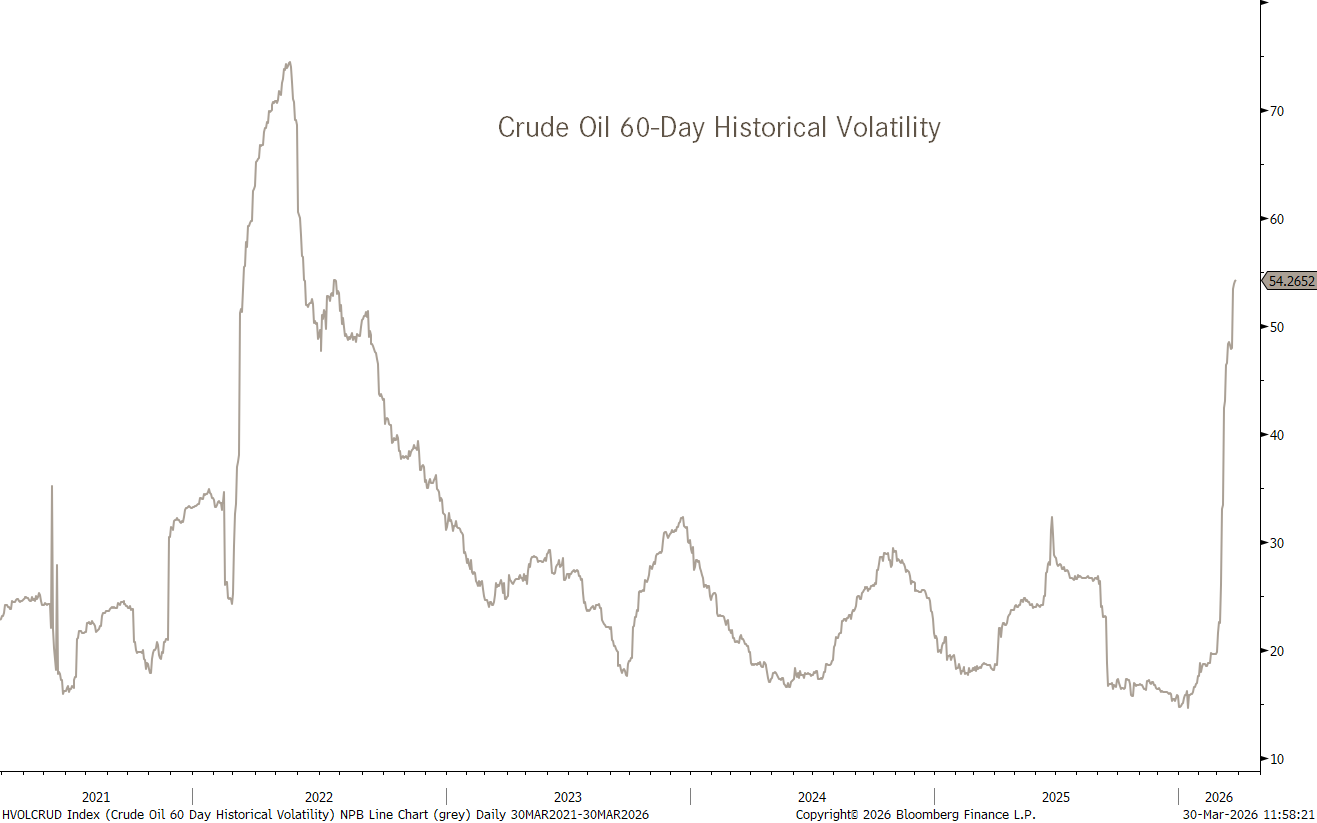
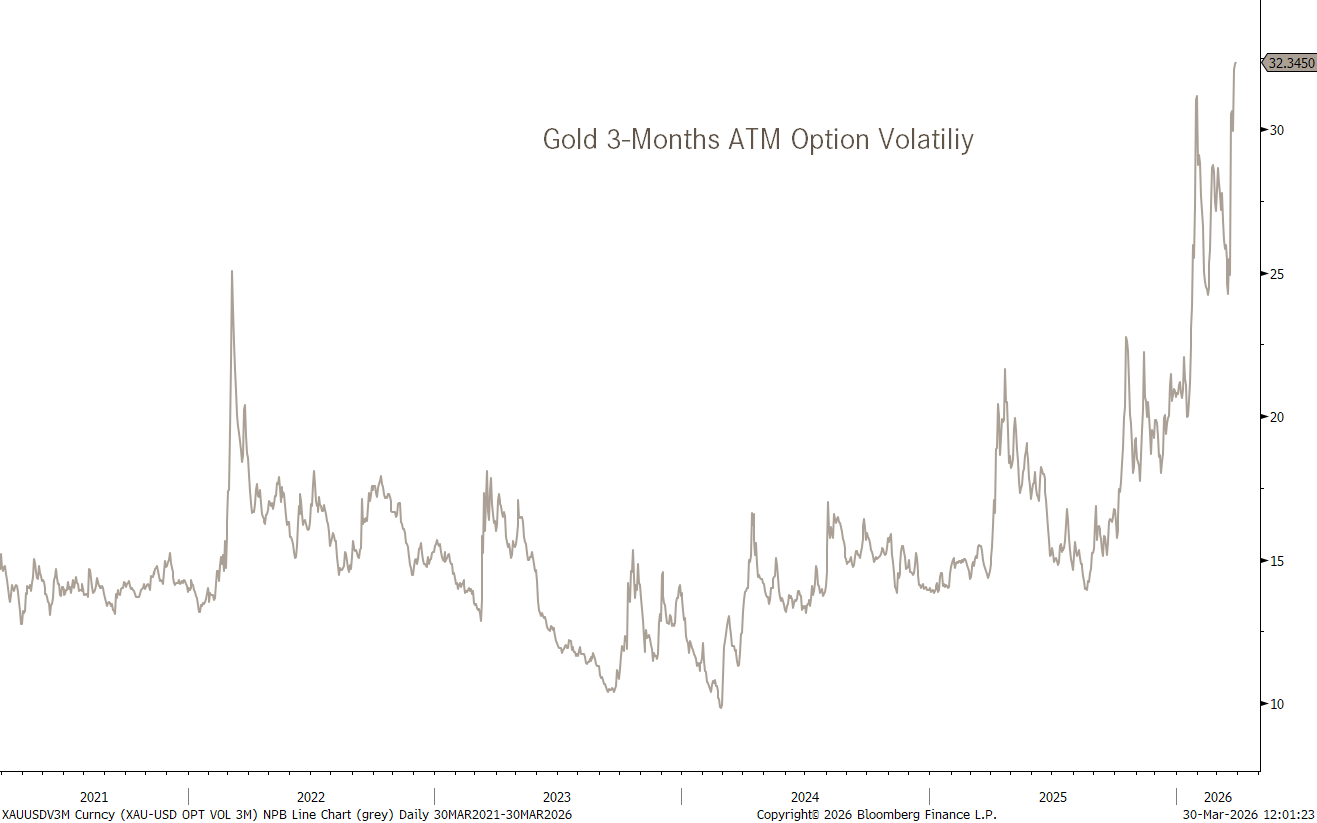
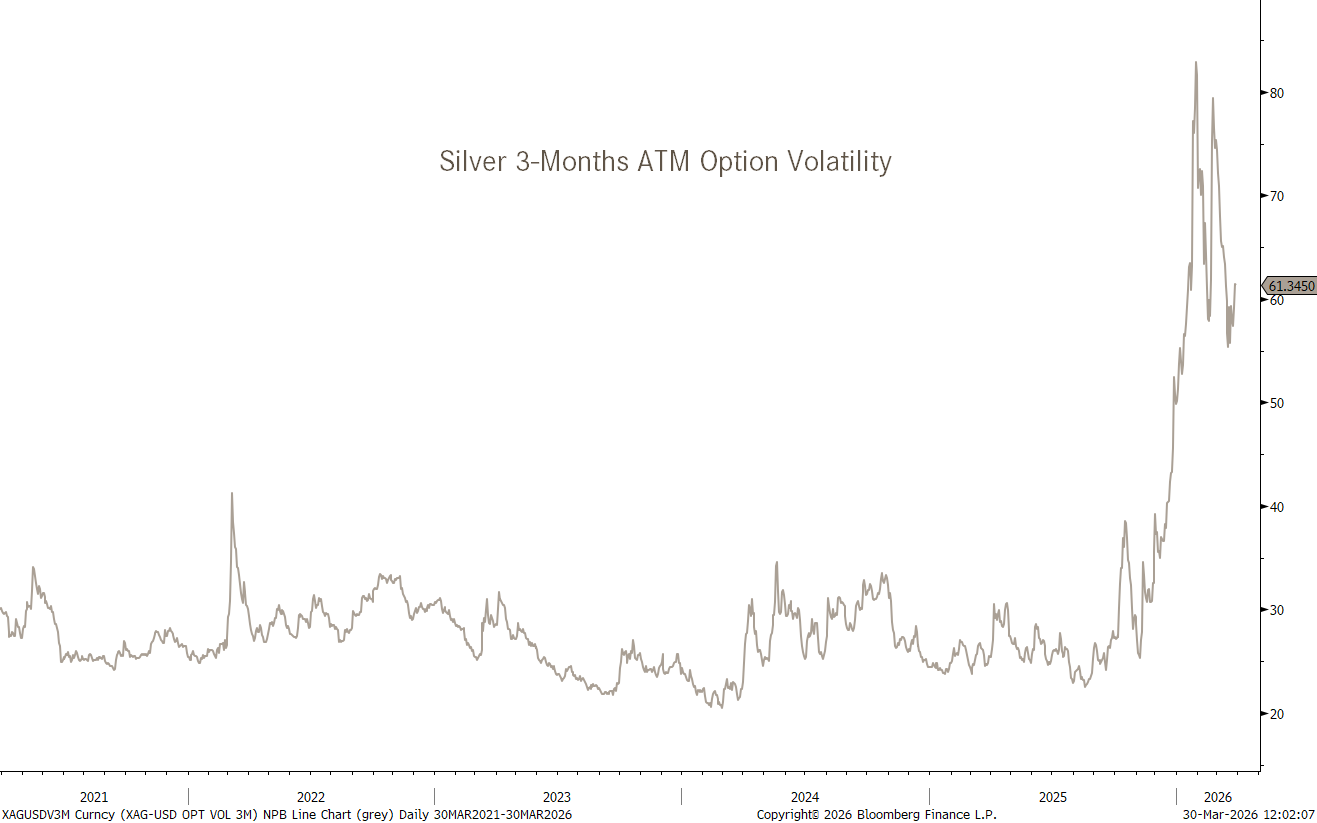
And finally, in the commodity complex, volatility continues to be the key word, be it in oil,
or in precious metals.
Regarding oil, crude futures are usually contracts to quickly mean revert lower again after a spike;
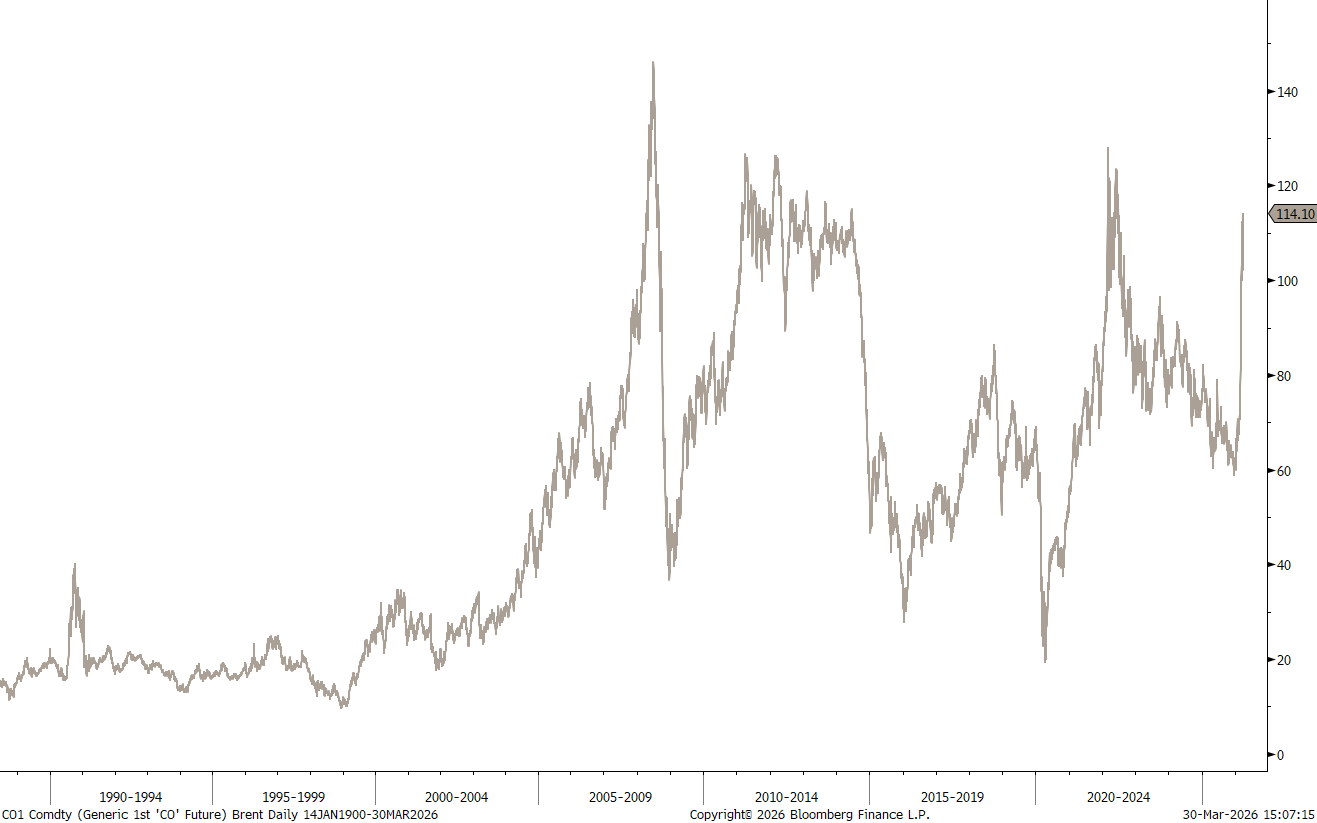
That we are still holding at the levels above USD110, makes me suspicious that this might not quite be over yet.
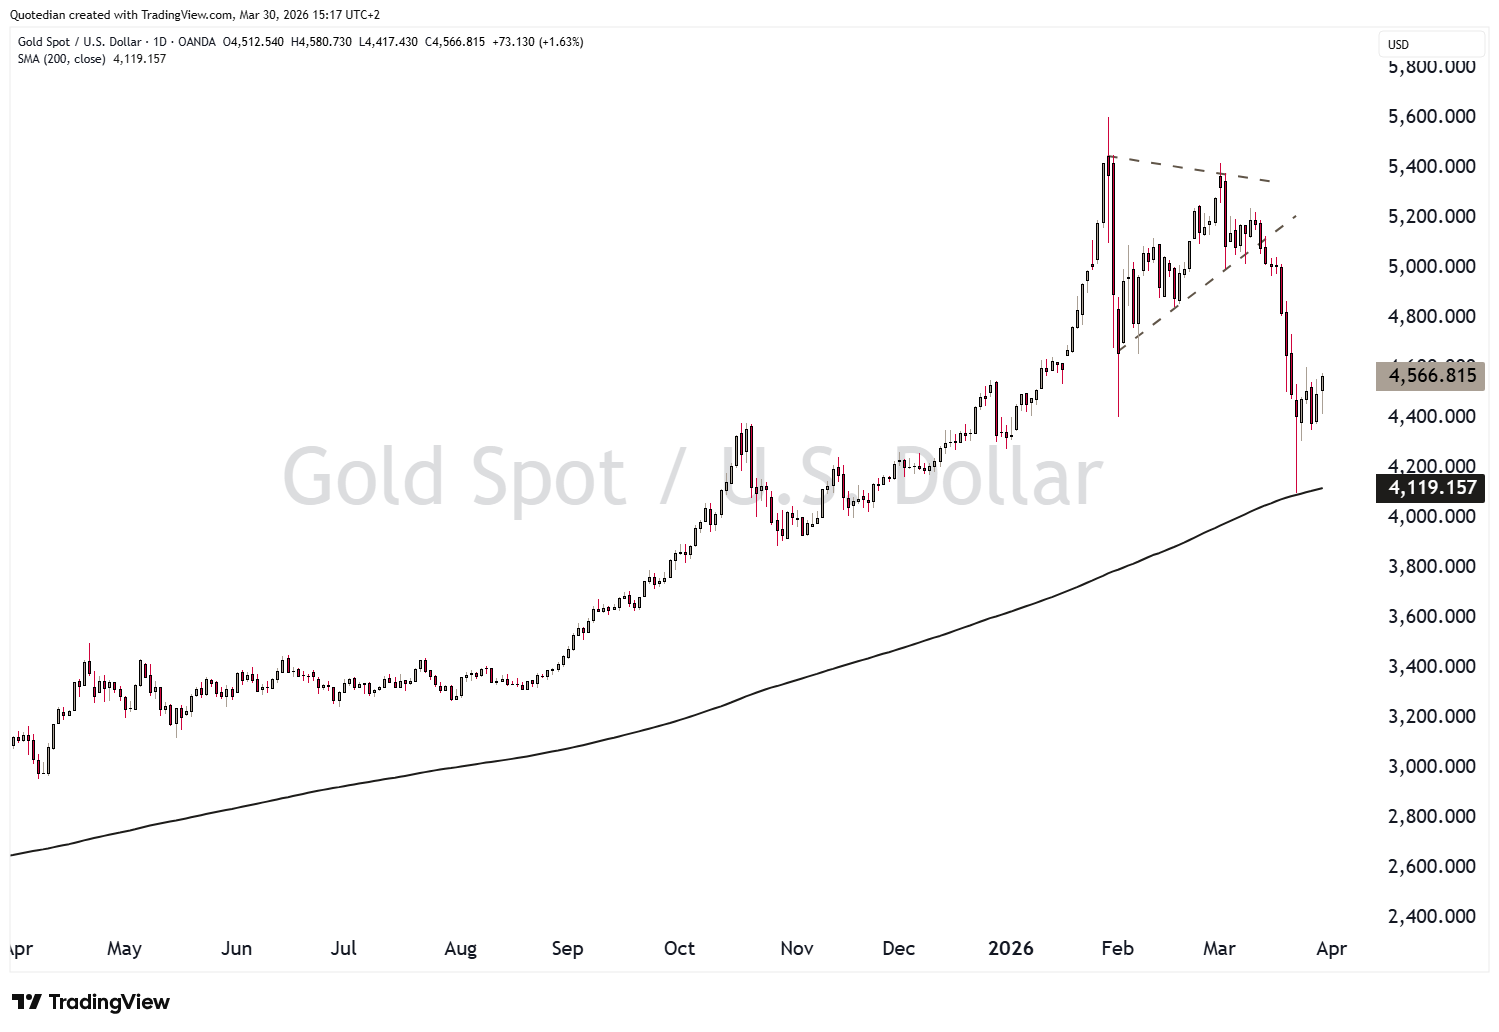
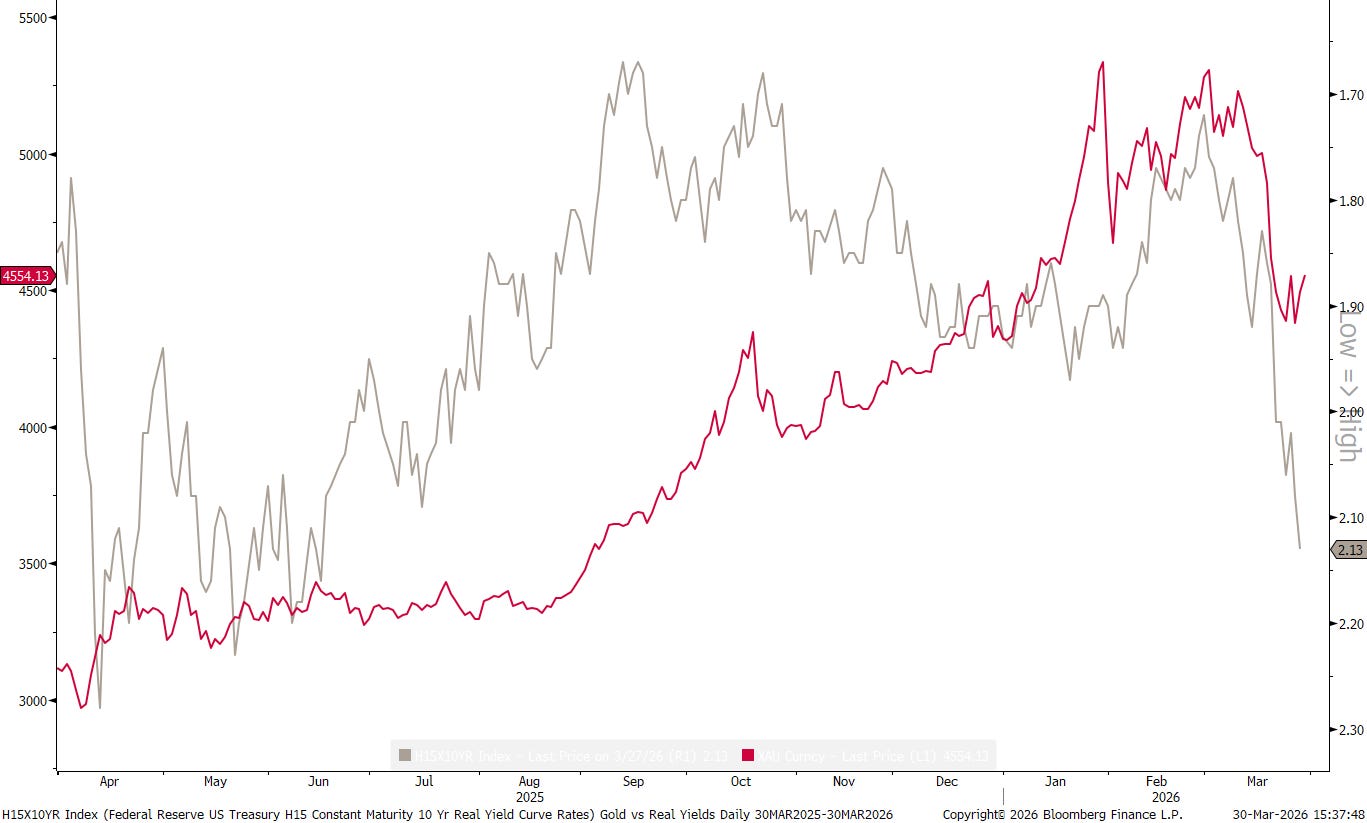
Gold, as mentioned last week, is a potential buy here:
Real rates, which may be topping out here above 2%,
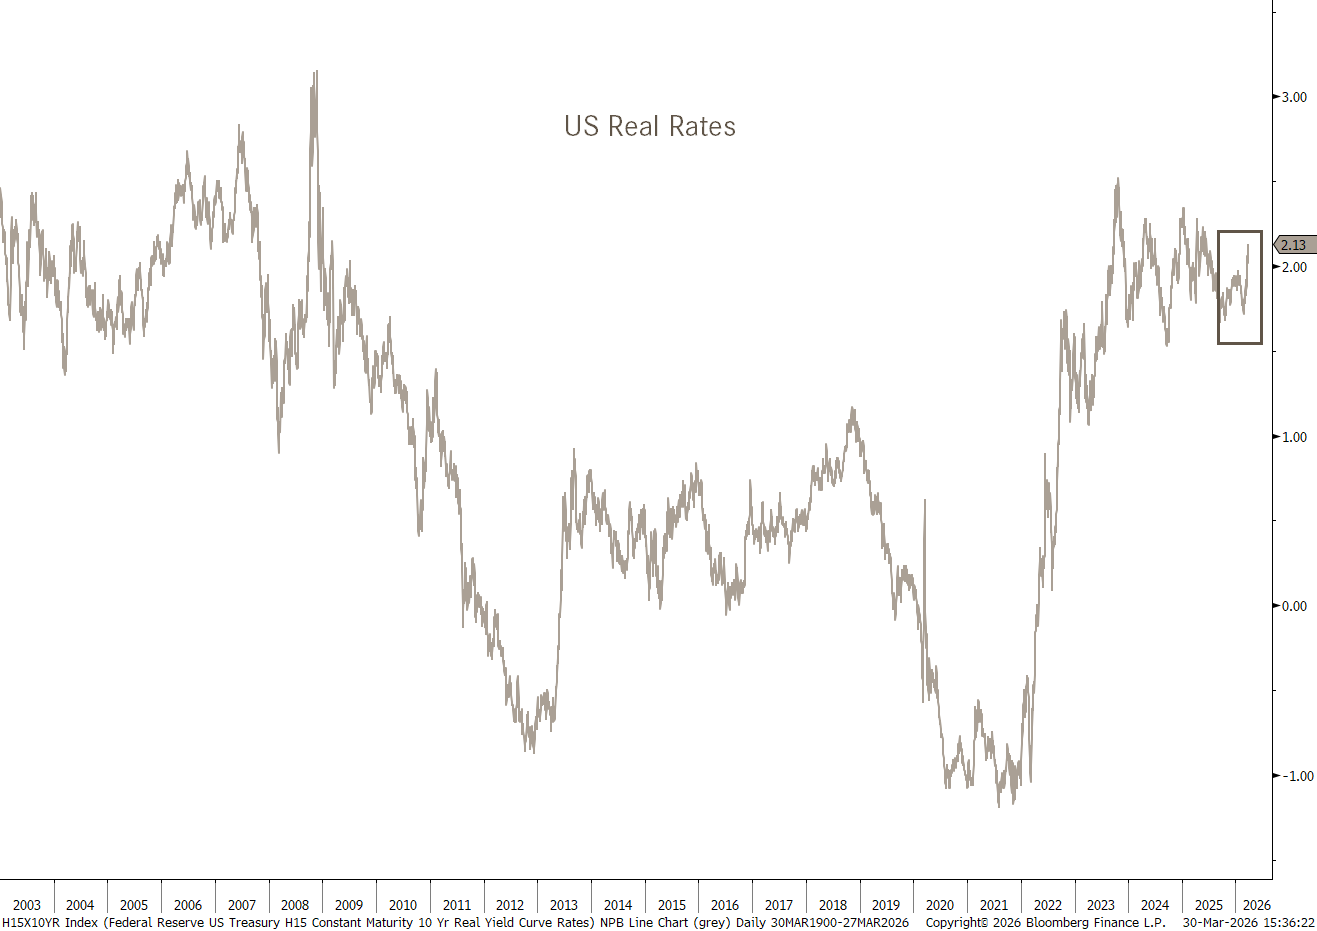
may be supportive to such a gold rally. In the chart below the grey line continues to reflect real rates same as above, but on an inverted scale, whilst the red line is the price of Gold:

Monday is seeing a “smoother” start to the week, however, the potential of the US bringing “boots on the ground” over the Easter weekend nearly guarantees a continuation of elevated volatility. I have of course no additional insight or any tactical warfare experience to share (other than having been a young and proud Lieutenant of the Swiss Army about a thousand years ago),
 Schweizer Armee")
but I wonder what success rate the US army expects with about 15,000 troops, when they had about 700,000 coalition troop size during Operation Desert storm (90-91) and about 300,000 during the second ‘round’ (2003). Unless those 15k are all reincarnations of Chuck Norris of course …
As investor, continue to play defense for now. Not the time yet to increase equity exposure NOR duration aggressively. Once this correction has ended, there will be plenty of time and opportunities to pick up. In the meantime, cash is not trash.
May the Trend be with You!
André

Everything in this document is for educational purposes only (FEPO)
Nothing in this document should be considered investment advice
Investing real money can be costly; don’t do stupid shit
Leave politics at the door—markets don’t care.
Past performance is hopefully no indication of future performance
The views expressed in this document may differ from the views published by NPB Neue Privat Bank AG