PAUSE
The Quotedian - Vol VI, Issue 41 | Powered by NPB Neue Privat Bank AG
“Whenever you find yourself on the side of the majority, it is time to pause and reflect.”
— Mark Twain
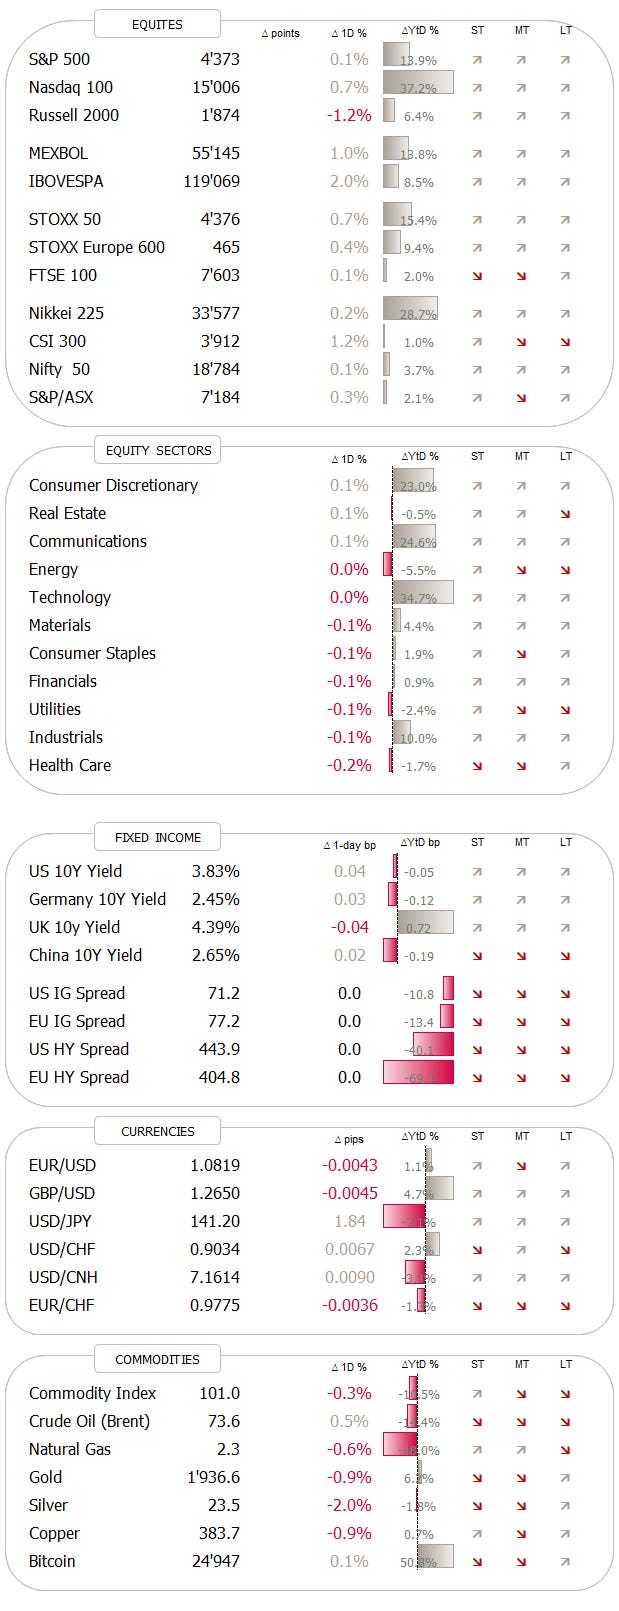
DASHBOARD
AGENDA
CROSS-ASSET DELIBERATIONS
Unbelievable, but it’s been a full week since we launched the last edition of The Quotedian - not acceptable!
But you were pre-warned, it was a Mission Impossible to write our usual Sunday update as we were travelling through Europe.
Hence, given the technical pause we to give to our writing ambitions, today’s letter may be disappointingly short. Full Monty update again on Sunday, as usual.
And speaking of pause, let’s use that as a segue into today’s letter, where we of course briefly need to discuss the FOMC’s decision last night to pause the current (interest) rate hiking cycle.
Whilst the pause/skip was widely awaited, with only very low odds for an additional hike, the hawkishness expressed via the FOMC’s Dot Plot took some by surprise:
At the median, FOMC members now expected Fed Fund rates to be at 5.6% by the end of the year, which would equal roughly to more hikes.
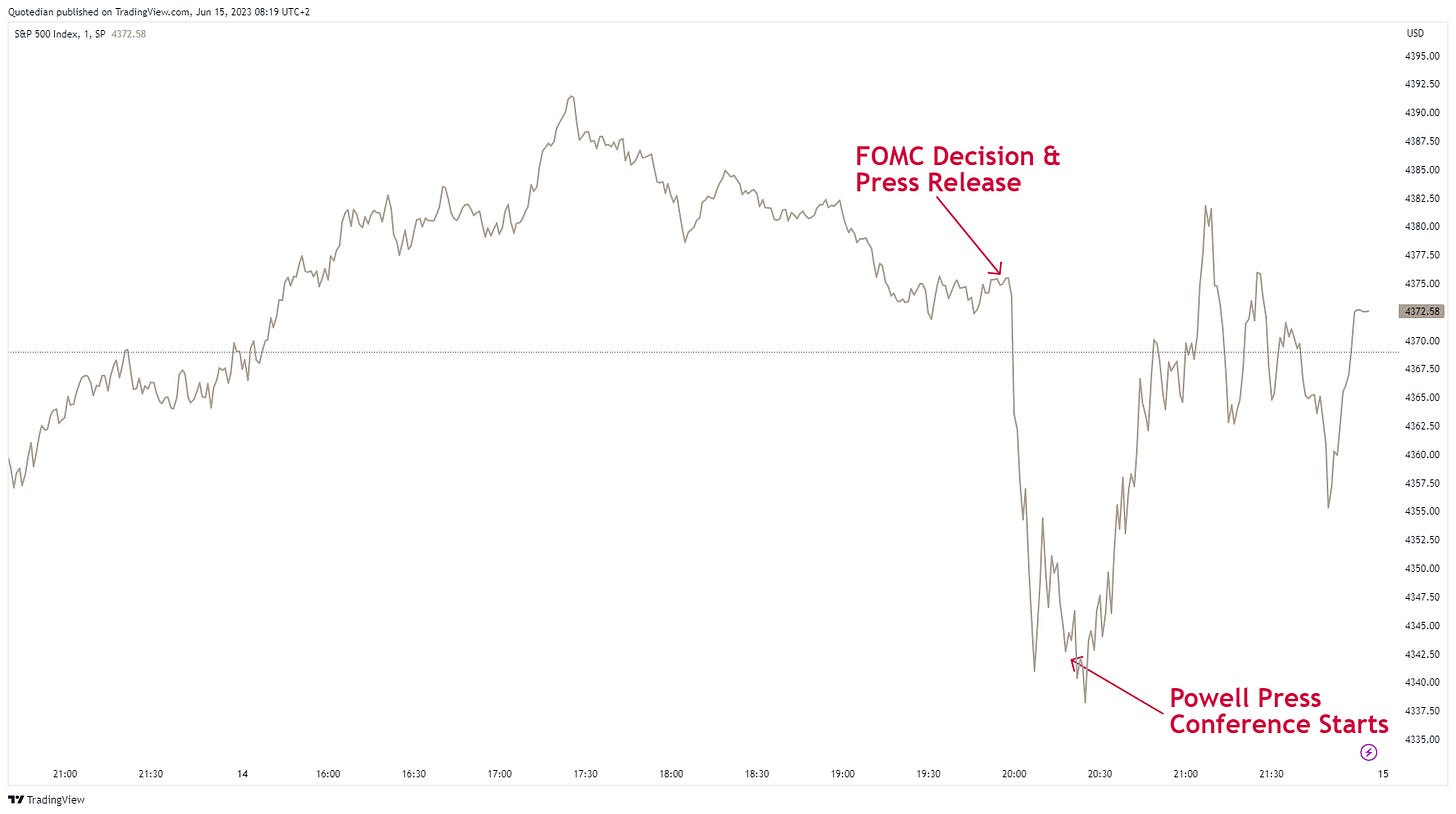
As seen so often in recent past, after the hawkish tone of the press release post FOMC meeting, Powell then came into the press conference, with the apparent intention of soothing “upheaval” in markets again.
This was best seen on equity markets, which went through a bust-boom cclye in less than hour …
The good old Quotedian, now powered by Neue Privat Bank AG
NPB Neue Privat Bank AG is a reliable partner for all aspects of asset management and investment advice, be it in our dealings with discerning private clients, independent asset managers or institutional investors.
The following chart shows the S&P 500 intraday path yesterday, and whilst a timeline description does not seem necessary I still added it …
Once again, the heavy-lifting in the late afternoon rally seemed to be done by the usual few market behemots, which was not only visible in negative market breadth (three decliners for every two advancers) and the Nasdaq’s outperformance (+0.7%), but also in the S&P 500’s heat map itself:
Asian stocks this morning are largely copy/pasting Wall Street’s performance of last night and are mostly trading higher. European equity futures however are a bit more on the cautious side and suggest a slightly lower opening of cash markets in a few minutes.
Turning to fixed income markets, the intraday chart of the US 2-year treasury yield, the one bond yield that trades closest to the Fed’s interest rate policy, showed once again start disagreement to the equity markets’ desire to pay attention to Powell’s dovish press conference:
As the chart above shows, at first bond yields did react to the Powell press conference, but eventually starting paying attention to that Dot Plot again and yields did not end far from their highest (blue arrow) right after the FOMC decision peak.
Not unsurprisingly, the yield curve (10y-2y) also inverted further, closing in again on the record-inversion of March.
Here’s the very-long term version of the same chart as a friendly reminder:
One last chart on the FI side, which I think does simply not get enough attention by market participants. Yields in the UK (2y) now exceed their Autumn 2022 LDI panic highs:
I know it is just a small island, but there is a message there, IMHO.
Yield in Europe are also trading higher this morning after the FOMC decision.
Let’s finish today’s short essay with currencies, where the US Dollar seems to agree more with bonds than with equities regarding the hawkishness of the Fed, as it rose post-FOMC announcement into today. Here’s the intraday chart of the US Dollar index (DXY) since yesterday:
However, on the daily chart it continues to trade within a short-term downtrend, having recently stalled at a major resistance point:
And just a few more things, before we sign off:
The PBOC (central bank of China) just announce a first rate cut in 10-months:
ECB decision due today
BoJ decision due tomorrow
Ok, time to hit the send button. Next (major) update on Sunday, where I hopefully will also be able to finally reveal the path forward for the Quotedian.
CHART OF THE DAY
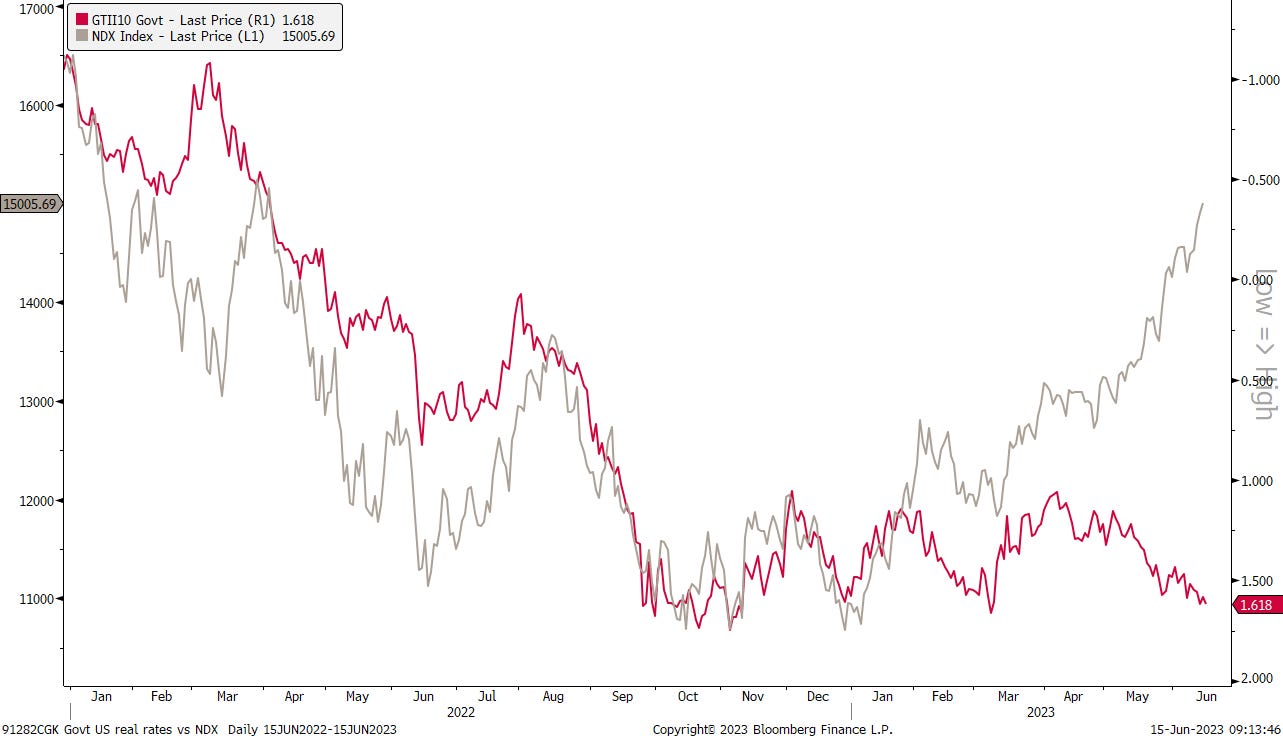
The chart below shows US 10-year real yields (red - inverted) versus the Nasdaq 100.
A once pretty neat correlation seems to be gone - at least for now.
Will this narrative ever come back? Stay tuned …
Thanks for reading The Quotedian! Subscribe for free to receive new posts the moment they are published.
DISCLAIMER
Everything in this document is for educational purposes only (FEPO)
Nothing in this document should be considered investment advice
The views expressed in this document may differ from the views published by Neue Private Bank AG
Past performance is hopefully no indication of future performance


