

Pessimismus Perpetuus Mercatus
Vol VII, Issue 44 | Powered by NPB Neue Privat Bank AG
“Bull markets and bear markets last long enough so that the average trader is likely to forget by the time the climax is approaching that any sort of movement is possible.”
— Philip Carret

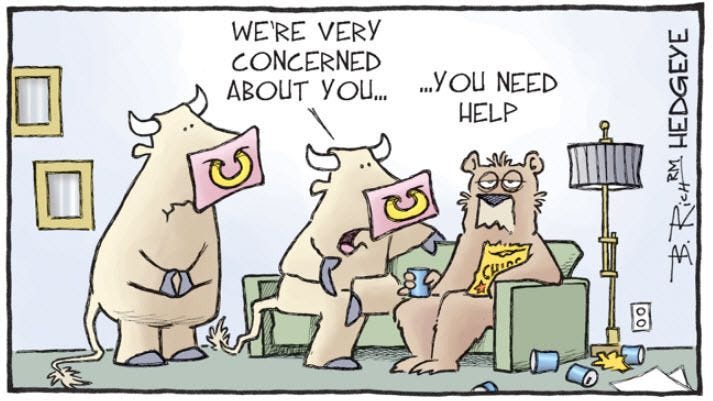
With this S&P up another five percent in November and up over 26% year-to-date, the index is likely to provide us with a second consecutive year of 20%-plus performance. Hence, over the past few days versions of the following ‘statistic’ has been making the social media rounds:
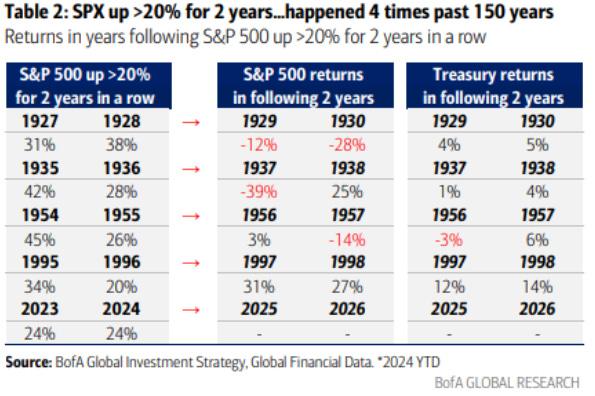
Not sure what or which side this stat tries to argue, but in case it is the bear-case (I know I repeated case twice, actually now three times in the same sentence), but I have an immediate antidote:

However, should the patient continue to be suffering from a severe case of Pessimismus Perpetuus Mercatus, characterized by chronic bearishness and an inability to see upside potential in market conditions, then this “pill”
in combination with a one-time injected vaccine of
should do the trick.
Of course, markets to do not go up in a straight line, but having a perma-bear view clearly has not been very helpful. Hence, as investors we must stay flexible, leave out emotions and listen to what price tells us:

With that out of the way, let’s get it started for this month’s longer-term aspects of “things”, via our YTD/November performance tables in combination with a bunch of monthly candlestick charts.


Here are the %-performances of global equity benchmark indices in November (red) and year-to-date (grey), sorted top-down by the latter:

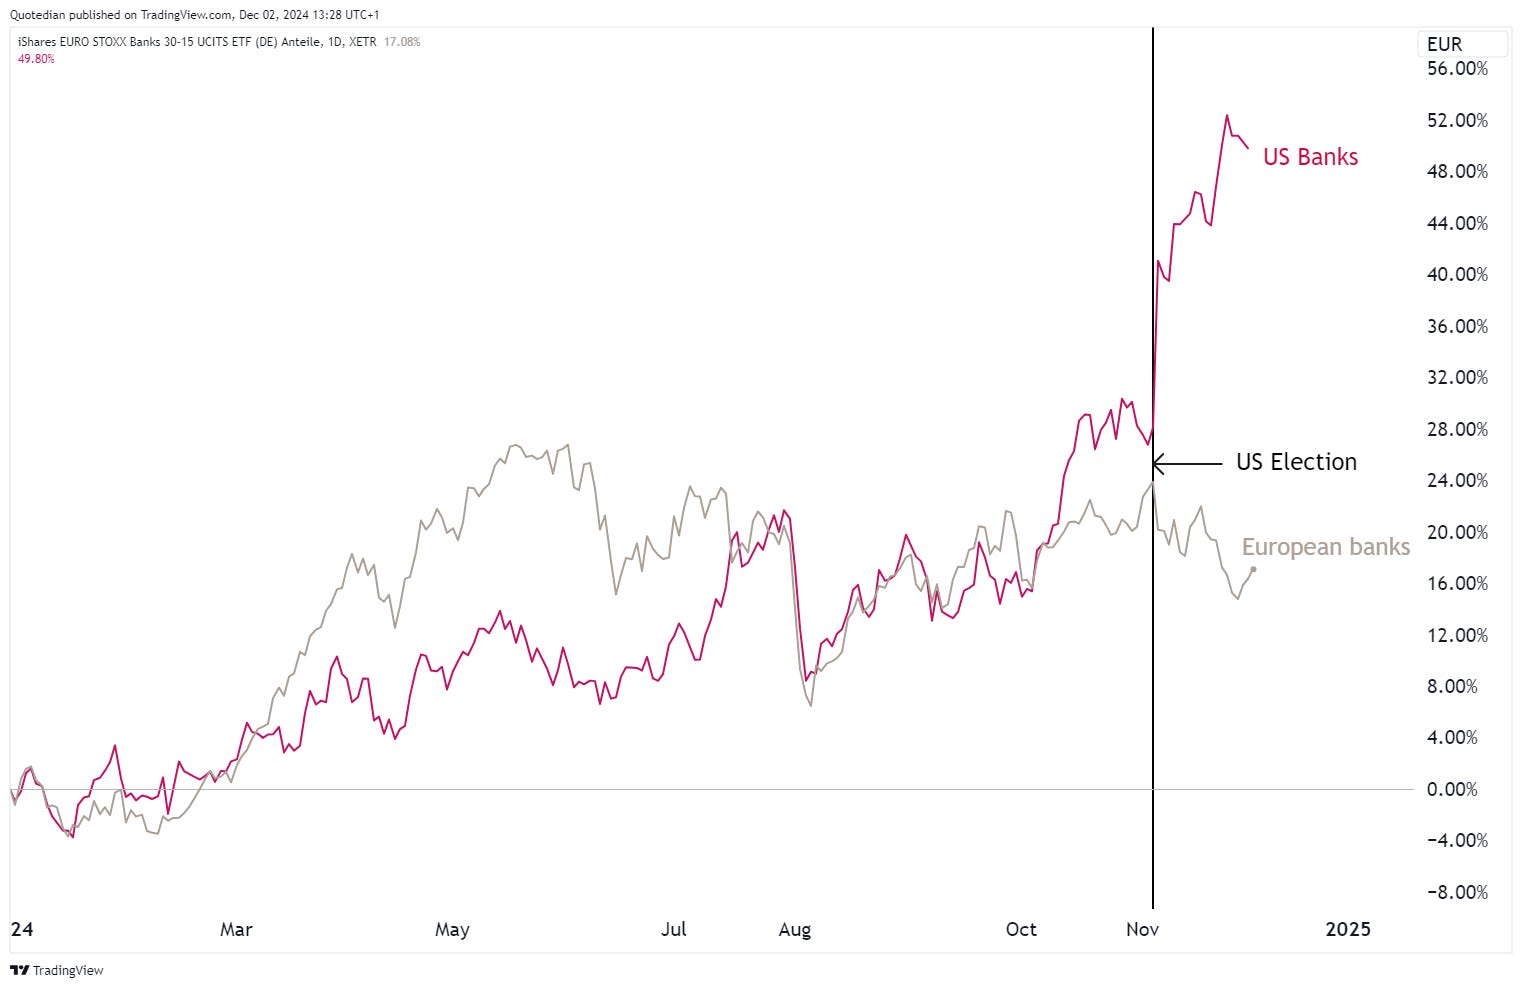
Clearly, North America was the place to be invested, post the Red Sweep in the USA. Hong Kong stocks were the largest ‘losers’, followed by many European regional markets, with the notable exception of Germany.
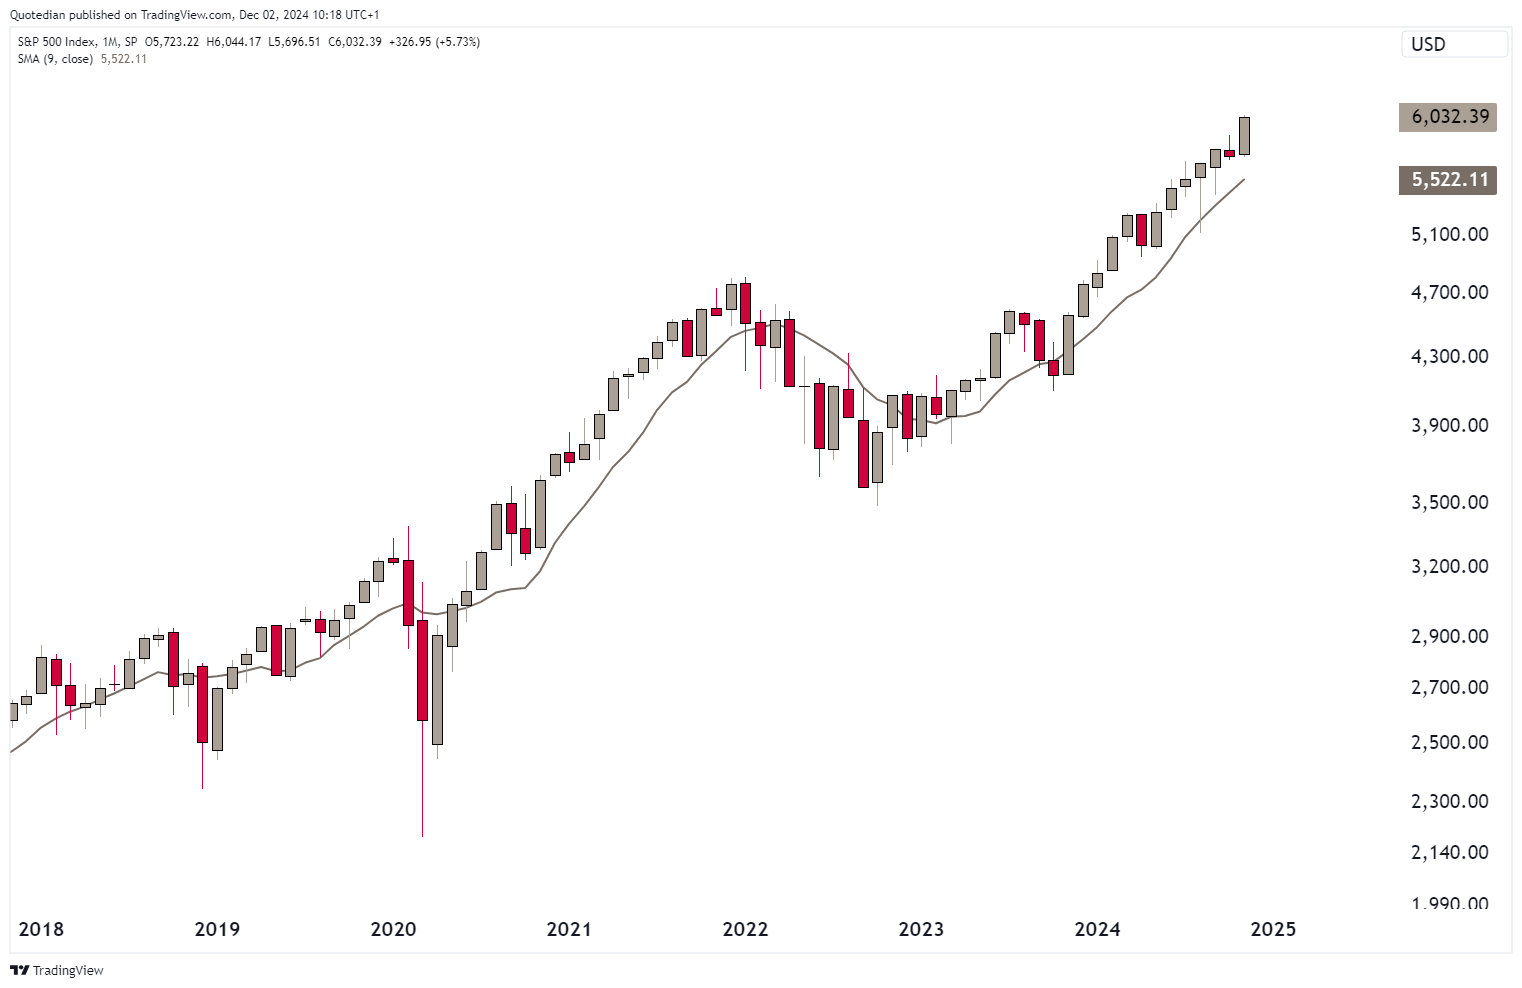
For US stocks (S&P 500), it was the largest monthly gain since November of last year:

On a monthly candlestick chart, this looks unequivocally bullish then:
One of our worries at the beginning of the month was a decreasing participation in market advances, as for example witnessed by a divergence between rising index and a falling advance-decline summation indicator. This “yellow” warning traffic light switched back to “green” post the US election:

The Nasdaq 100 broke out to a new all-time high (ATH) for the first time since July:

But the real stars of the November show were US small cap stocks (Russell 2000), breaking out of its longer-term sideways range AND making the first new ATH since June 2021!!

Staying in North America one chart longer, we remember from last week incoming President Trump’s threat towards the USA’s two neighbouring nations to slam 25% tariffs on them. The fortunes over recent past for their respective stock markets have been a story of two tales:

As seen on the performance table at the beginning of this section, European stocks did not share they same good fortune as their US cousins, even though they still eked out a tiny advance:

In fact, the intramonth test of ex-resistance of late 2021 as a new support (pointing hand) is even kind of encouraging and could develop into something constructive, should upside follow-through emerge. A first step would be a move back above the 10-month (ca. 200-day) moving average.
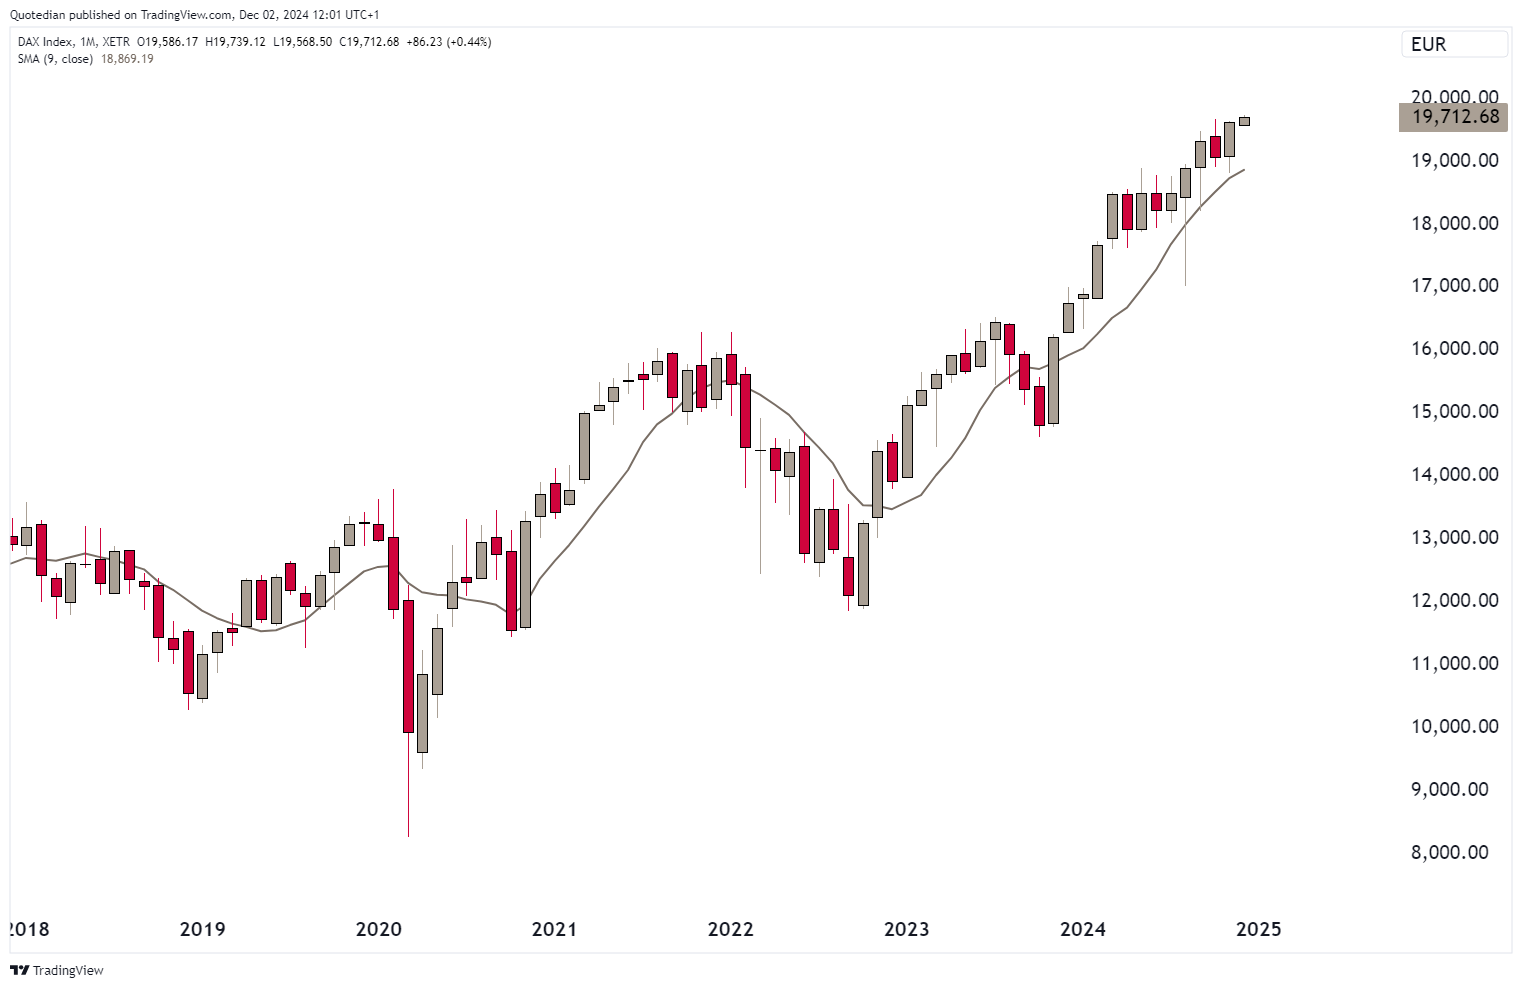
The German DAX index, a conglomerate of internationally active companies, is a point of strength in an otherwise ailing Europe:
HOWEVER, the MDAX, a total rate of return index of 50 mid-cap issues that rank below the DAX, and hence, a good proxy of the famous German Mittelstand, shows the true pain the country’s economy is in:

France is not getting its political act together ever since a dreadful European election results prompted President Emmanuel Macron to call snap legislative elections. John Authers of Bloomberg had a good chart on that recently:

The stock market, as represented by the CAC-40 below, is suffering under the situation and has fallen into ‘official’ correction territory (down 10% or more):

The European South, seems to be better of currently. Here is Spain’s IBEX 35:

Or Italy’s FTSE MIB:

As final nail in the Europe vs SU performance coffin, a year of EU underperformance does unfortunately not mean you should be buying to it for “catch up” the next year:

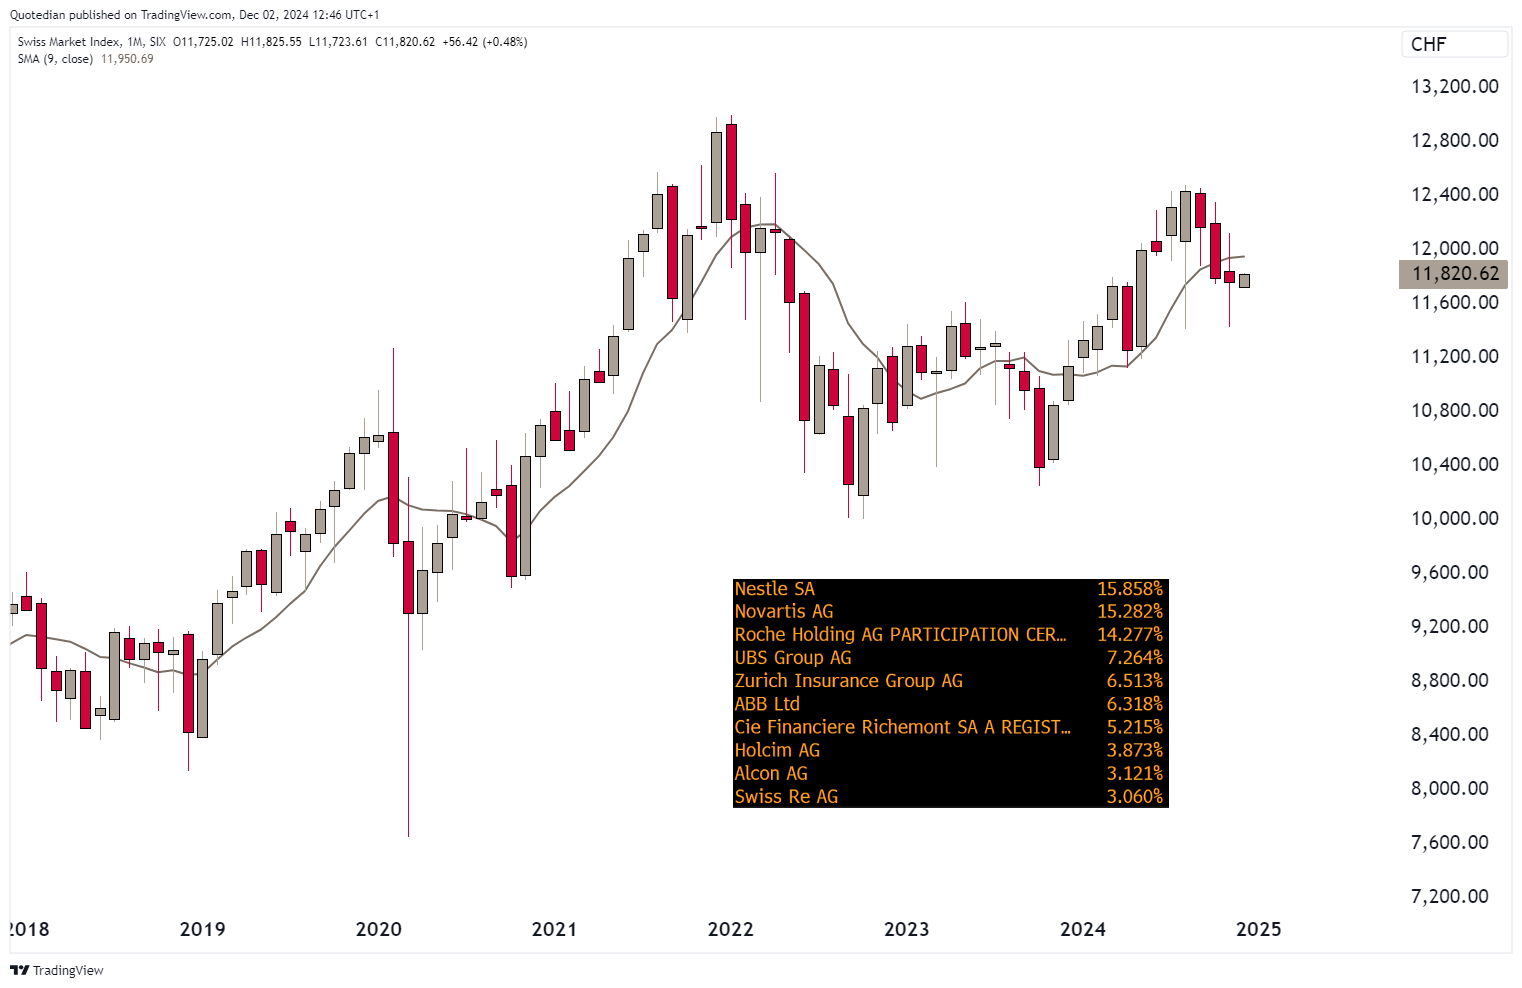
Switzerland’s SMI is, as already noted in last week’s writings (click here), a very defensively tilted index. With two pharma and one consumer staples stock making up 45% of the index, the SMI is up only 6% YTD:
Time for a quick glance at some key Asian markets, starting with India’s BSE 500 index:

The just about ten percent correction in Indian stocks has taken this index back down to its 200-day moving average. Adding to Indian equity risk here makes sense.
In Japan, with a bit of fantasy, we can “paint” a descending triangle pattern on the Nikkei:

The playbooks defines such a pattern as bearish reversal, but in my observations over the past decades, an upside resolution is as much a possibility.
The important word above is resolution, i.e. break out in either direction which would allow us to position accordingly. The much worse outcome would be a 2021 to 2023 repeat:

One of the weaker performances this month, come from Hong Kong’s Hang Seng (-4%):

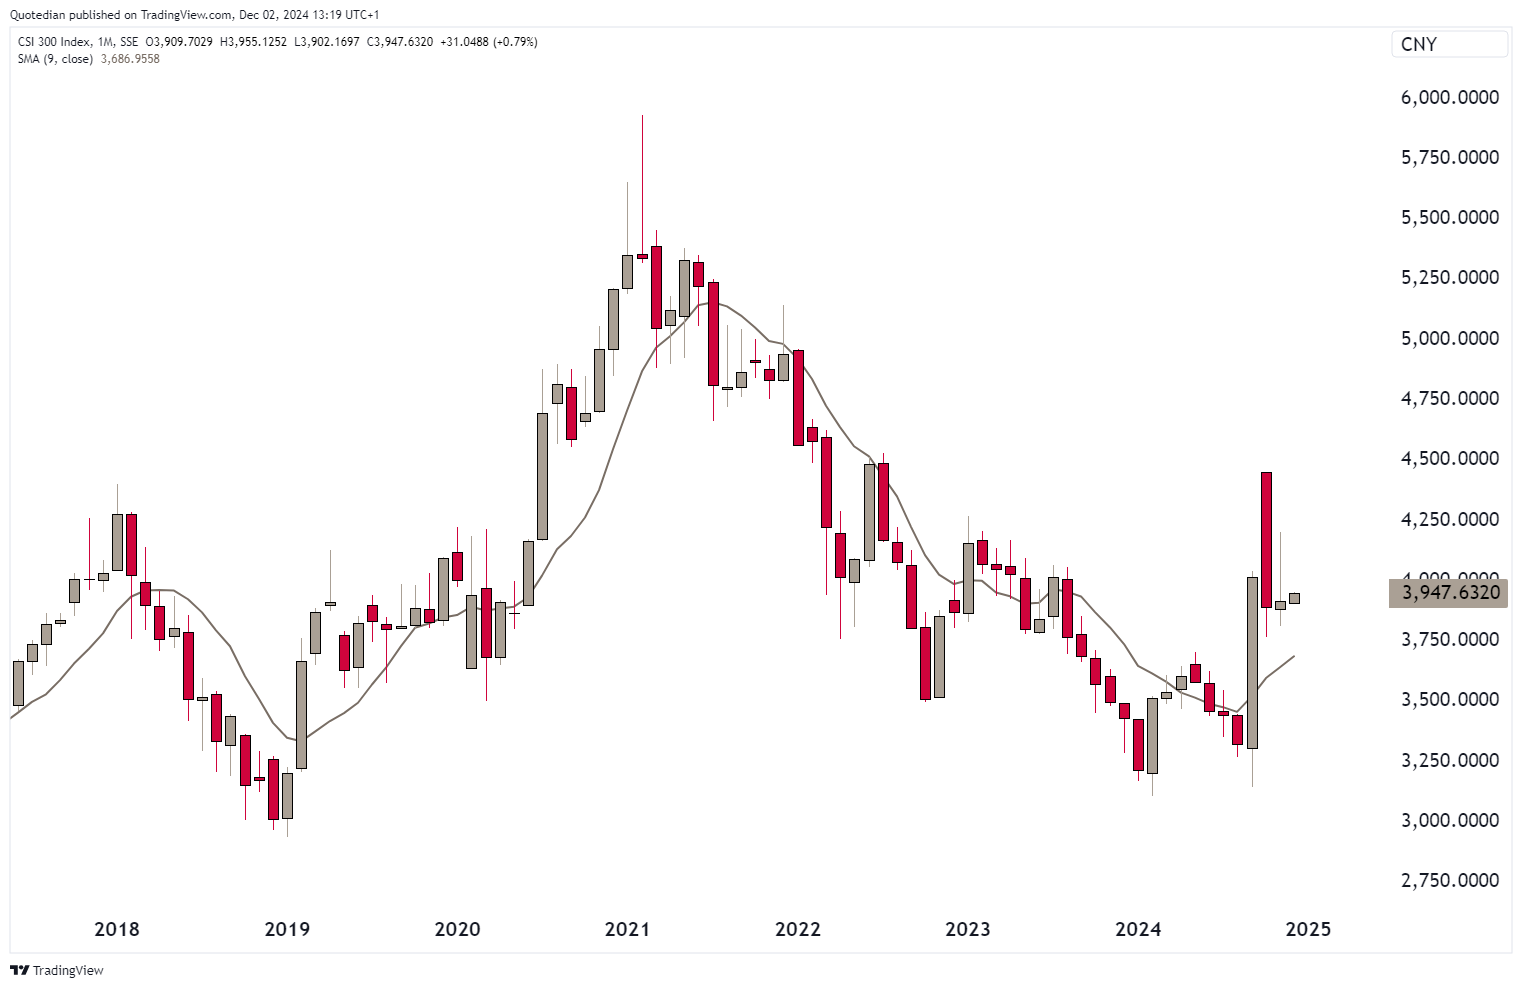
China mainland stocks (CSI300) surprisingly enough, given the Trump win, fared substantially better (+1%) than HK:
And last but not least, the Dubai Financial Market General (DFMG) index is approaching its 2014/2015 highs (which are not ATHs):

In terms of sector performance on a global level, financials did best and materials and health care stocks were the laggards:

However, the financial outperformance was yet another “tale of two cities”:
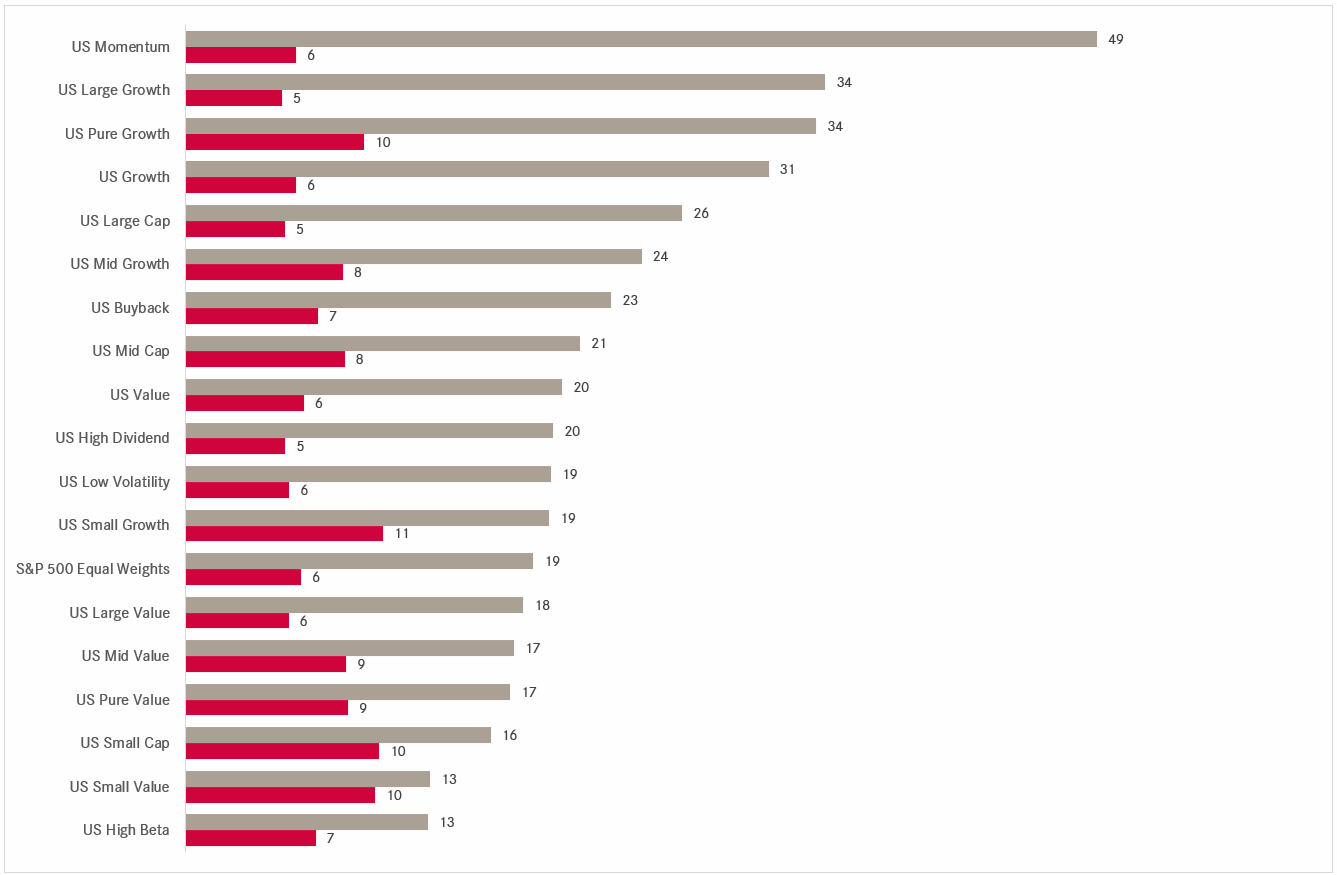
In terms of factor performance, (US) small cap growth was THE place to be, but small and mid cap work very good in kind of construct:

Time to turn our attention to the fixed income/rates space, where bonds did not have a bad November at all:

But just like geographical and/or sector allocation played an important role, bond markets are not all the same too. For example, allocating two the major bond treasury markets (US and EU) gave different outcomes in local currency terms:

Or, even within market, it was important to choose the right duration

and credit mix:

But, hey, we’re here for the monthly charts!! Here’s the US 10-year treasury yield:

For now, at least on this monthly chart, yields continue to be in a downtrend as defined by lower lows and lower highs. The break of 4.25% should take yields down to at least 4% as I highlighted last week.
Again, a lot of confluents are impacting yields at the moment, many of them directly opposing (e.g. Treasury nominnee Bessent’s call for fiscal discipline versus Government spending plans), so it is important to keep Paul Saffo’s concept in mind:
Strong convictions, loosely held
European yields, as proxied by the German 10-year Bund, seem on the verge of breaking lower:

Will the break be triggered by the ECB’s interest rate cut next week?

And staying in Europe for one more chart, I sarcastically would observe that the European Union has started to work for France, which now has no more discount to (P)IGS:

Credit spreads continue to be nose-bleedingly tight and the latest SLOOS did not “help” to widen them, i.e. conditions are continued to be loosened by credit officers (somebody please tell mine!):

Hence, as expressed in our quarterly outlook, our view to continue overweight HY bonds is validated, as further money is likely to flow into that asset class. Kinda, TINA for bonds…

November, also unsurprisingly in the light of the US election results, has been unanimously strong for the US Dollar:

Unanimously? Well, not entirely!

The Yen bucked the trend and actually closed stronger on the month, and not only against the US Dollar, but obviously versus all other previously listed currencies too.
What is going on here? I have a suspicion...

We all know that the US (used in collective, but non-all inclusive form) blames China (and others) of currency manipulation. I.e., they (collective, non-inclusive again) think that China weakens its currency on purpose to be more competitive.
Well, if that is true, what will they (collective, non-inclusive) think if they see the following chart?


Exactly!
Here’s the USD/JPY monthly chart then:

I think the currency is on its way to 130 and below and we will hear a lot about U.S.-Japan relations next year …
Despite this mornings (2-Dec) strength in the US Dollar on the back of Trump warning over the weekend the so-called BRICS countries he would require a commitment that they wouldn’t create a new currency as an alternative to using the greenback, and repeated threats to levy a 100% tariff on them if they did, I think the currency is closer to a top now. Here’s the Dollar Index (DXY):

And for completeness purposes, here’s the monthly candlechart for the EUR/USD cross:
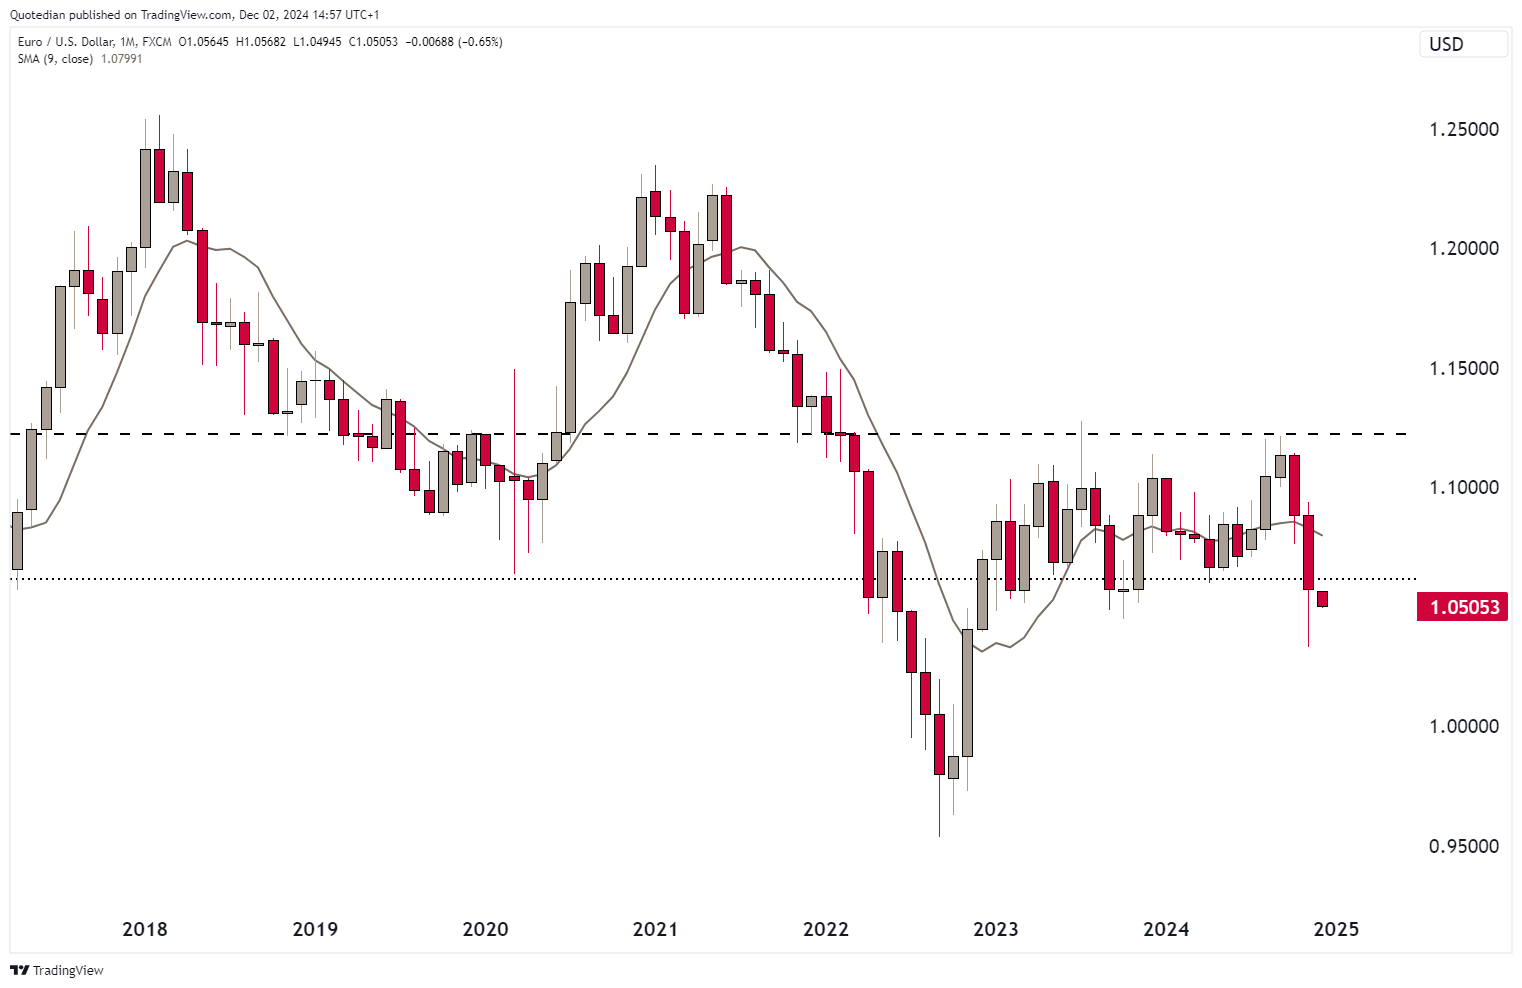
Support seems to have been broken this morning (the last candle is already December), but given the French mess and a possible resolve this week, I would not jump and short this currency pair further just now.
Of course, we also need to speak crypto, where all majors were up in November, given the sudden love found by Mr Trump:

And, also of course, having Mr Doge (aka Elon Musk) in the cabinet, will also help cryptos.
Here’s the monthly chart of Bitcoin, the one crypto to rule them all:
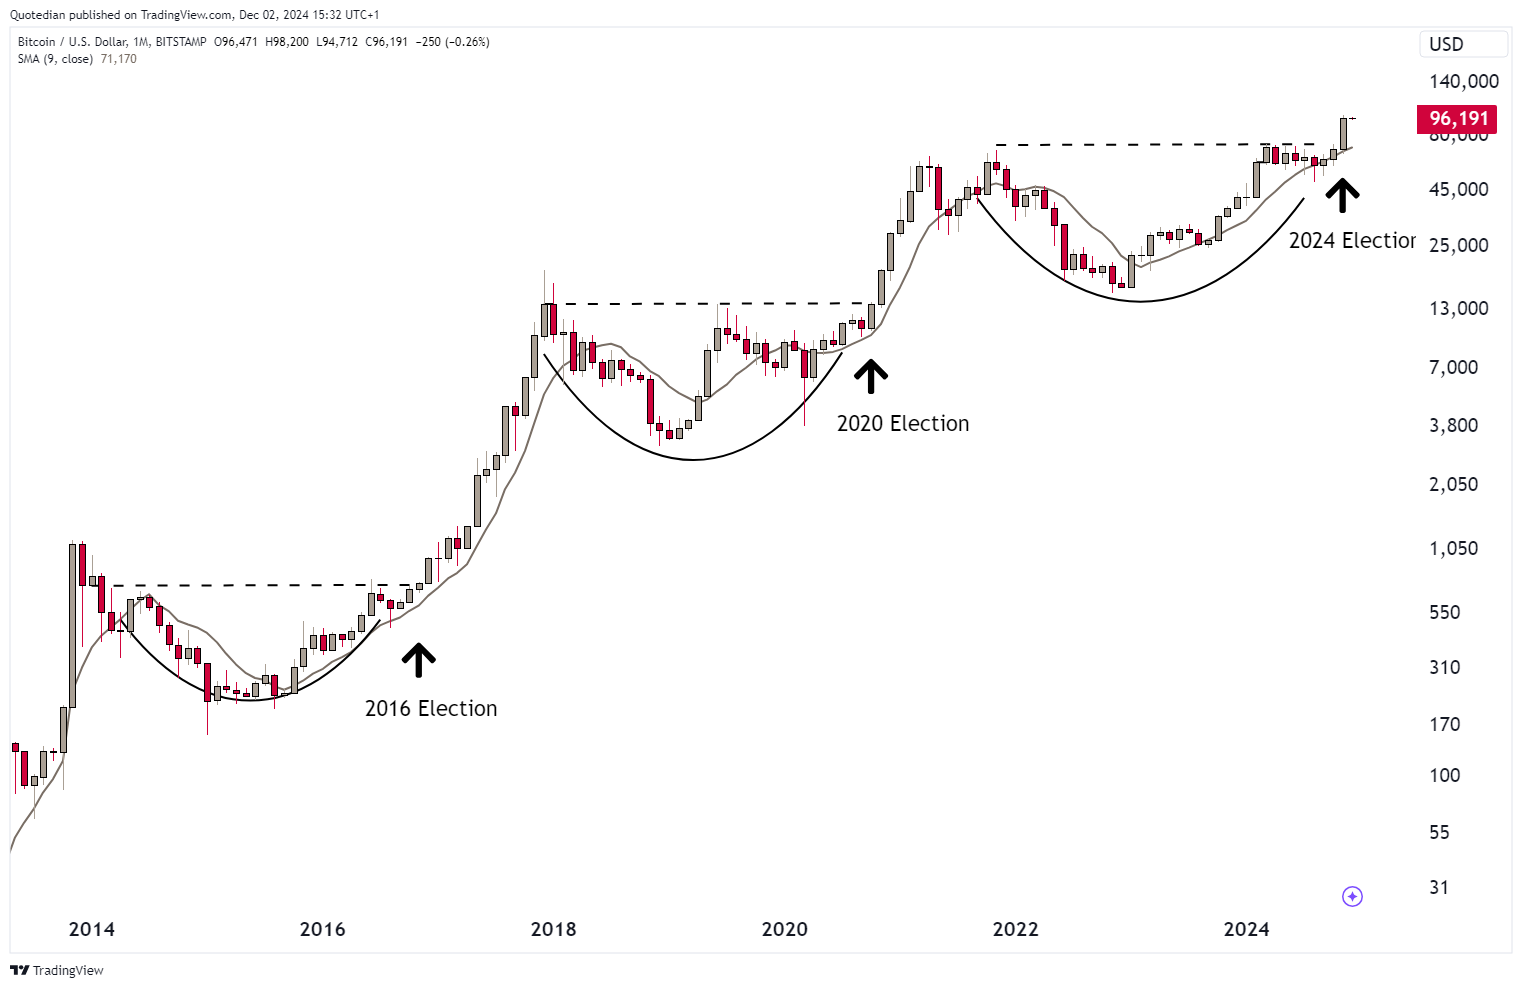
The post-election rally would have, according to this chart, only just begun …
But, in case the 42% 10-day volatility on Bitcoin is not enough for you, you could alterantively buy MicroStrategy Inc (MSTR) at a vola of 166%, or even better, the 3x leverage ETF on MSTR (MST3) for a roughly 400% 10-day vola…


To finish, just quickly the performances of the different commodity segments, where we observe a reversal of fortunes in precious metals in November:

Softs (coffee, cocoa, cotton, sugar, orange juice) on the other hand saw a reversal decent rally in November, adding to already ‘saucy’ returns.
Individual commodity futures look as follows:

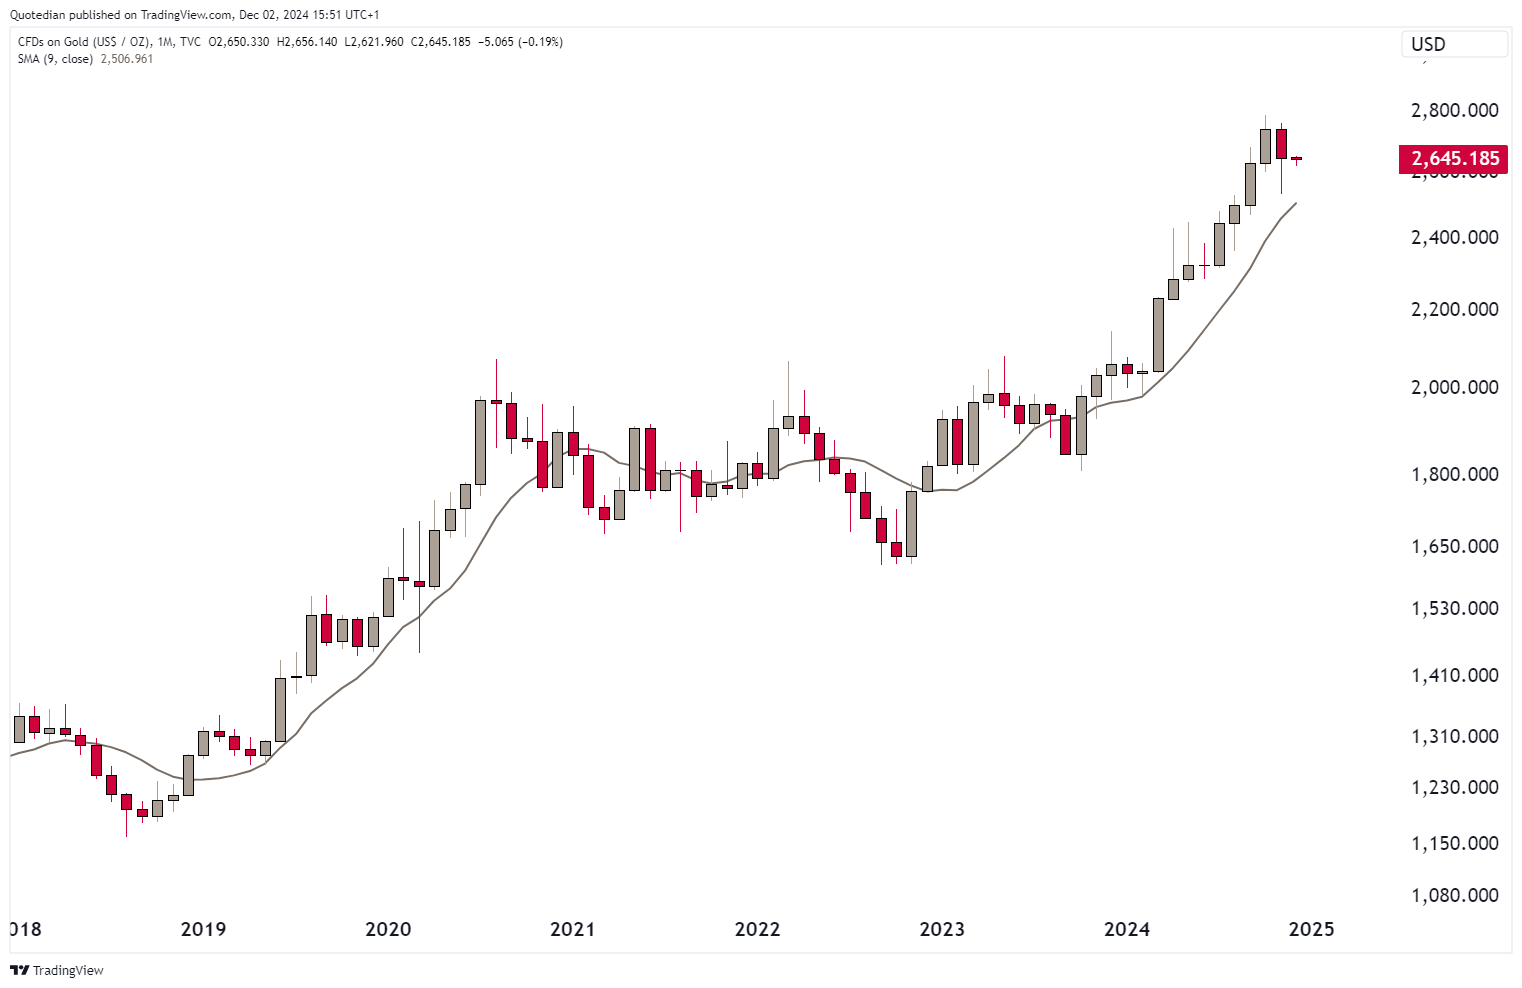
Gold got hit, post US elections, but was able to find a bid mid-month to end well above the intramonth low of $2,536:
The “drill, baby drill” gave some additional downside pressure on oil prices. Here’s Brent:

Natural gas made a run on the 3.60 resistance, but was defeated and sent back to the trenches:

Time to hit the send button!
Your finfluencer,
André

Everything in this document is for educational purposes only (FEPO)
Nothing in this document should be considered investment advice
Investing real money can be costly; don’t do stupid shit
The views expressed in this document may differ from the views published by Neue Private Bank AG
Past performance is hopefully no indication of future performance