100K Magic
Vol VII, Issue 43 | Powered by NPB Neue Privat Bank AG
“Debt means you had more fun than you were supposed to”
— Greg Fitzsimmons
Bitcoin’s print all-time high is 99,860 (Coinbase), just shy $140 of 100,000. Since then, the cryptocurrency has retreated close to four percent. Is the 100k level magic that this cryptocurrency will never reach?
Bollocks.
But, it is interesting to note that round numbers have an importance for Bitcoin now, which means that more and more investors are involved and psychology (aka Technical Analysis) suddenly play an important role.
With that having been said, and, without further ado, let’s dive right in …
This week we will try to spend a bit less time on equities, as actually not a lot has changed. We are still within the boundaries of ranges, pending a breakout on either side.
Point in case, the S&P 500:
Less than a percent to go to confirm a breakout to the upside.
My preference is still for a more complex correction to the downside, as sentiment continues to be uber-bullish. E.g., the expectation for higher stock market ahead as measured by the Conference Board Consumer survey continues at its highest level since … ever !
Also, a lot of credit is being given to the coming Marmite 2.0 (you either love it him or hate it him) era, however, the starting point for markets is quite different than in 2016:
As you well know, I have a slight (LOL) tendency to the bullish side, but above all, we Quotedian readers, are firm believers in:
“Price Rules”
Hence, a break above the previous ATH on the S&P 500 will mean we increase our risk exposure again.
In that context, we also note that the S&P 500 equal-weight index (here via the RSP ETF) has already closed at a new all-time high on Friday:
Maybe small cap stocks would be a good area to look for more exposure on such break, as the chart just left us with a perfect previous-resistance-turns-into-support pattern:
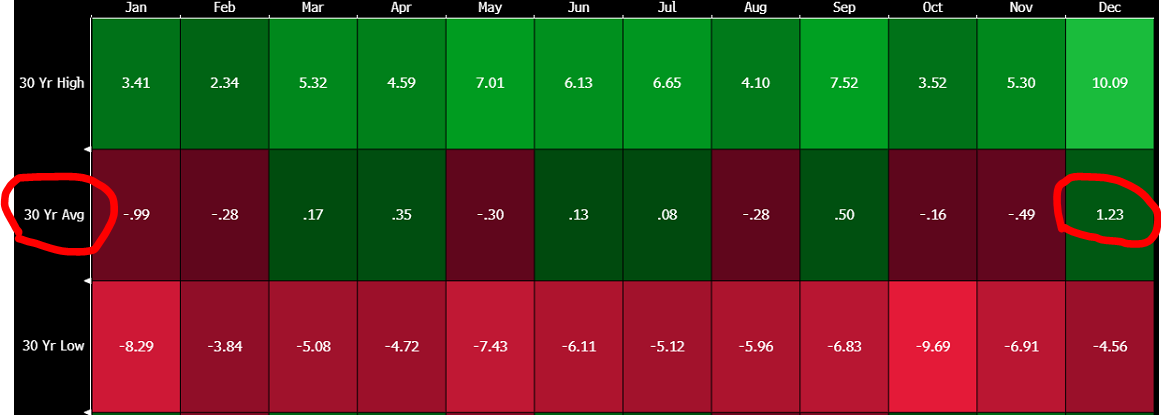
And as the following chart of the ratio between small cap (Russell 2000) and large cap (Russell 1000) stocks shows, seasonality is also pretty good in December for small caps, followed by flattish January, followed by another friendly February:
Ok, let’s hop over to European markets, taking the perspective of an international, USD-thinking investor. Here’s the chart he/she/it sorry, wrong order she/it/he is looking at:
Would you buy or sell this chart?
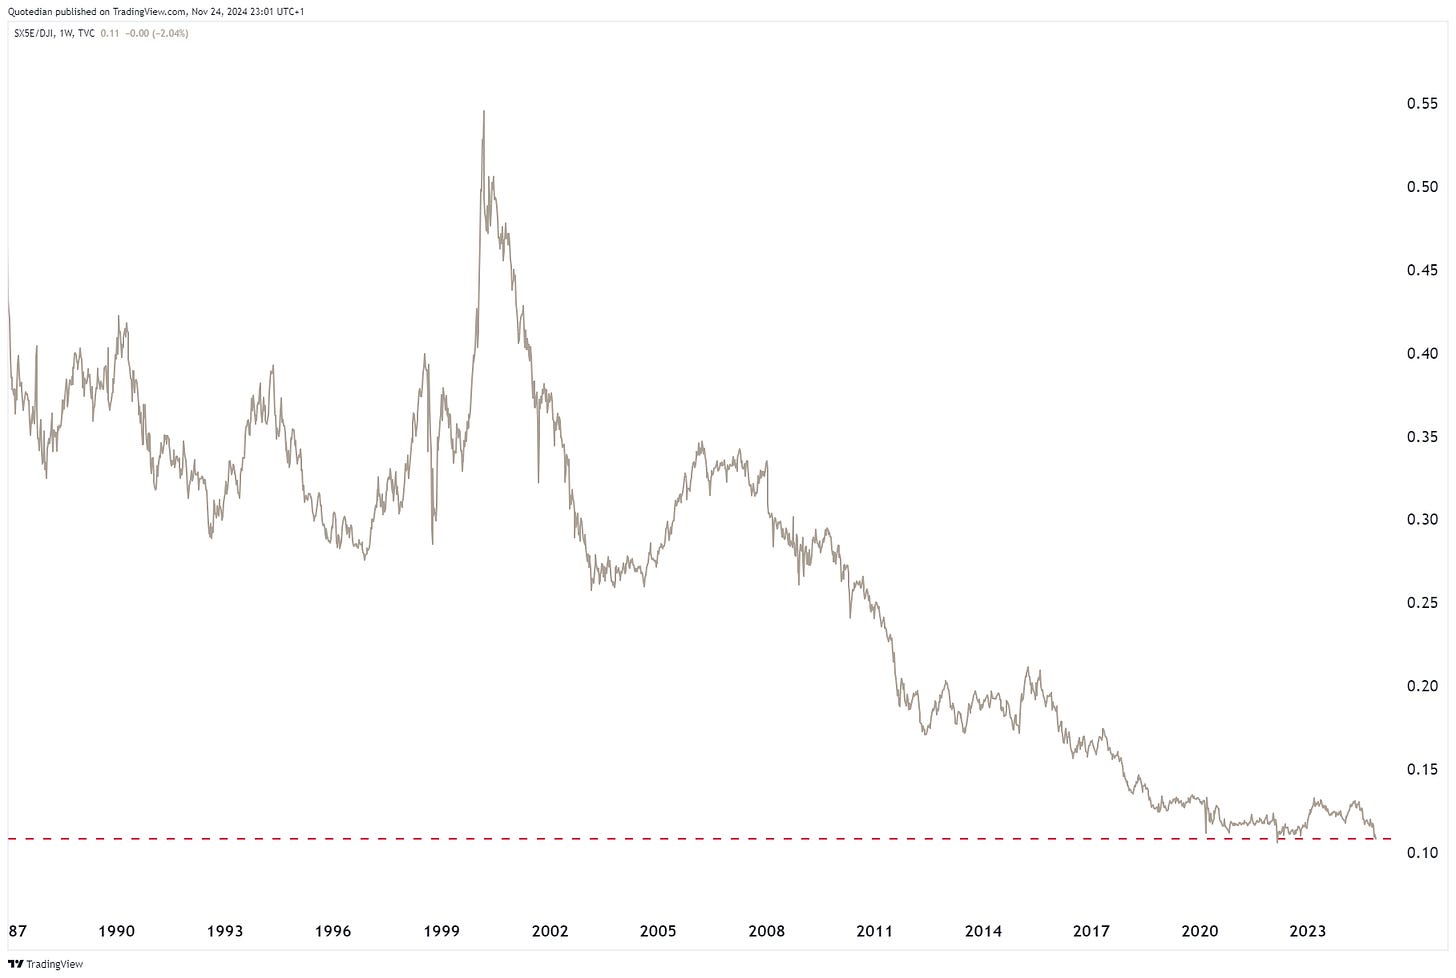
Maybe the previous chart is slightly unfair, given the relative (sad) track record of European equities versus their US cousins. Having said that, and comparing two “comparable” (pun intended), the STOXX 50 and the DJ Industrial,
a further breakdown seems imminent.
This is the more brutal way to look at the chart above:
In absolute and Euro terms, the STOXX 600 does actually not look that bad, as it has put in three solid up candles over the past three session, rebounding from key support:
In Switzerland, the SMI got a “second” chance, rebounding from an important support level too, albeit 11,100 from our shoulder-head-shoulder top is still the other, less constructive outcome:
Rebounding above 11,800 would strongly reduce the danger of that second, more dire scenario.
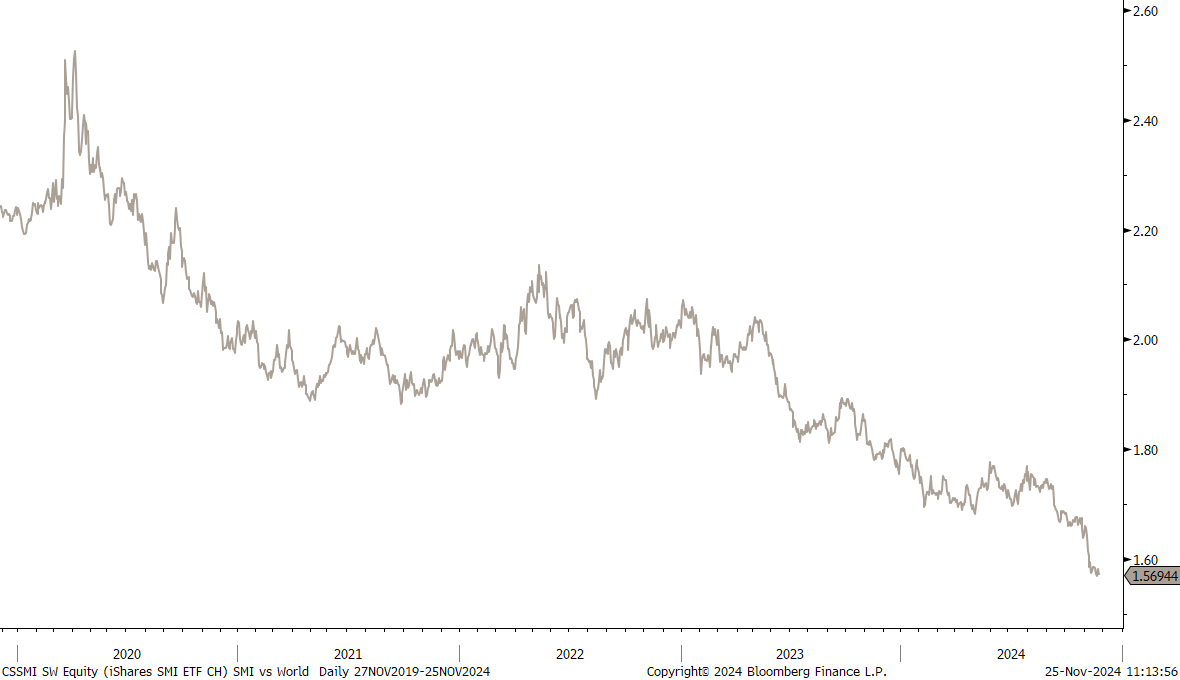
However, on a relative basis, investing in the Swiss market has not been the best of value propositions over the past years:
Even taking out the mighty US market does not make the Swiss equity market look much better:
Switzerland’s underperformance may make sense if we look at our aReS™ Global Sector model:
Given the low ranking of defensive sectors and taking into account that the SMI is a more defensive leaning index, with heavy-weights in the health care (Novartis, Roche) and consumer staples (Nestle) sectors, it all starts making sense.
In Asia, India’s BSE500 reached quite precisely our price target from the shoulder-head-shoulder pattern setup (see arrows) and is rebounding nicely from there now:
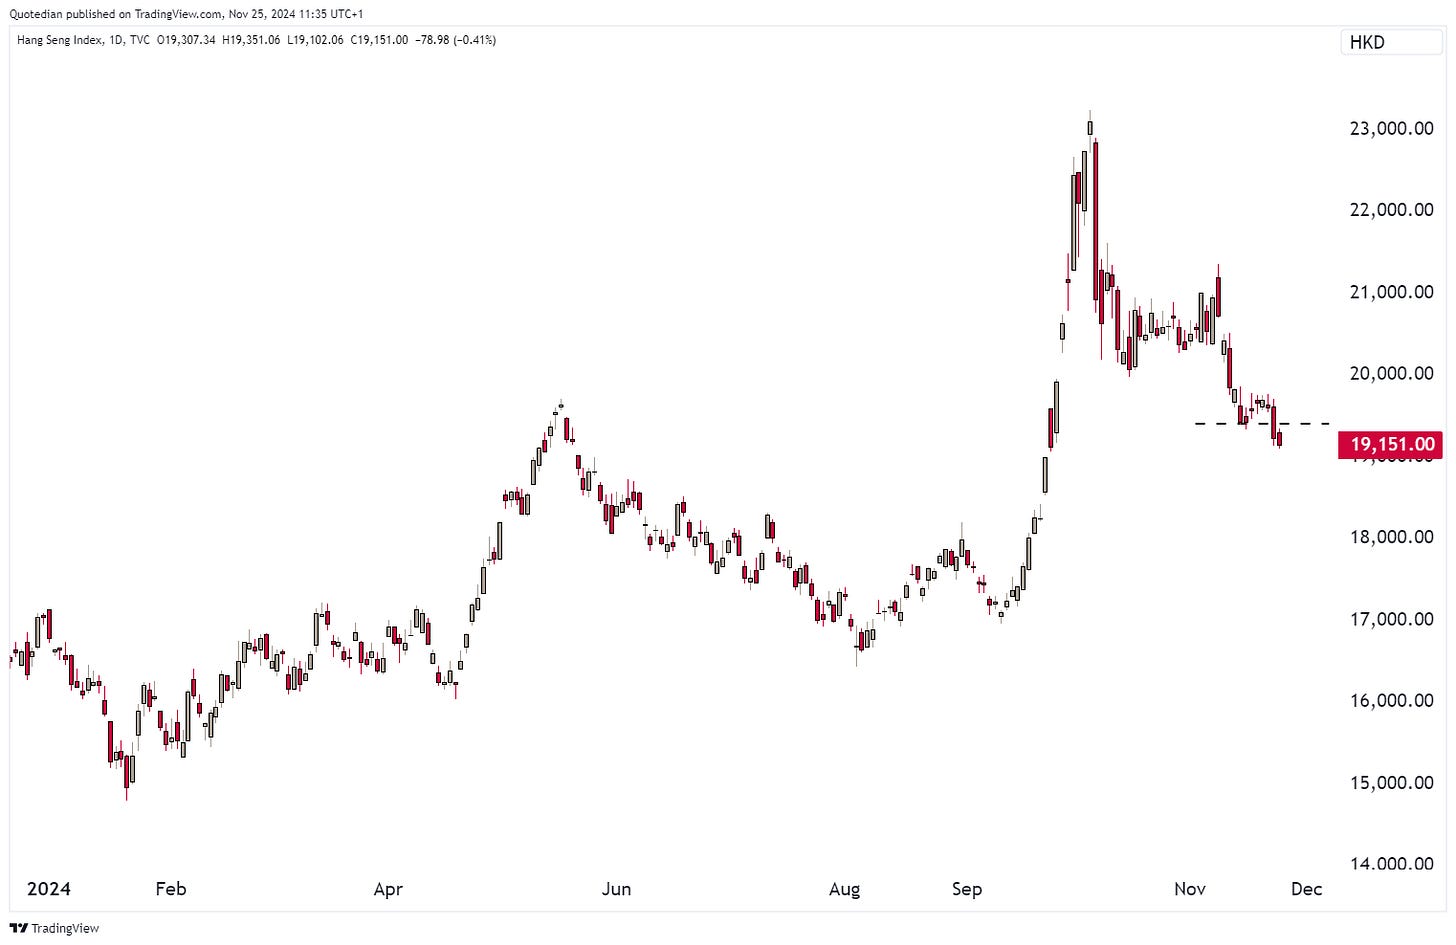
The Chinese equity complex however is breaking down again. Here’s Hong Kong’s Hang Seng index:
And here the CSI300 mainland index:
Japan’s Nikkei has been consolidating for nearly a year now - I think it could be ready to move higher again. Accumulate above 37,000 (red dashed line) and go aggressive upon a break above 40k (black dashed lines):
Time to look at our list of best performing stocks in 2024 and how they have done over the past week. Starting with the US:
Nearly all 25 stocks added to their already impressive gains over the past five sessions, partially meaningful so.
Interestingly enough, number three ranked stock Nvidia must for sure be one of the best performers, say over the past seven years with over 2,400% upside:
Well, NO!!
Nasdaq-listed MicroStrategy Inc (MSTR), kind of a leveraged play on Bitcoin, has done even better:
Amazing, isn’t it?
Now here to the European list of 2024 top performers:
A bit more of a mixed picture, but still more stocks have added to their gains than not.
On the rates side, the probably most important factor for the coming weeks has been the election of Scott Bessent as new US Treasury Secretary. Prior to his appointment, yields between US (grey), Europe (red) and the UK (dark grey) started to diverge:
Only this morning, after the Bessent announcement, did US yields drop and catch-up with its European/UK cousins. Bessent, a hedge fund manager by trade, is considered a fiscal hawk, hence the pressure on yields.
Hence, drawing that thicker line (remember last week?) on the US 10-year yield chart seems to have paid off for now:
This is the new chart we are looking at now:
And zooming in, we note that should 4.26% give, a possible target is just above the 4%-handle:
This potential for lower yields is likely to be very welcome by prospect homebuyers, as the 30-year fixed mortgage rate had climbed well above 7% again:
German yields, as a proxy for Europe, are already on their way lower:
The Round 2% number is also a possible (first) target here.
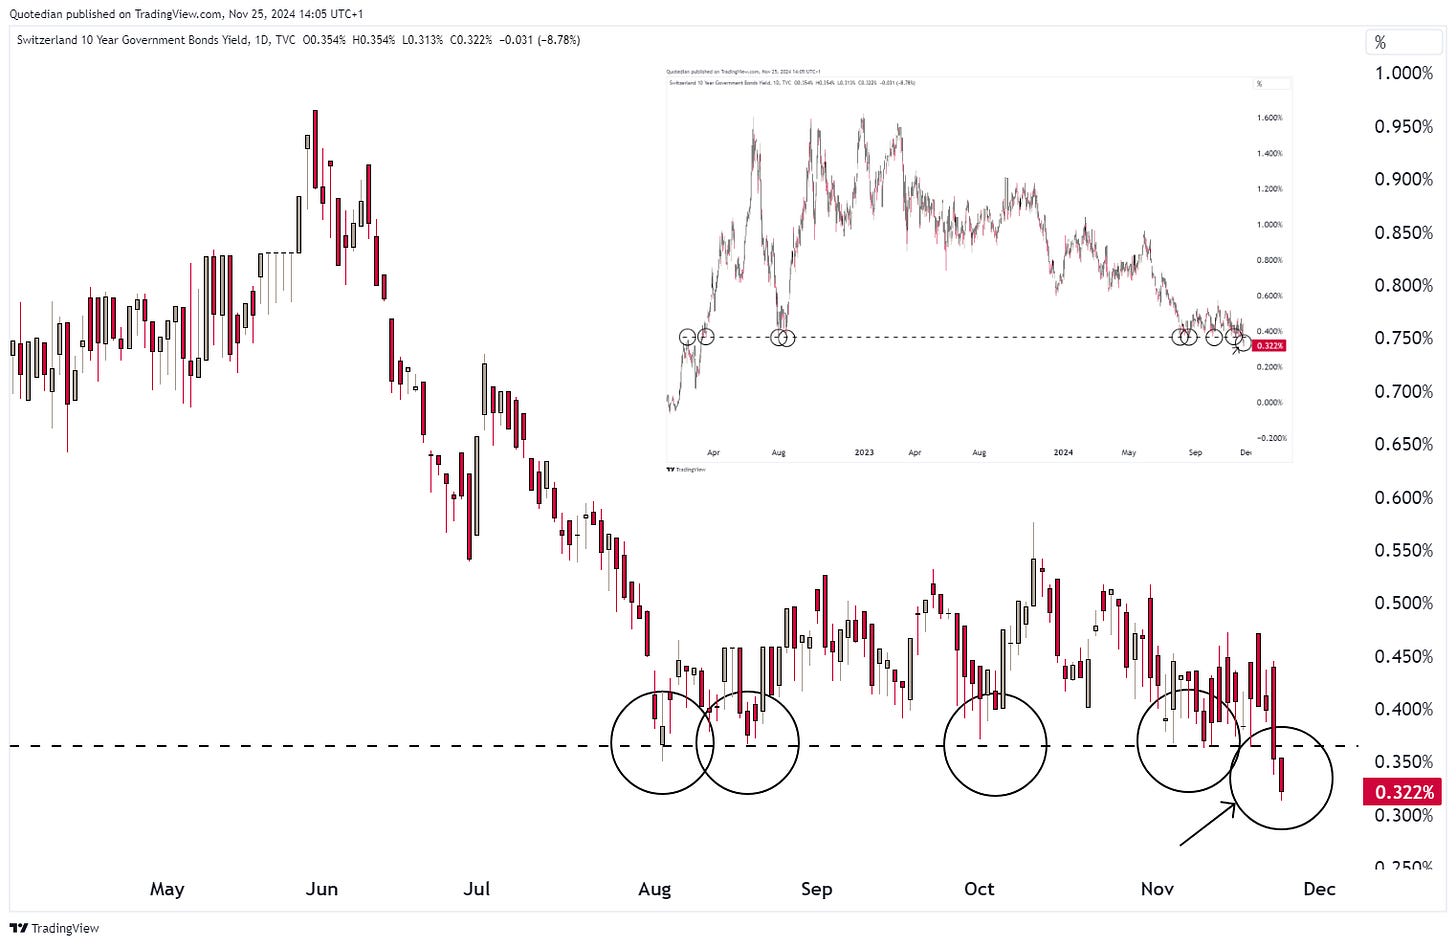
Swiss yields at the long-end are gone:
Credit spreads continue to narrow in the US in both segments, IG and HY, but have widened a tad in Europe:
Over in the FX realm, the nomination of Scott Bessent can also have an impact. Whilst Bessent is a defender of the US Dollar as THE reserve currency, he is smart enough not to necessarily propose a STRONG reserve currency. The Dollar Index (DXY) has hence weakened by about a percent since Friday’s highs:
This Greenback “pullback” has been across the board:
However, the EUR/USD cross has still some work to do to improve the technical picture:
Reclaiming 1.06 would be a major success, maybe December’s positive seasonality on the EUR/USD will help (before January and February hit back):
Here’s another way to look at that positive EUR/USD December seasonality:
Of course I am talking my book a bit as I have been wrong for the past seven big figures, but even the incoming Commander-in-chief knows the perils of a too strong USD
And then we need to talk Bitcoin again, of course. Since writing the introduction to this week’s letter some 24 hours ago, the cryptocurrency has still not quite reached that 100k Magic:
I think it continues to be question of when, not if. What happens thereafter, IDK.
BTW, here’s the video of that great Bruno Mars song I deviated this week’s title from:
Finally, in the commodity department, Gold has been thrown a stick into its recovery rally, as yet another knee-jerk reaction to the incoming Treasury secretary’s “fiscal awareness” is to sell Gold:
Silver, which never saw the same recovery as the price of Gold, is at danger of dropping back to $27 should $30 give:
Oil hasn’t really moved and continues to be range bound (not shown) between $66 and $72 (WTI).
Natural gas got me all excited last week, as a break above key resistance at 3.60 seemed a done deal, however, price got rejected at precisely that level:
Time to hit the send button - have a great week!
Everything in this document is for educational purposes only (FEPO)
Nothing in this document should be considered investment advice
Investing real money can be costly; don’t do stupid shit
The views expressed in this document may differ from the views published by Neue Private Bank AG
Past performance is hopefully no indication of future performance


