Reboot
The Quotedian - Vol VI, Issue 57 | Powered by NPB Neue Privat Bank AG
"Good advice is always certain to be ignored, but that's no reason not to give it."
— Agatha Christie
DASHBOARD
AGENDA
CROSS-ASSET DELIBERATIONS
With August just passing its nadir and many of us flocking back to our offices, it seems a good time to end the summer recess of The Quotedian and get us all back on track with what has been going on.
Therefore, it may happen that this particular issue will have even more charts than usual and focuses a bit less on the session just gone by, just to reboot us all and bring us up to speed. Hence,
HERE WE GO AGAIN!
Starting with equities and remembering the last Quotedian before my much too short holiday, titled “My Holiday, Your Problem”, we discussed how markets tend to go pear-shaped during the summer months.
And indeed, once again, that observation was spot on. In the first few days of me being a beach bum, the VIX increased by 30% bottom to intra-month high:
In the short time span since the beginning of this month, we had several events of potentially elevated impact on the macro landscape:
Bank of Japan (BoJ) announced the widening of the span for the 10-year JGB yield. This is far more than just symbolic, as it is the beginning of the end to YCC (yield curve control)
Fitch downgraded US credit rating to AA+
Treasury boss Yellen announced an increase in speed and amount of bond issuance
All this has put upside pressure on yields and, for once correctly, the bond-dog is waging the equity-tail.
And the August ‘fun’ does not end here … Argentina heading towards default (again), Russia rising interest rates to support plunging currency, China’s economic slowdown to a deflationary pace, etc, etc, etc…. It’s all fun and games, until …
In terms of month-to-date market performance, this then translates to this:
This is what happens in “Hurricane Season” … Let’s look at some charts of benchmark indices around the globe now.
The S&P 500 bellwether index is playing with fire at the lower support of its uptrend channel in place since March of this year:
The risk level to the uptrend in the Nasdaq seems to lay around 14,700, which is some three percent from the current level:
US small-cap stocks (Russell 2000) continue to remain range bound:
Hopping over to our side of the pond, we note European stocks have been “much ado about nothing” since late January:
Whilst some regional indices like the DAX or the CAC40 have done pretty well this year, others such as UK’s FTSE-100 index have been a drag to European equity performance:
Over in Asia, Japanese stocks have entered a two-months consolidation period, but prospects remain bright and a break above resistance here could mean another 15-20% upside according to the Technical Analysis playbook:
Quite “au contraire” Chinese stocks (CSI300) seem unable to get their act together, and today’s medium-term facility rate cut of 15 bps was definitely not enough to make investors more confident:
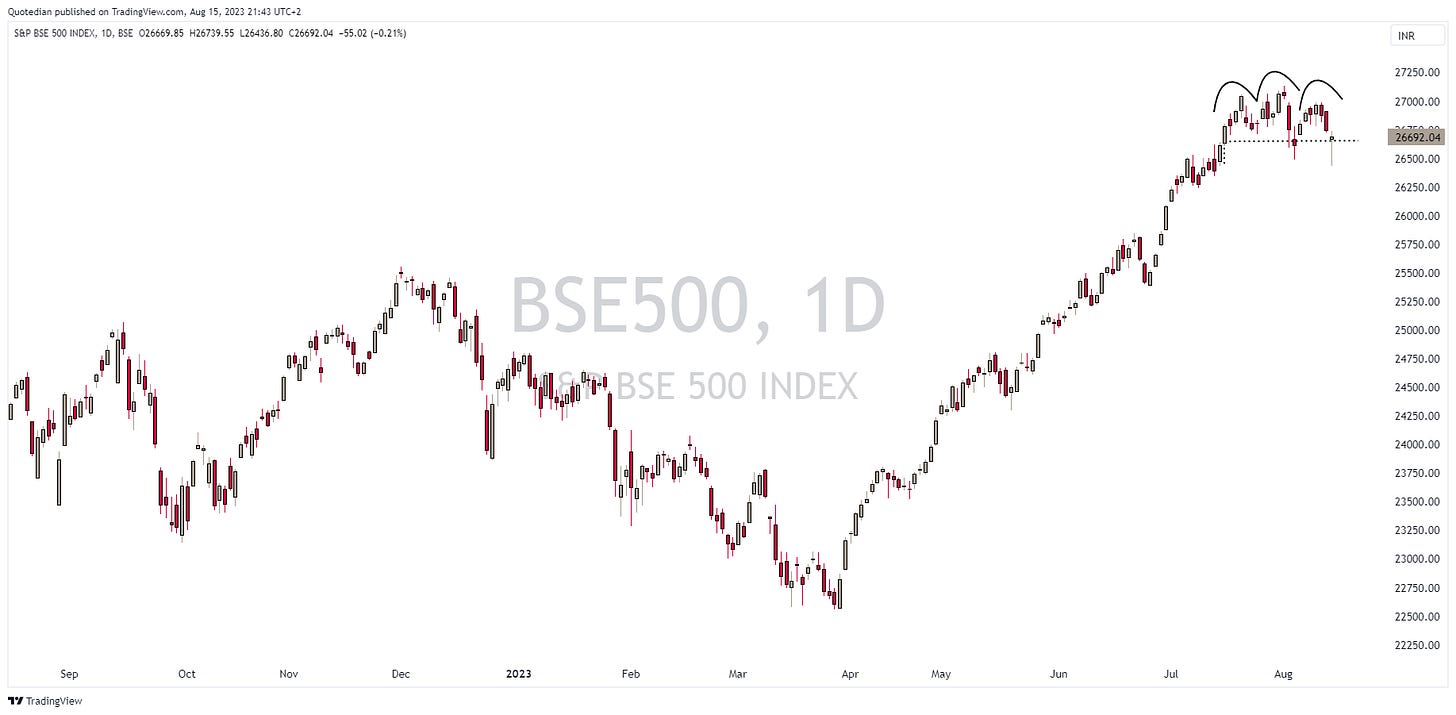
And finally, Indian stocks continue to hover close to all-time highs (ATH), albeit there is a certain risk of a short-term shoulder-head-shoulder reversal pattern developing:
Just before we have a quick look at month-to-date (MTD) equity sector performance, a quick update on today’s (15.8.) session, which is coming to an end in New York as I am typing.
Stocks on Wall Street ended on a decisively negative note, with a downward acceleration in the last trading hour, before some very last-minute bargain hunting set in
Breadth was very weak, with no sector showing positive performance and only one stock advancing on the day for every ten stocks declining. This left us with this rather “reddish” market carpet for the S&P 500:
Asian stocks this morning are continuing with the template given to them by US stocks are down in the region of about one percent:
And European index futures suggest a rocky start to our session too, once cash trading opens at 9 am CET.
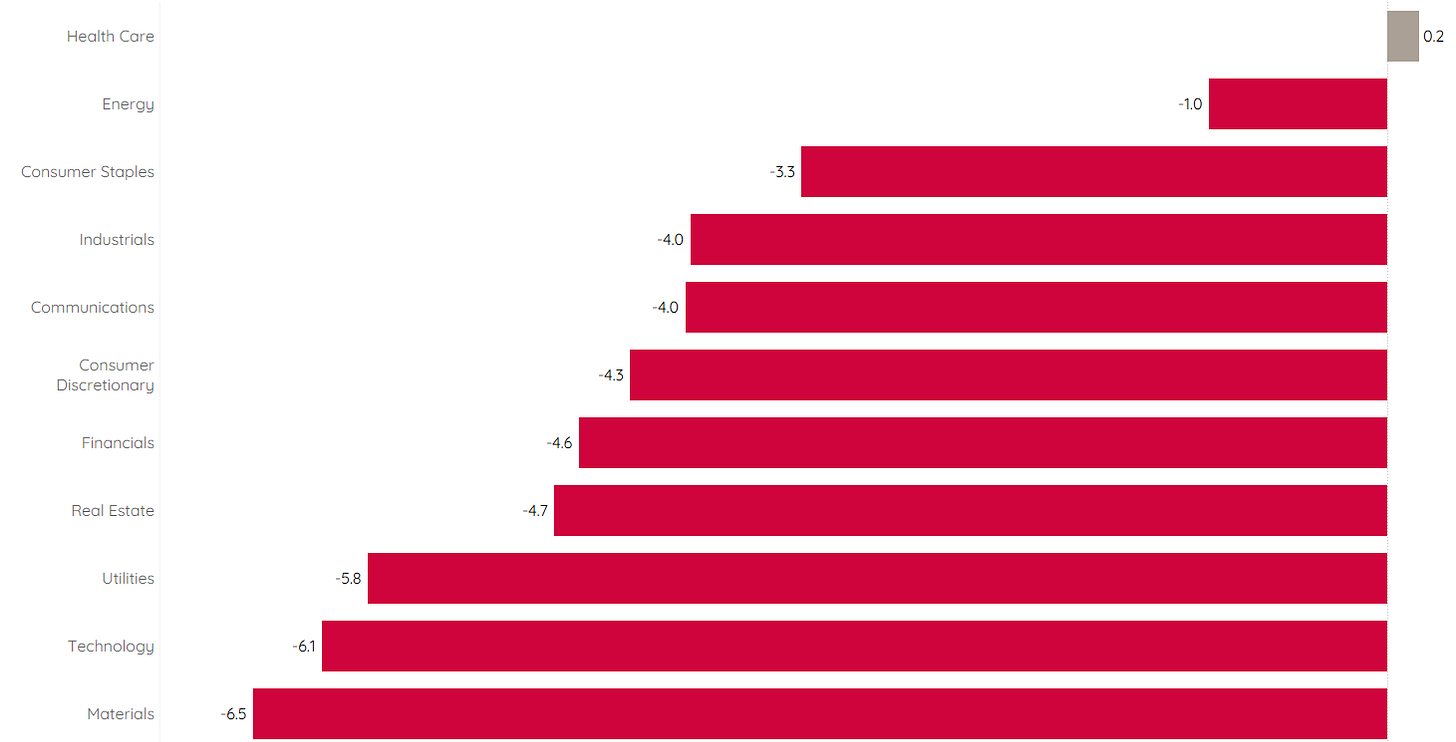
And now just briefly to the promised sector performance so far this month, which shows that only healthcare stocks have provided some shelter so far in August:
One of the more intriguing pair trades I have on my mind right now is long energy and short tech stocks, but I will revert to this later this week.
Time to turn to fixed-income markets where global yields seem ready for their next leg up and are wreaking havoc amongst bond prices.
But first a quick update on inflation, where the US CPI number was reported last week and was rather a non-event, despite the slight (expected) pick-up in the MoM number. This reminded me of this chart I showed you in “(Now) You Are Here” about three weeks ago:
I hate to use two y-axes on the same chart, which is also known as chart crime, but in this case, the following chart improves visually the message from the above chart:
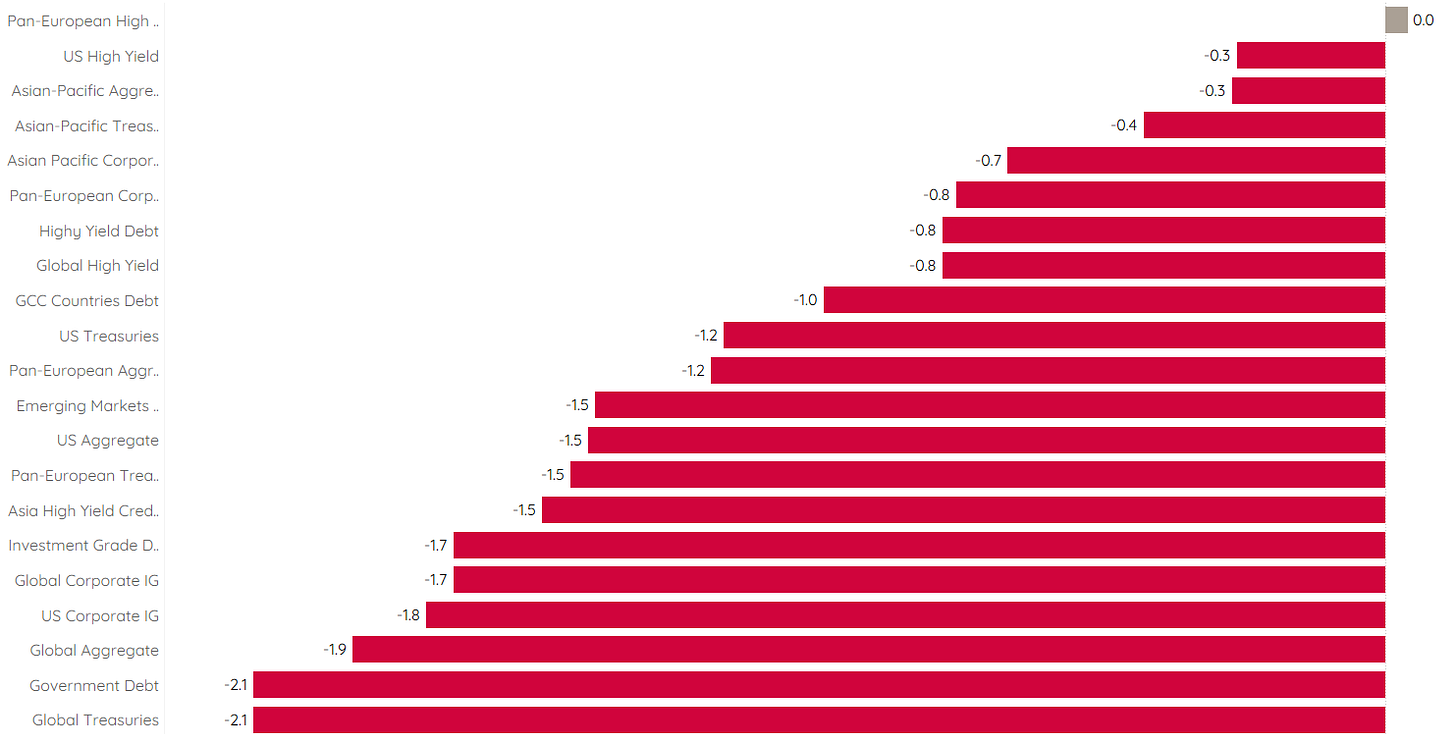
Back to current bond markets, which provide this performance picture for the month so far:
So, August is turning into a mini-2022, where there’s nowhere to hide neither in equities nor bonds …
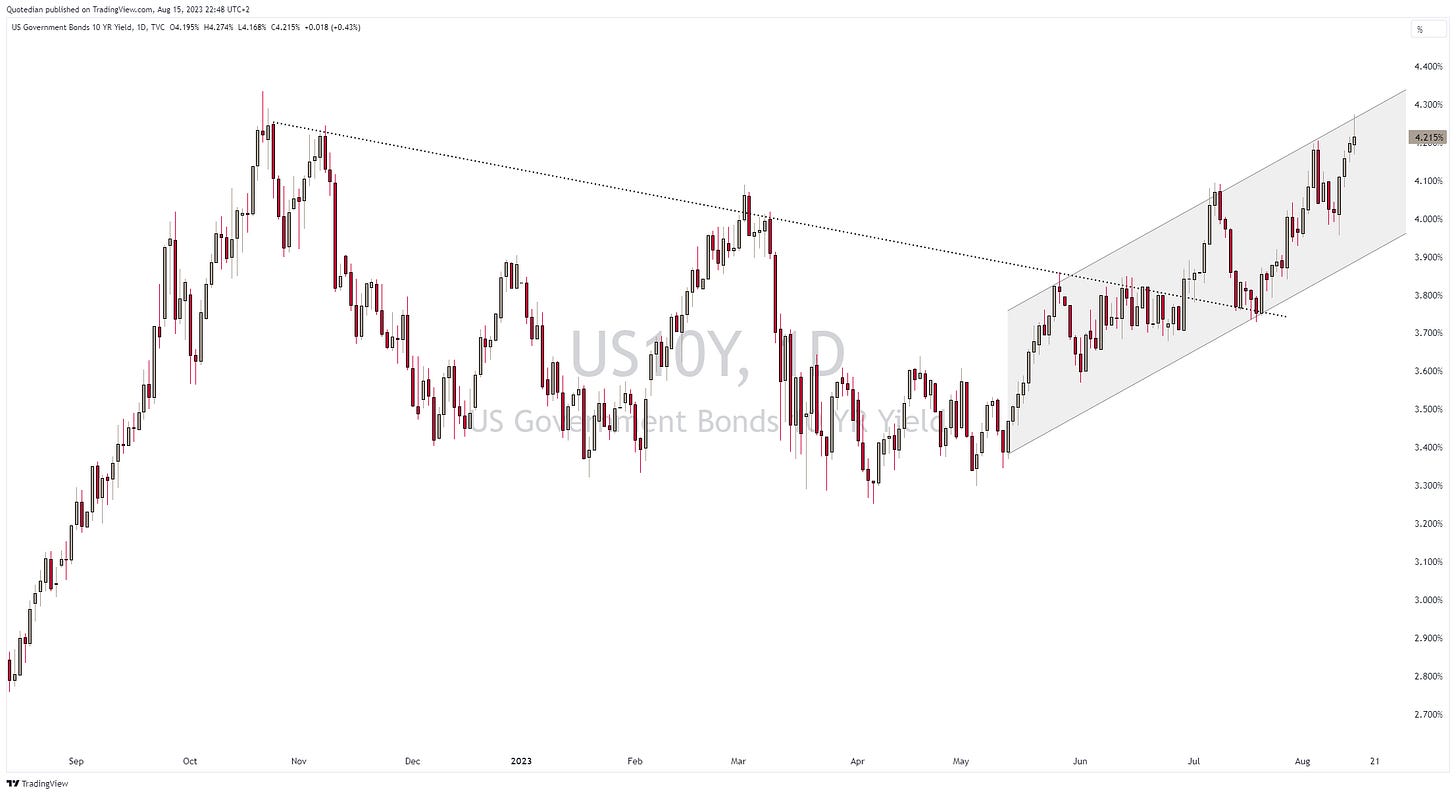
Let’s put those yield advances into pictures … to start, here’s the US 10-year Treasury yield:
The consolidation period is over and the series of higher highs and higher lows since May tell us we are in an uptrend (downtrend) for yields (prices). Technical analysis rule gives a minimum price target of 5% after this break higher …
Again, it is important to keep the long-term version of this chart in mind, just to keep perspective on where yields came from as they dropped to zero over the past four decades:
The still inverted yield curve (10y-2y) has been steepening over the past weeks, but unfortunately in the form of a bear steepener and not a bull steepener:
In Europe, yields (proxied via German Bund yields) have not broken out as clearly as their US counterparts yet, but are also knocking on resistance levels:
The picture is similar for most other major economies, with the only exception probably being Chinese yields, where economic growth (outlook) seems to be negative, that 10-year government bond yields are closing in on the COVID-panic lows:
Again, the recent reacceleration of yields to the upside is IMHO due to several factors, including the BoJ decision, the Fitch downgrade and the increased issuance, as outlined at the top of this document. However, we must also be aware that Mr Market has constantly been revising upwards his inflation expectations. The chart below shows inflation expectations expressed via Forward 5y5y swap rates in the US (red) and Europe (grey):
Finally, and to end the fixed income section, we observe that credit spreads continue to trade annoyingly tight, despite the recent pick up in equity volatility and a rising bankruptcy count rate:
Turning to currency markets, the performance table quickly reveals that the US Dollar is having a good month versus all other major currencies, which would immediately raise the question if a “flight to quality” is underway:
Here’s the rise of the Greenback seen on the Dollar Index (DXY) chart:
A break above 103.20 here would be extremely constructive for the USD.
The Dollar Index is made up two-thirds by the Euro and the Japanese Yen, where especially the latter is responsible for the rise in the DXY:
In China, the PBoC announced a ‘surprise’ rate cut yesterday to support a weakening economy:
Despite that many consider this rate cut as “not enough”, the Chinese Renminbi (CNY) softened and now has fallen to levels where FX interventions are becoming more likely:
In Argentina, as mentioned in the introduction, the panic button is being hit:
Here’s the ARS (maybe the currency code is no coincidence…) versus the USD (inverted) using a normal scale,
and here using a log-scale,
as I cannot make up my mind about which of the two looks less depressing…
Last but not least, a quick glance at commodities, which have been on the move too. Starting with the big commodity ‘sectors’ we observe that only energy commos have been on the winning side in the first half of August:
Whilst I was expecting this energy advances, the strong negative performance in grains has taken me by surprise. I expected the worsening situation in Ukraine/Russia regarding Wheat & Co. to have a positive impact on prices. But, no …
Let’s have a more granular look at commodities by checking performances of some popular futures before we look at some individual charts:
I guess the good news is that if you like bacon, you have to dig less deep in your pocket…
To the frustration of all gold bugs, the yellow metal is not working as a successful investment, despite plenty of tailwinds (War, Inflation, Uncertainty, etc):
Oil (WTI) had a fantastic 25% run from late June, but could now be due for a deeper consolidation period:
Let’s finish off with Wheat, which only had a very brief escalation rally and has fully reversed course:
Ok, time to hit the send button. We are going back to (nearly) daily publishing, so future issues will be a bit more focused on the immediate happenings.
Hence, stay tuned …
André
P.S. And hit that ‘Like’ button below if you like.
CHART OF THE DAY
With so many charts to digest already, I do not want to burden you with yet another one. However, let me share this shocking infographic with you:
Thanks for reading The Quotedian! Subscribe for free to receive new posts the moment they are published.
DISCLAIMER
Everything in this document is for educational purposes only (FEPO)
Nothing in this document should be considered investment advice
The views expressed in this document may differ from the views published by Neue Private Bank AG
Past performance is hopefully no indication of future performance


