Seasonality Greetings
Vol VII, Issue 31 | Powered by NPB Neue Privat Bank AG
“I was seldom able to see an opportunity until it had ceased to be one…”
Mark Twain
In last Wednesday’s QuiCQ (click here), we showed several (5!) seasonal charts, all conveying a similar message:
September ain’t easy for equity investors!
Here’s yet another version:
And, in case you wondered, last week was week 36… So, if this thing is supposed to work like a Swiss clock, reduce risk during this week’s rally, before the 3-4 worst weeks of the year, during which you should reload for then end-of-year rally.
September started with a bang for equity markets, as had August. Here’s the S&P 500:
In Friday’s QuiCQ I wrote that a possible target for the S&P 500 was to fill the gap at 5,455, but it better hold there. Well, that gap indeed got closed … and then some!
The next immediate support now is 5,375 (dotted line), but truthfully, the real “must hold” level now is the August 5th low at 5,150 (dashed line), which by pure chance, or not, is also where the 200-day MA is coming in:
This chart picture is super-exciting, as its resolution will give us the ‘new’ trend for the next few weeks to come. Make sure to sign up to the QuiCQ (sign up here), in order to receive your daily update on this unfolding soap opera.
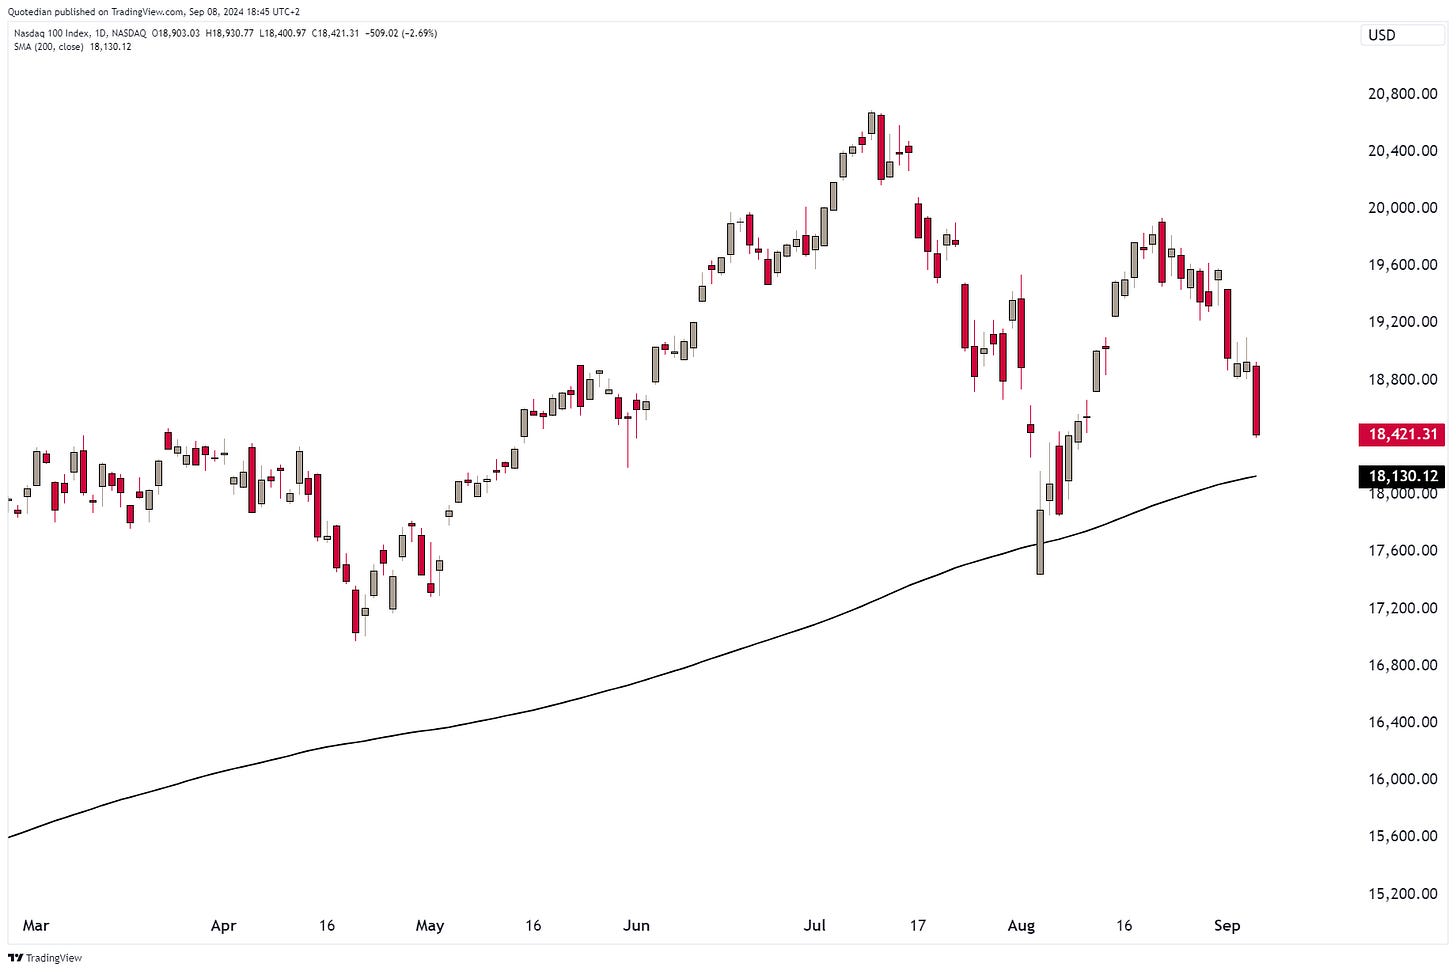
Whilst our last intention is to overly bearish here, the failure of the Nasdaq to reach the July highs, creating a negative divergence with the S&P 500, and its price proximity to the 200-day MA after Friday’s sell-off is worrisome:
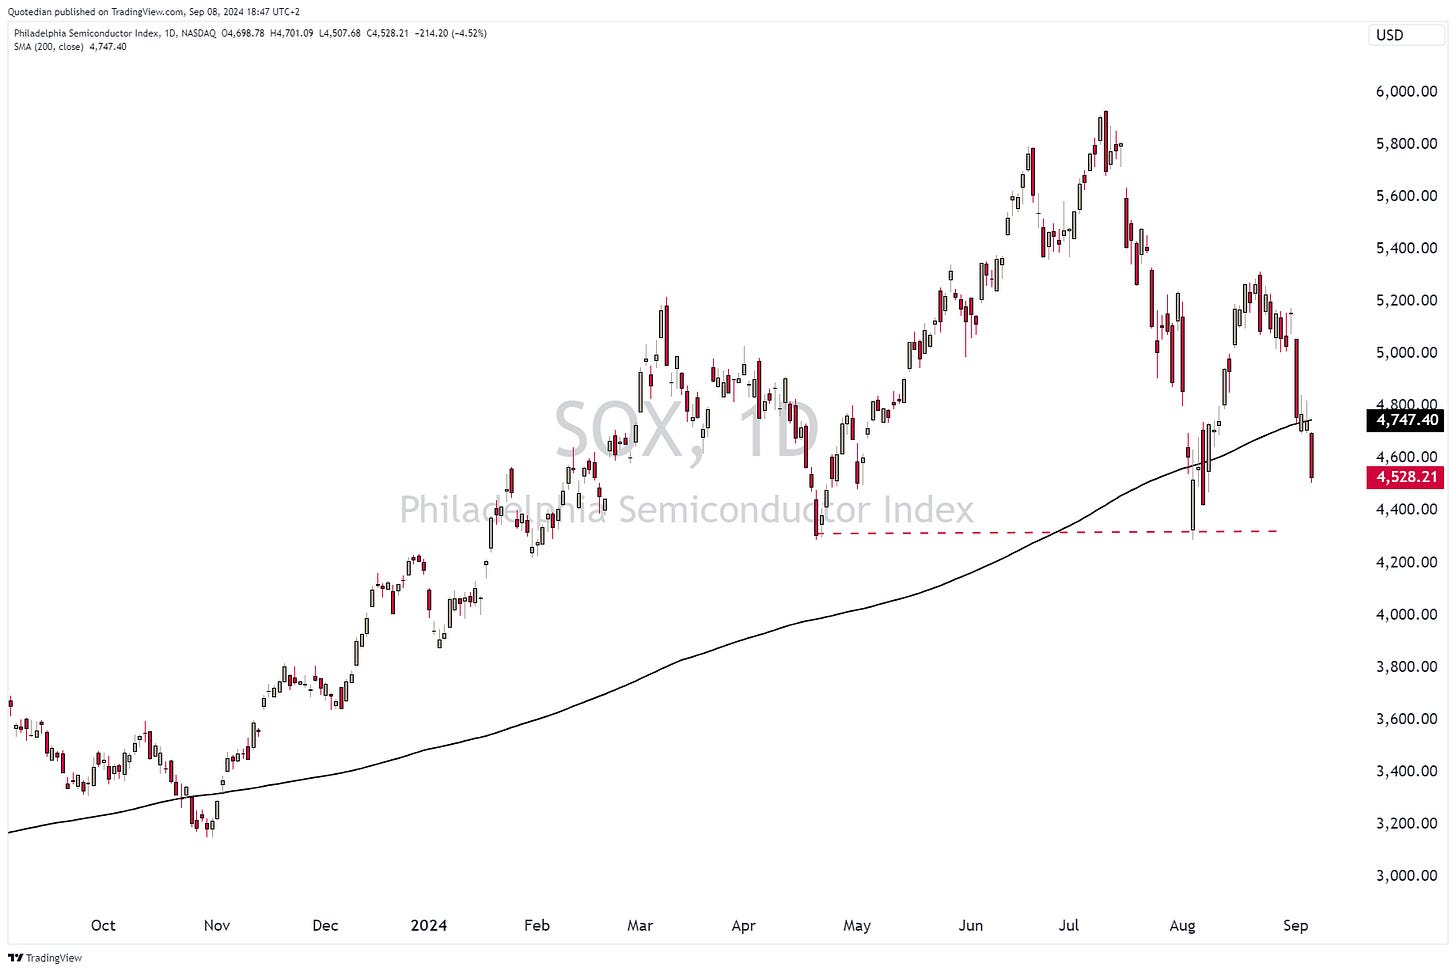
And then there is General SOX, the leader of the advancing army over the past two years, which is already its 200-day MA and quickly closing in on ‘the last frontier’:
But, hey, heads up, let’s remain positively constructive, after all, September is just doing its job!
So, why would the market sell off then anyway?
Is the US job market really in that bad a shape? No, it isn’t.
Will the Fed cut rates next week? Yes, it will.
Would a 50 bp cut be interpreted by the market as Fed entering panic mode? No, it won’t.
Did investors maybe try to front-run the usual September weakness? Yes, probably.
But all-in-all, I continue to believe, as outlined in our Q3 outlook, that is all about changing leadership in the bull market that is about to celebrate its first anniversary in October, rather than the onset of a new bear market.
As discussed already in last week’s Quotedian (click here), the following remains an important chart (tech stocks divided by overall market), but should be considered opportunity (rotation) and not threat (end of bull):
Another way to observe the leadership rotation I am alluring to is to compare the performance of the ‘normal’ S&P 500 (grey - SPY - SPDR S&P 500 ETF Trust) versus its equal-weight version (red - RSP - Invesco S&P 500 Equal Weight):
Since beginning of Q3, the broader equal-weight version has clearly been outperforming, the narrower, on Mag 7 stocks concentrated cap-weight version. This is likely a trade that should continue to work.
Time for some European market charts now, starting with the broad STOXX 600 Europe index:
The 525 is very clearly the hurdle to be overcome on the upper side. Support should be found around the 500 level, thereafter 480.
The narrower and Eurozone focused Euro STOXX 50 index has whipsawed below the 200-day moving average (MA) again:
France continues to be one of the weakest links in Europe, with the CAC-40 trading below the 200-day MA since June:
These are the biggest YTD-losers in the index:
LVMH is the highest weight in the index at nearly 10%.
Switzerland’s SMI could find support just below the 11,800 level:
Over in Asia, the Nikkei is trading below its 200-day MA again, but today feels like a small victory anyway. The market closed down - 0.5%, but recovered from a more than 3%-intraday drawdown:
In China, the CSI 300 continues to drop,
but Hong Kong’s Hang Seng index looks still pretty constructive, despite the recent downturn:
Holding the current level would be a major win for the bulls looking for another up leg; all risk-off below 16,600 though.
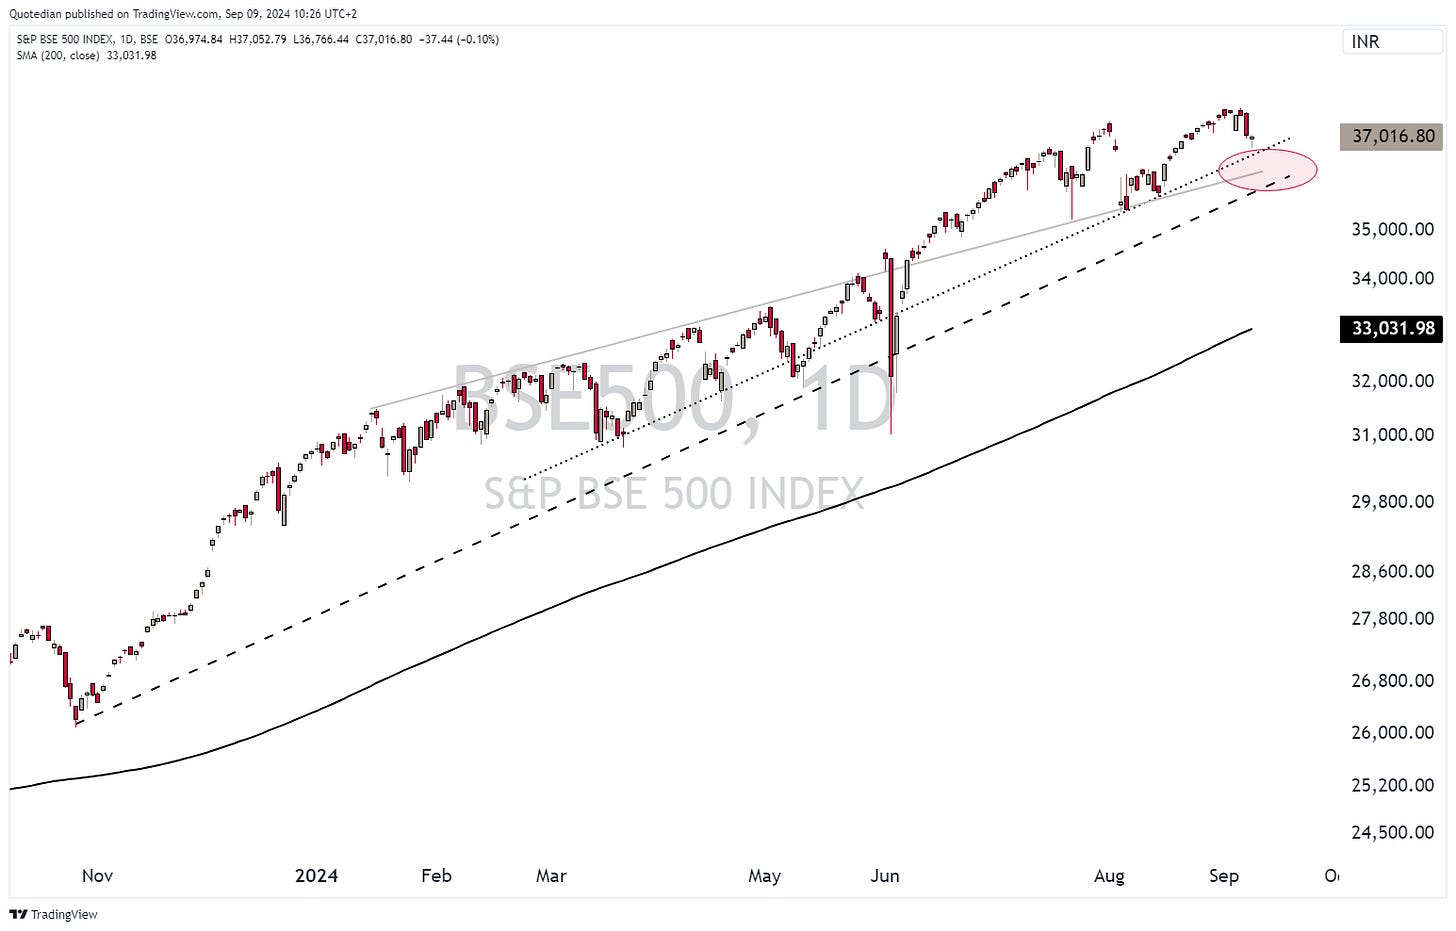
Should we already buy the ‘pullback’ in India’s BSE-500?
Somewhere between 36,500 and 35,900 the answer is yes, depending on the your risk profile.
A quick glance at global sector leadership through our proprietary aReS(TM) lenses, reveals that we should overweight real estate, utilities and health care and underweight consumer discretionary, materials and energy:
Time to finish the equity section by taking our usual look at the best performing stocks year-to-date (YTD) on both sides of the Atlantic and how they have behaved over the past week. Starting with the US:
One noticeable absentee now is Super Microcomputers (SMCI), which has just about completed its 300%-plus roundtrip:
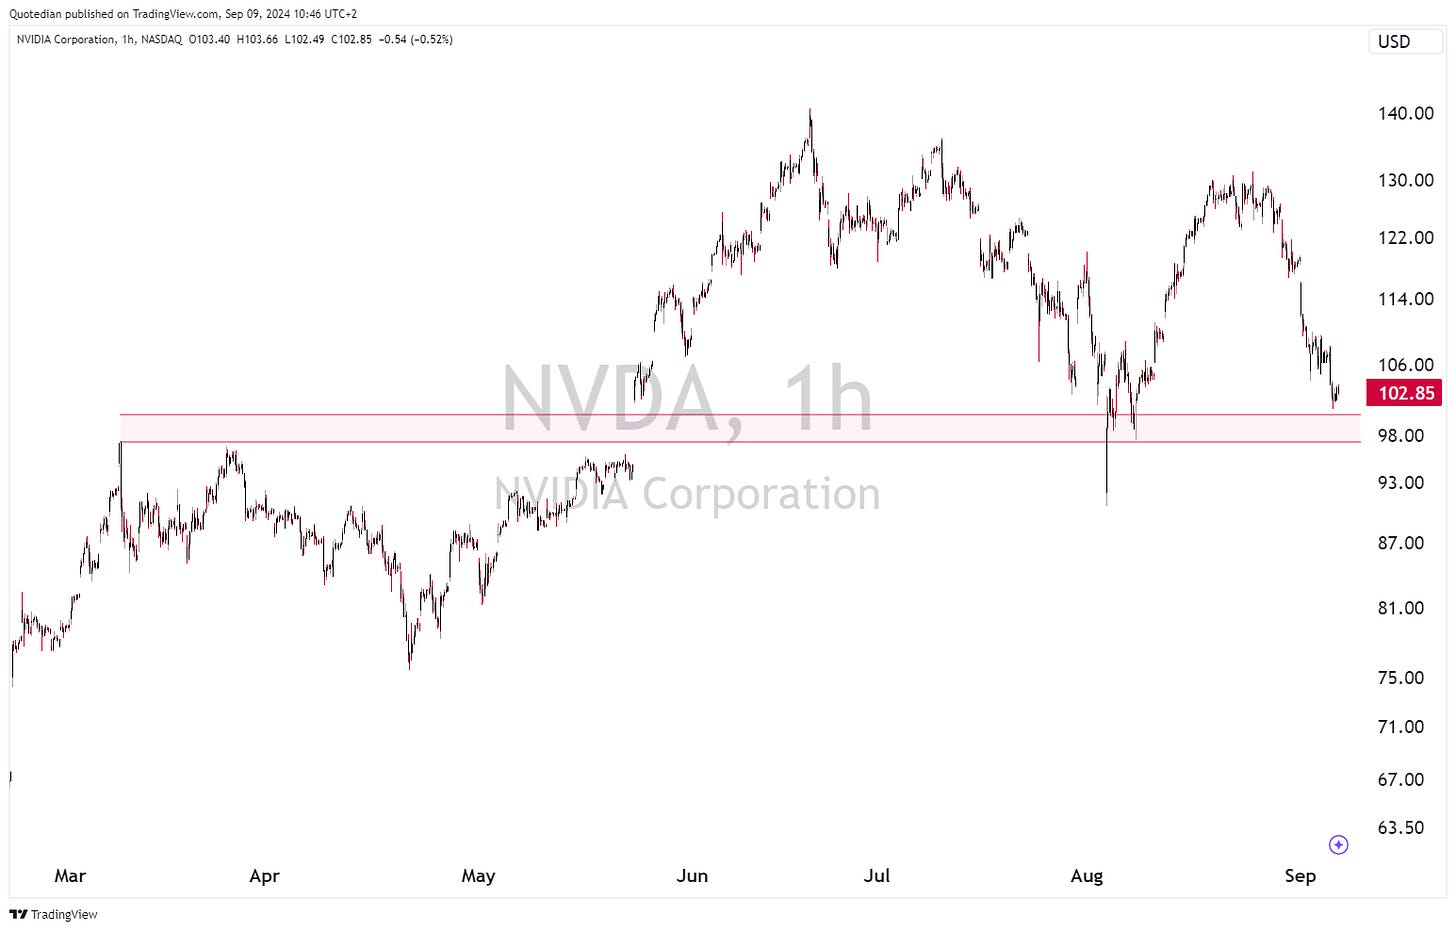
NVDA has now ‘only’ doubled this year. The level around $100 on this hourly chart seems to be of some (pivot-)importance:
Similarly as in the US, it has been a reversal-week for the leading stocks last week:
In the interest rates sphere, it seems like an important two weeks lay head. First, we get US CPI and PPI numbers on Wednesday and Thursday respectively. Thursday will also see an ECB ‘governing council’ meeting, where a 25 basis points cut is expected:
Then, next week, we get interest rate policy meetings from the Fed, the Bank of England, the Bank of Japan amongst others.
Speaking of rate cut expectations, in the US those continue to be at close to ten cuts over the coming year, bringing the terminal rate down to 3%:
This is for some reason the steepest cut expectation at the beginning of an easing cycle over the past 30+ years:
I do not think the economy is that bad that such an expectation is justified. But rather, it is probably the markets expression of thinking that the Fed should have started the cycle several months ago.
For now, the cut expectation for the Fed is 25 bp next week, but let’s check back in on changes to that after Wednesday’s CPI reading.
After Friday’s NFP-number, which was not all that bad looking under the hood, the US 10-year treasury yield dropped below 3.70% for a second time in a month, but since the has rebounded:
The 2-year yield has dropped even faster and the spread between the Tens and the Twos is now a positive 5 basis points, “officialy” ending the longest period of yield curve inversion ever:
Or, has it really ended?
In that famous Fed study “"The Term Structure as a Predictor of Real Economic Activity” published in 1991 and which concluded that a yield curve inversion was the best predictor for a incoming recession, the authors (Arturo Estrella & Gikas A. Hardouvelis) did not use the 10y-2y treasury yield spread, but rather the spread between the 10-year treasury and the 3-month treasury bill! Let’s check the chart above with that new parameter again:
In the currency realm, the USD faced a bit of a mixed week against other major currencies:
Stronger against nearly everything, with four exceptions (JPY, CHF, BRL, SGD).
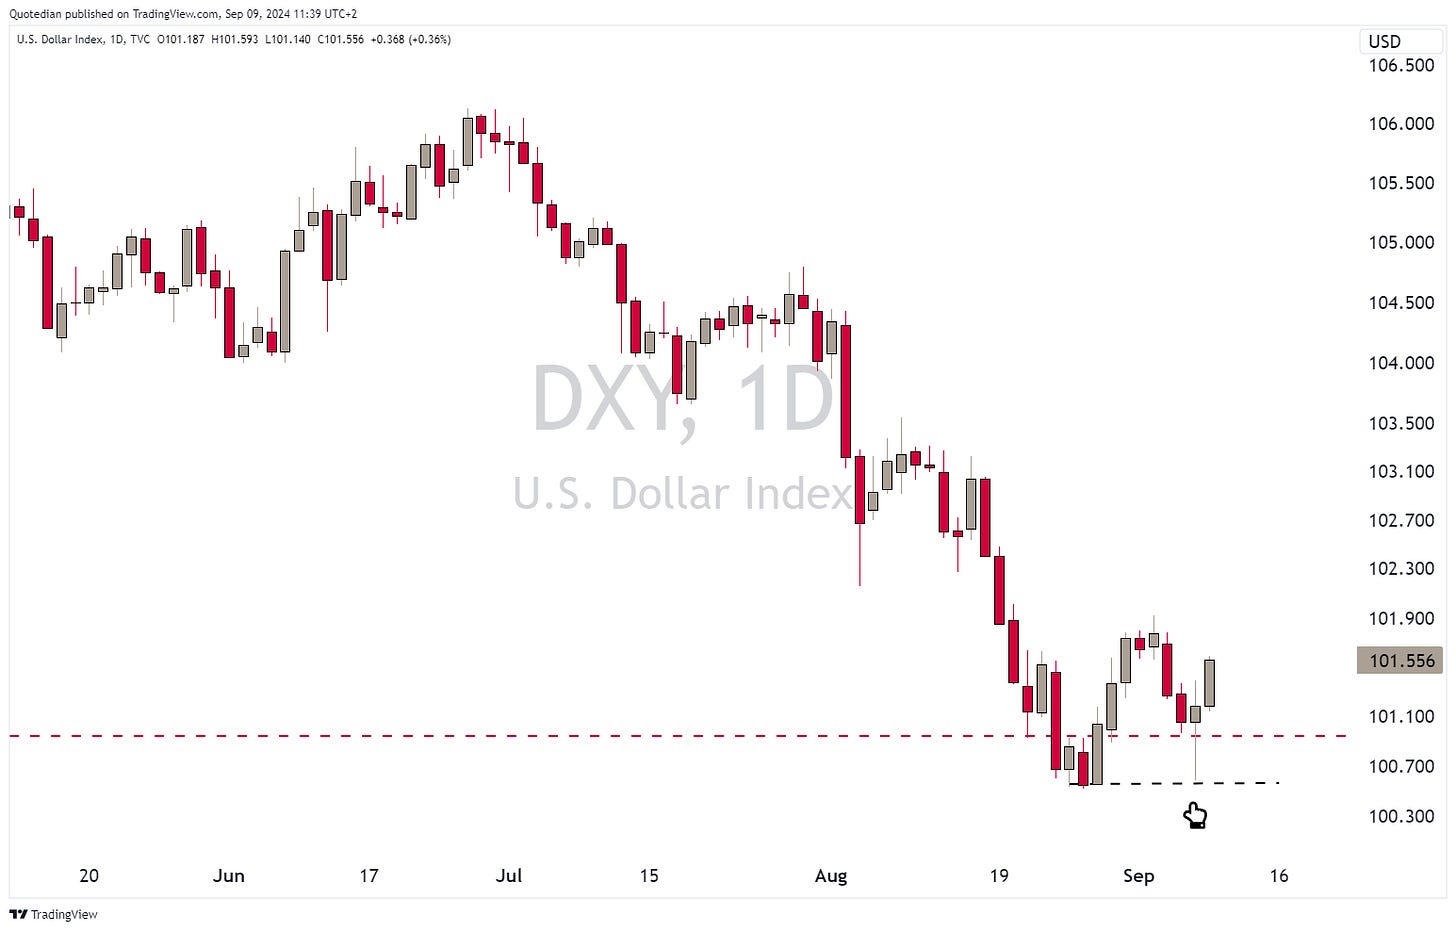
Post-NFP numbers on Friday, the Dollar Index (DXY) faced a sharp sell-off, though has been able to recover and is actually putting in a pretty decent rally this Monday morning:
Zooming out on this same Dollar Index chart, we see that key support is holding (for now):
The EUR/USD upside breakout from early August has started to stutter. A break below 1.1040 would call for an even deeper and more complex consolidaiton:
Idem for the GBP/USD cross rate:
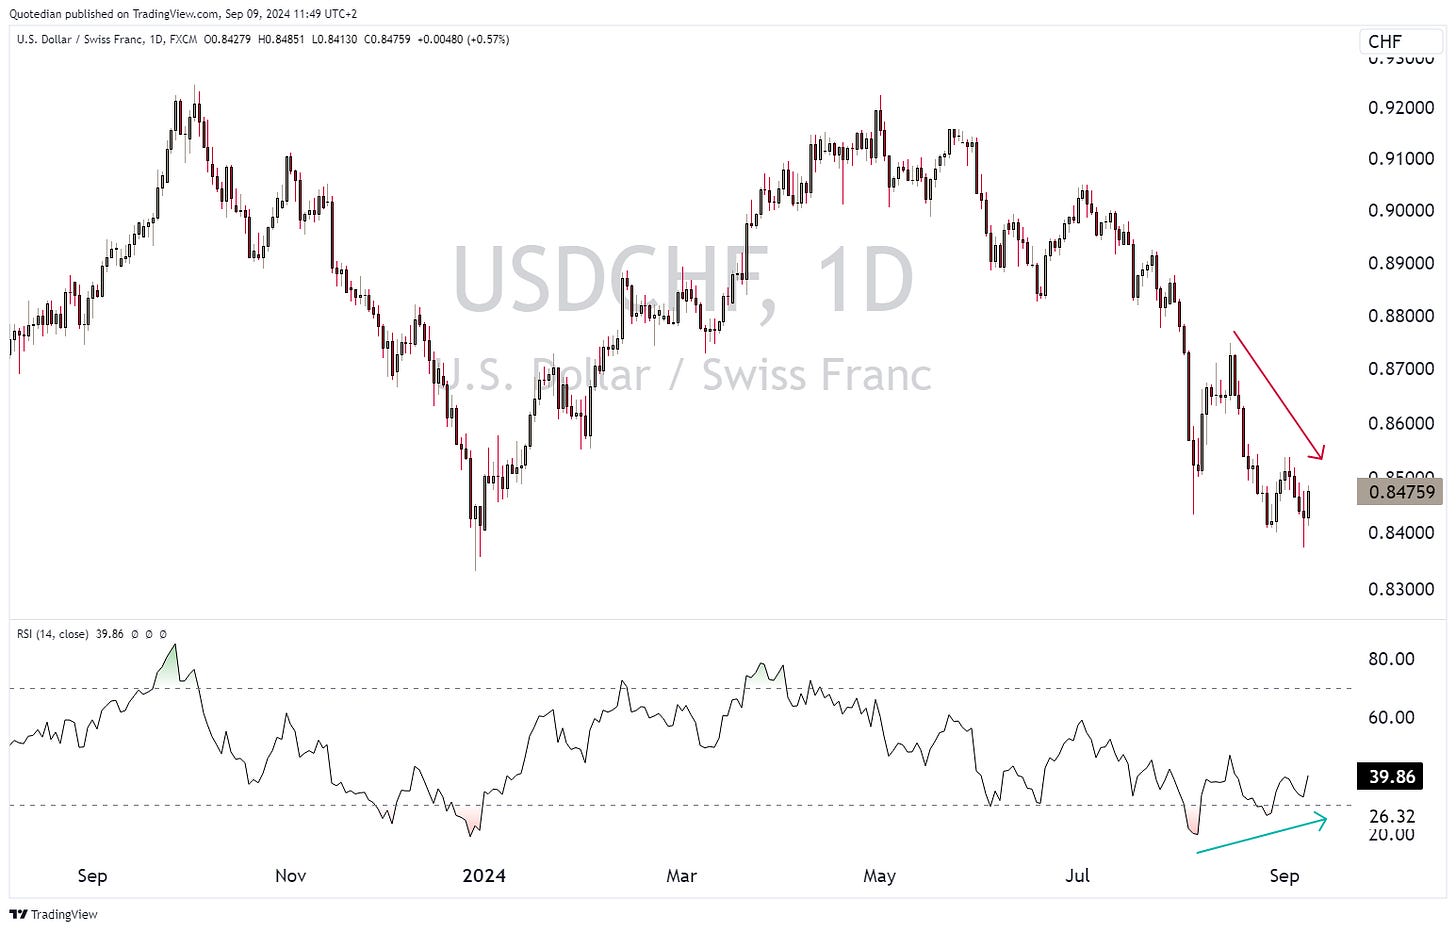
Against the Swiss Franc, the Dollar is trying to recover from the lows not seen since 2015. A positive divergence between price and momentum indicator could be a first sign of a pending US Dollar rally:
Finally, in the commodity complex, the following chart has been making the rounds through (financial) social media:
It shows two things, with the latter being probably more important than the first:
Commodities are cheap as compared to stocks
Being early is expensive
One commodity that has been pulling the calculated benchmark down lately is oil, with WTI for example trading below USD70 and at key support:
Best explanation for the weakness probably via this chart:
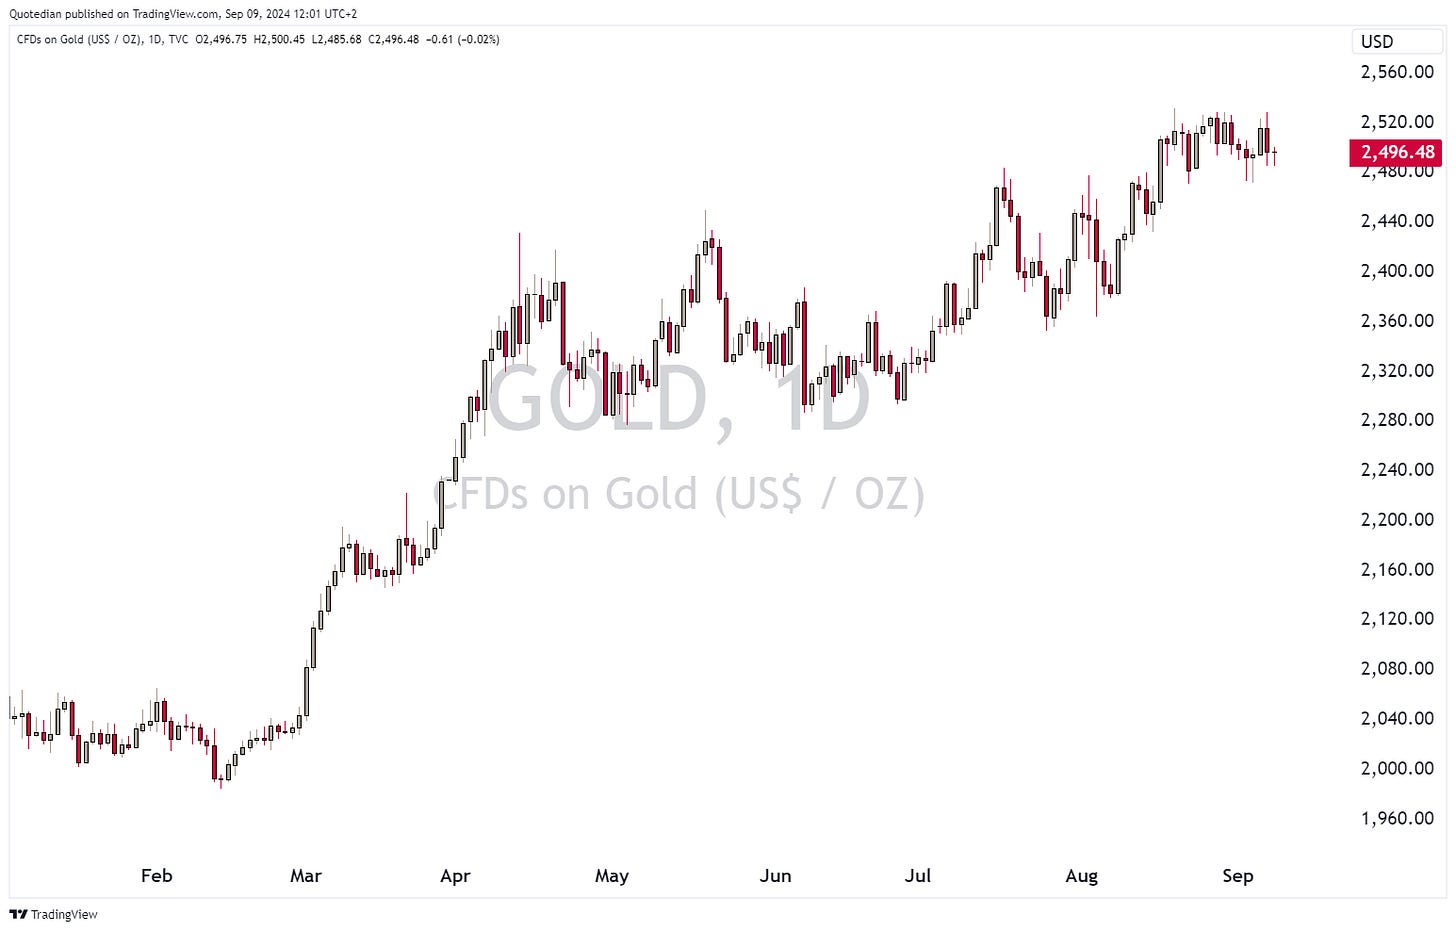
Gold continues to trade around USD2,500:
whilst Silver has dropped back to the low $28s:
That’s all for this week’s Quotedian. Make sure to check back in next week and read the daily QuiCQs in the meantime.
Be safe,
André
Everything in this document is for educational purposes only (FEPO)
Nothing in this document should be considered investment advice
Investing real money can be costly; don’t do stupid shit
The views expressed in this document may differ from the views published by Neue Private Bank AG
Past performance is hopefully no indication of future performance


