Shocktober I
The Quotedian - Vol V, Issue 149
“Far more money has been lost by investors trying to anticipate corrections, than lost in the corrections themselves.”
— Peter Lynch
DASHBOARD
AGENDA
CROSS-ASSET DELIBERATIONS
Can it really be true? I mean … unbelievable! I am absolutely flabbergasted and speechless.
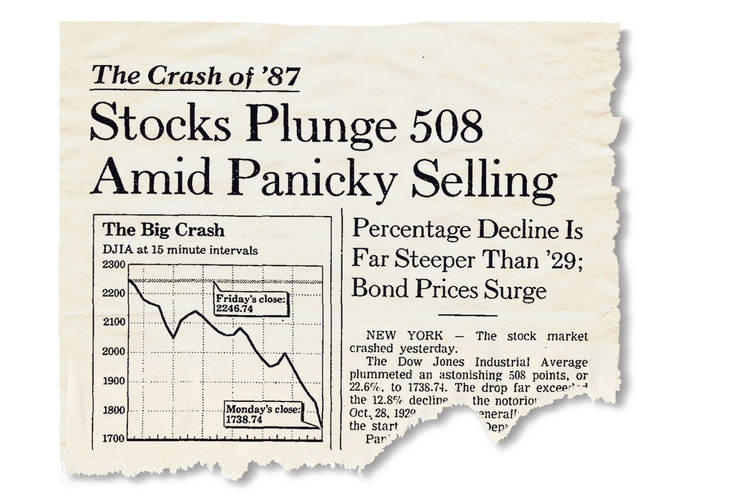
No, not that the market could fall 22% some 35 years ago, but that IT WAS 35 YEARS AGO that the stock market fell 22%!!!! What happened? Where did all those years go??!!
Ok, with that mini midlife crisis on a Wednesday morning overcome, we are just grateful that the fore-mentioned crash gave us a good title for today’s Quotedian. As you will remember from last week’s report titled “Jaw Dropping” discussed in the COTD section that most market bottoms have happened in Shocktober:
Right, let’s start today’s review of the market action over the past few hours with the Chart-of-the-Day with which we ended yesterday’s Quotedian, with one new candle (18/10) added:
Yesterday’s one percent rally lifted us out of the downward trend channel at (1), and closed the gap we had identified at (2) right at the opening. HOWEVER, by the time of the closing bell, it failed to overcome that gap (2), which raises a small, orange warning flag.
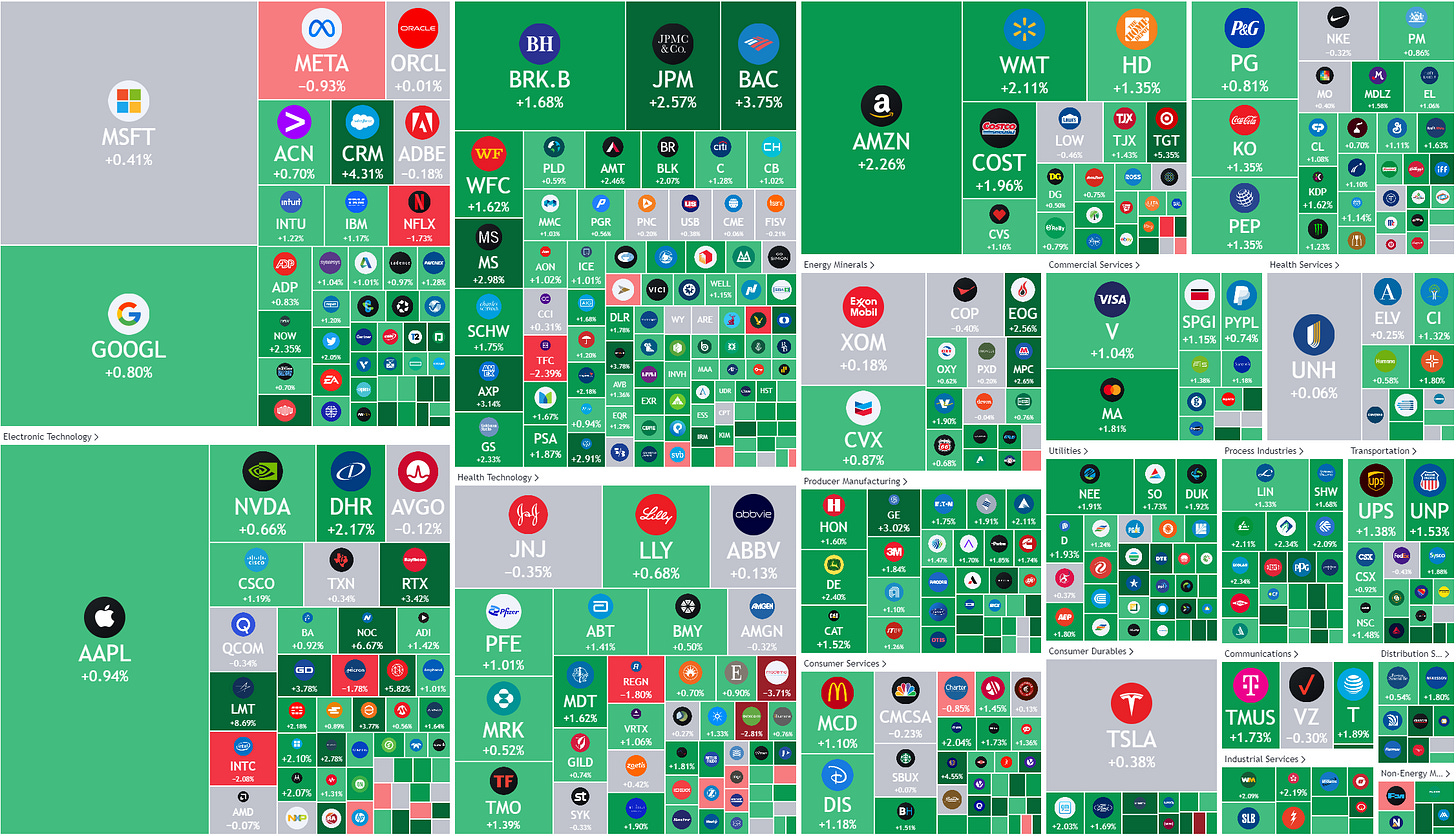
For a second consecutive day, all eleven sectors on the S&P 500 were higher,
and albeit breadth, as measured by the advancing/declining stocks ratio, was not as broad as during the previous session, it was still around 9:1, leaving us with the following market carpet:
There’s not much more to highlight from yesterday’s equity section, other than the Q3 earnings season is getting under way and so far the beat-
and the growth-rate are pretty decent:
In other words, the earnings shoe everybody is expecting to drop is still sitting in its place on the shoe shelf.
One last observation to be made on the equity side, and it will serve as a segue into the fixed income section, is that yesterday’s advance came on the back of stronger yields. Now, on one side, we know that for equity gains to be sustainable, we need yields at a minimum to stay put, ideally they head lower though. On the other side, an equity rally on higher yields is also a sign of returning animal spirits, which is not the foundation of a healthy long-term rally, but could be possibly a face-ripping, short-squeeze rally that can go further than we can stay solvent … if you know what I mean …
Anyway, US 10-year yields stand at 4.05% as I type, the highest level since Shocktober 2008 - also a period to remember …
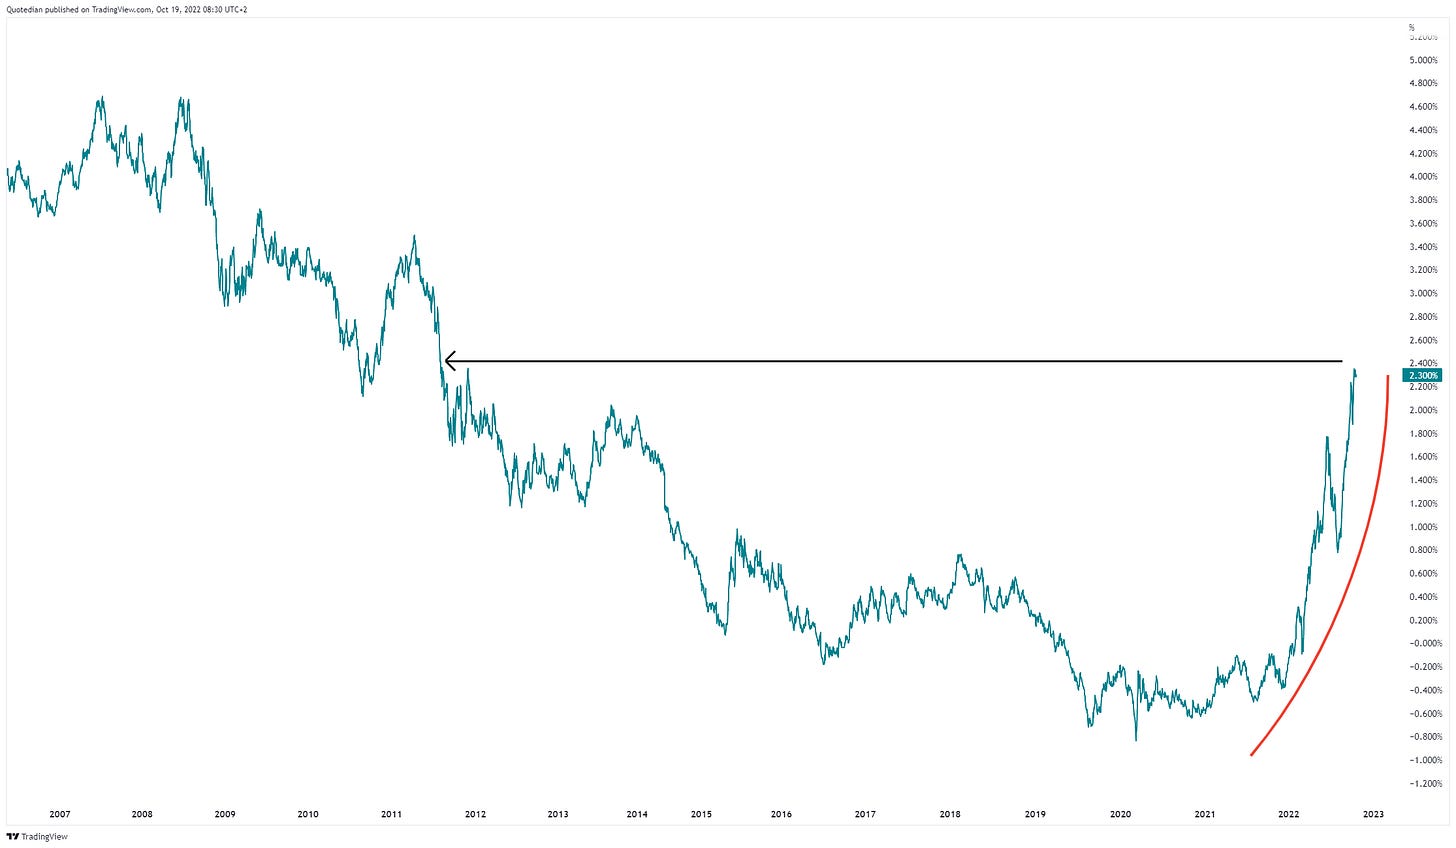
Similarly, the German Bund hit an intraday high of 2.42% yesterday (2.50 here we come), a first since 2011:
UK Gilts continue some kind of normalization process,
as the Prime Minister and the Lettuce continue their stand-off:
Credit spreads continue to tighten, which is supportive to any further equity advances, though it is interesting observe the widening gab between European and US Investment Grade bond spreads (black circled):
In that context of the narrowing high-yield spreads, the iShares High Yield Bond ETF chart also starts to look more constructive:
Turning to currencies, there is not much more to report (today) other than the Japanese Yen is continuing its unstoppable slide to 150:
Finally, in the commodity complex, it is probably worth mentioning, that Germany’s decision to postpone the shutdown of the remaining three nuclear reactors is having a further soothing effect on German Baseload Power prices,
which is seemingly also having a knock-on effect on European (Dutch) gas prices:
Finally, some (partial) common sense, even though it is shocking that the German government had to wait for advice from a Swedish teenager to take that decision:
O…M...G!!!
Anyway, time to hit the Send button. Have a great Wednesday!
André
CHART OF THE DAY
Earnings season is getting into full swing and whilst it is not my objective to list all earnings results here (none, actually), it is always worthwhile highlighting one or the other from a technical viewpoint, be it for a long or a short.
In that context, Netflix (NFLX) beat top- and bottom-line yesterday, and quite comfortably so. In addition, the company also doubled the expected rate of new subscribers to somewhere above two million. This resulted in a 10%-plus jump of the share price in after-hours trading.
And now, here’s the interesting part of this. As the monthly chart of NFLX since inception shows, this ‘turnaround’ is happening right at the bottom of the long-term, upward-sloping trend channel, allowing for possible entry with a tight stop loss.
Just observing …
Thanks for reading The Quotedian! Subscribe for free to receive new posts and support my work.
DISCLAIMER
Everything in this document is for educational purposes only (FEPO)
Nothing in this document should be considered investment advice
Past performance is hopefully no indication of future performance


