

Shocktober II
The Quotedian - Vol V, Issue 152


“October: This is one of the peculiarly dangerous months to speculate in stocks. The others are July, January, September, April, November, May, March, June, December, August and February.”
― Mark Twain, Pudd'nhead Wilson
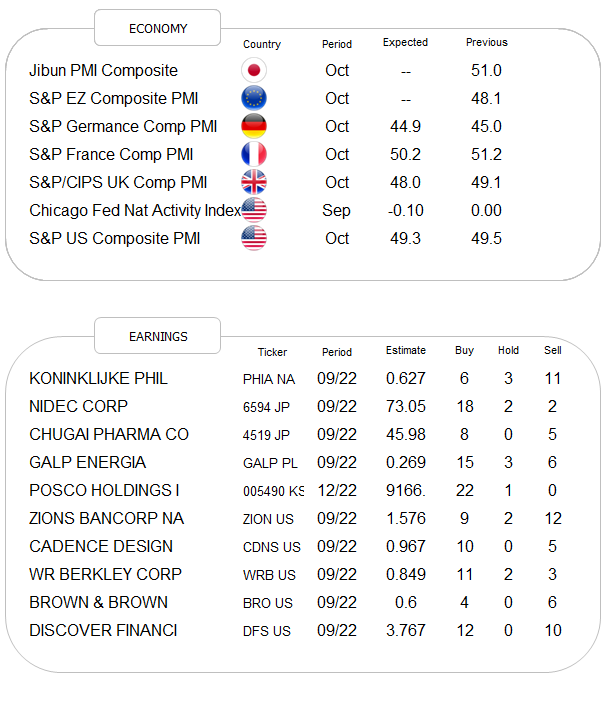
DASHBOARD

AGENDA
CROSS-ASSET DELIBERATIONS
Earlier this week, in Shocktober I, we “celebrated” the 35th anniversary of the Black Monday crash. Tomorrow Monday, some 93 years ago, there was another stock market crash that made history (see Newspaper snippet at the top of today’s Quotedian).
The point is, that October is notoriously famous for being a volatile month, but the truth is that this means also that many important market bottoms were observed during this perilous month.

This brings us into the third week of October 2022, where markets seemingly are really trying very hard to hammer in a bottom.
Looking at the weekly performance statistic, we indeed see that most global benchmarks had in many cases a very decent week:

Now, pulling out our short-term roadmap and lines in the sand chart on the S&P 500, Friday’s rally was indeed very constructive, with stocks closing above the level where the gap at (2) is closed (after having failed on the first attempt, remember?):

We must however also take into consideration that Friday was option expiry (opex) and with the dealer gamma being negative going into the session, a move in either direction was prone to get exacerbated by the need of traders to hedge in the direction of that movement.
Zooming in even a bit further on that same chart, now using an hourly time frame (each candle is one hour's worth of trading), we could even identify an inverted shoulder-head-shoulder pattern:

According to this technical analysis rule, the price target would lay somewhere between 3,960 and 4,010, depending on how “aggressive” you apply the target count. In any case, both targets are above (4) in the previous chart, so this could turn out to be very constructive.
So, are we getting super-bullish here? Definitely not, as we remember that nothing ever good happens below the 200-day moving average (another coincidence: that is at 4,000 now …),
BUT … our roadmap of a recovery rally into year-end and then a renewed difficult market environment in 2023 could very well be underway. At a minimum, the bears got a kick between their legs on Friday:
Turning to equity sector performance, one of my favourite sayings is “strength begets strength” as this year’s star performer (Energy) continues to outperform during weak AND strong weeks for stocks:

This is what the sector performance (S&P 500) looks like on a year-to-date basis:

That’s a 67% performance gap between the best and the second best sector. Trend following and relative strength investing work.
“Strength begets strength” …
And it is largely also true at individual stock level, as the following tables we update on a weekly basis prove:

Finally, regarding Friday’s poll, where we asked whether stocks were resilient or ignorant with regard to the elevated volatility on bond markets, the “stocks ignorant” won…

This is a nice segue into the bond markets of last week, which continue to be a difficult market for buy-and-hold investors (which most of us are):

Friday’s bond session had a very interesting feature to it. Remember Nick Timiraos, report at the WSJ and (unofficial) Fed-Mouthpiece designate? He launched a Twitter thread on Friday afternoon, with one of the comments (highlight mine) having following impact on treasury yields:

Notice any change in trend at that time? Coincidence or market manipulation? Don’t worry, I will not Poll your opinion on that, but tell you outright: Market Manipulation.
In any case, the turn lower in yields was definitely helpful to the stock market rally and left the bond yield chart with a shooting star candle (exhaustion) and together with a possible price/momentum divergence (see arrows) could lead to some days of consolidation in yields:

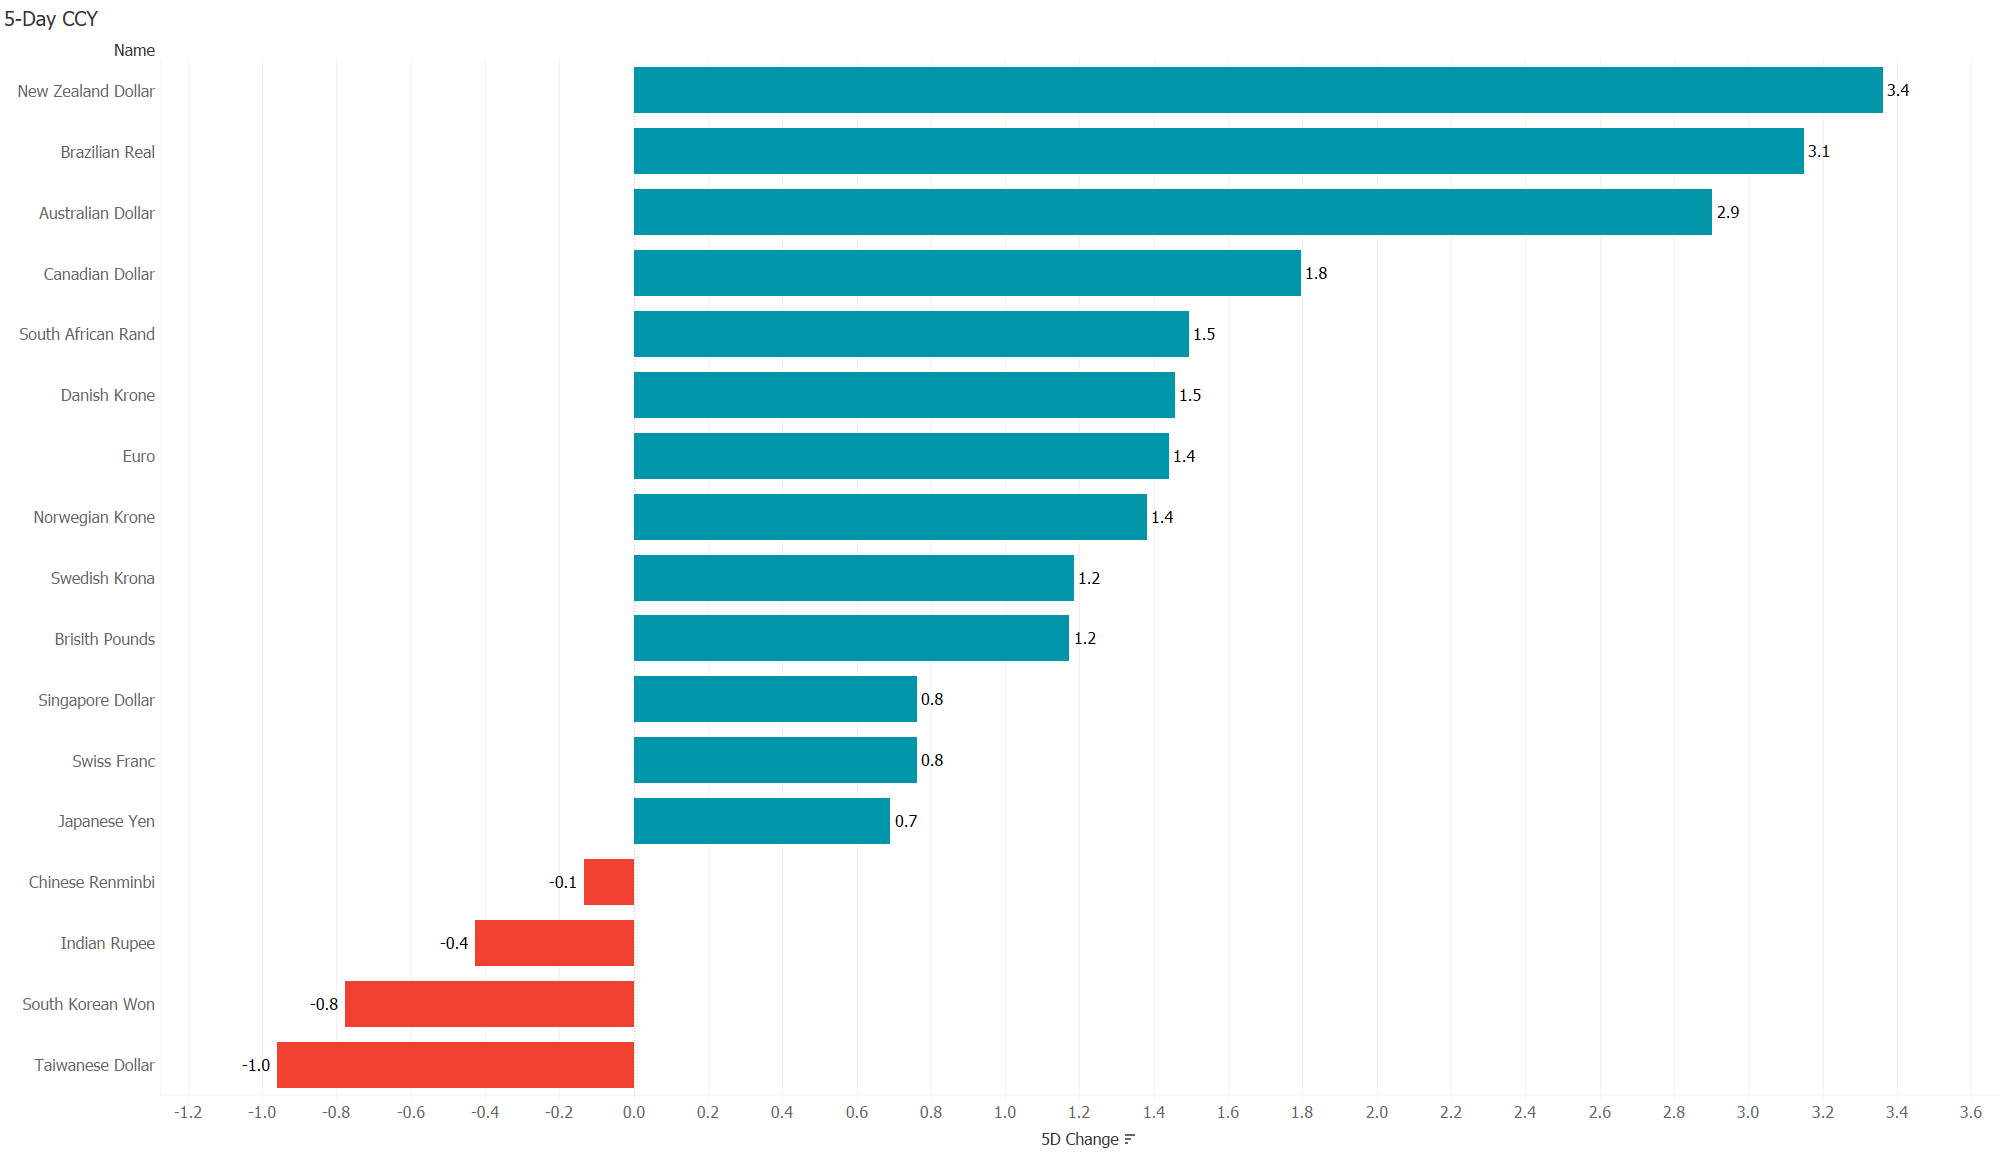
Currency markets very relatively calm throughout the week, were it not for the Japanese Yen and the Friday … But first, here’s the performance update for some major currencies versus the US Dollar, where many currencies were able to gain some ground against the greenback:
Taking a closer look at the Yen then, this is Friday’s intraday chart of the USD/JPY cross (Hint - take a close look at the big figure, i.e. the number to the left of the decimal point):

Starting the day at around the 150 level, the currency appreciated to above 152, until the BoJ (or the MoF, who cares) came in and intervened for a second time this year in currency markets. The JPY rose six(!) big figures in less than an hour in a supposedly thin FX market on a Friday evening.
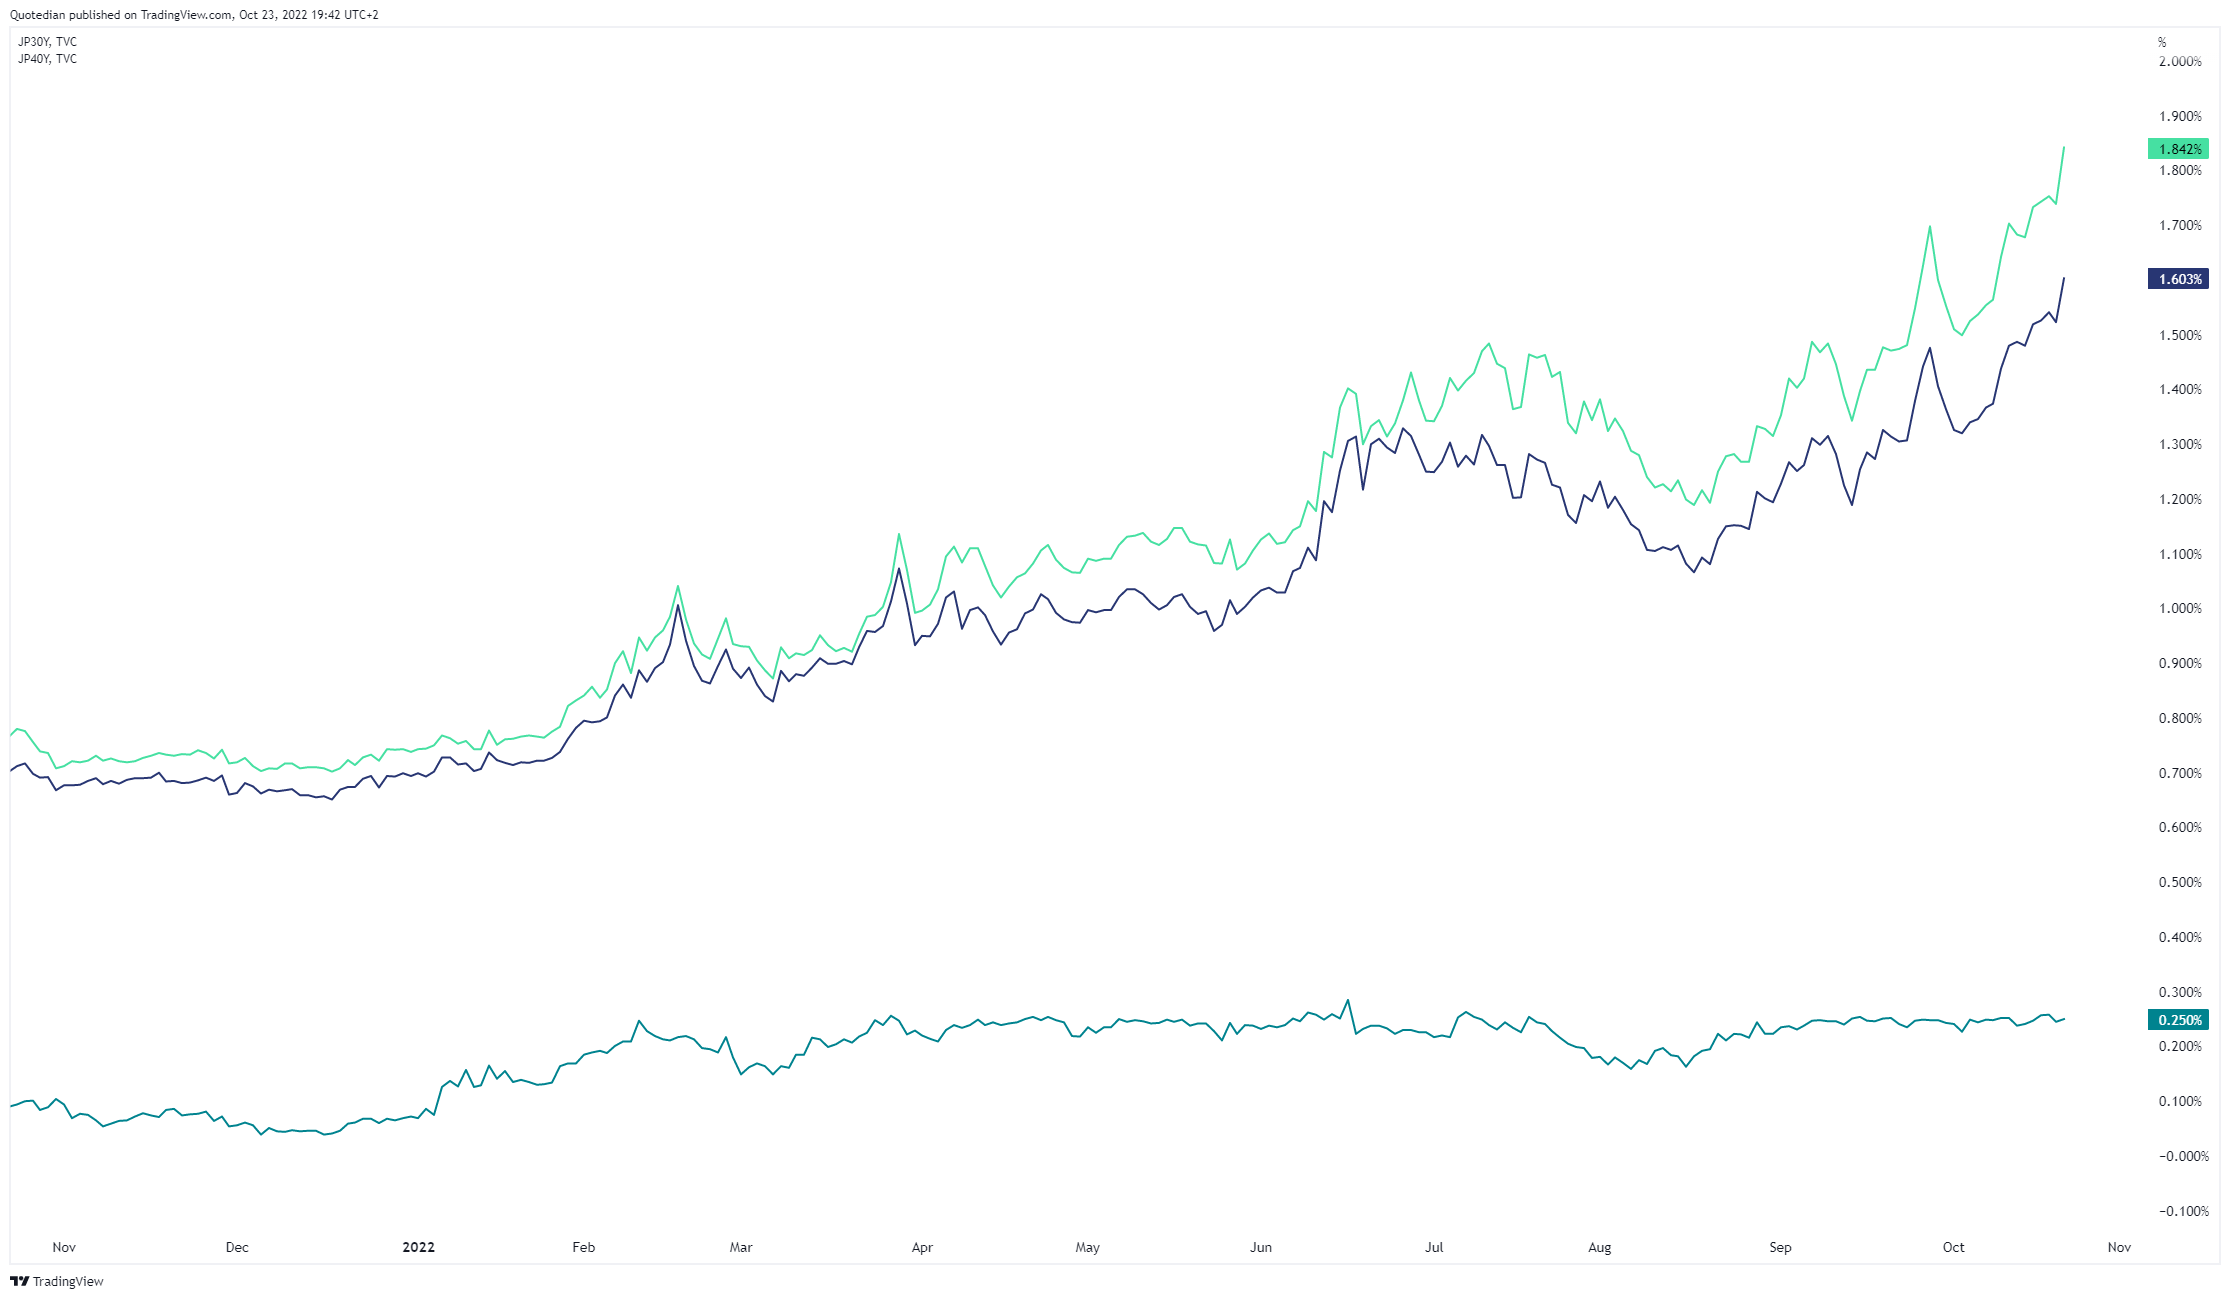
All this on the back of the BoJ (or the MoF, who cares) defending that silly, silly 0.25% level on the 10-year JGB, with the only result that all other (longer) maturities are taking the heat:
The additional yield pressure on Friday came after the country’s CPI was reported as the highest in 32 years when not including value-added tax hikes (no chart on that, sorry).
Turning to commodities, I will need to leave you due to time constraints with the performance table only:

As a matter of fact, I still think commodities will continue to be the place to structurally be over the next decade or so, mainly due to underinvestment over the past decade, coupled with upcoming capex spending due to re-shoring (aka deglobalisation) AAANNDDD, last but not least, chronic underinvestment into the asset class. But, let me come back to all of this on another day - it will be fun.
So, as usual, there is so much more to write about, but it is already quarter-to-Chablis, hence time has come to hit the Send button and uncork that bottle. We will catch up next week with some themes I had to leave out in the interest of a drink time.
Enjoy the rest of your Sunday!
André
P.S. It took me about three hours to put together your 5-minute Sunday read. Please share the labour of love with your network, if you think it is worth:
CHART OF THE DAY
After the chart festival above, let me just add one more here. Today’s COTD revisits the positive divergence between price and momentum on the S&P we had already discussed last week. I would label this: “so far, so good”:

Thanks for reading The Quotedian! Subscribe for free to receive new posts and support my work.
DISCLAIMER
Everything in this document is for educational purposes only (FEPO)
Nothing in this document should be considered investment advice
Past performance is hopefully no indication of future performance