Show Me The Money!
The Quotedian - Vol V, Issue 129
“Show Me the Incentive and I’ll Show You the Outcome”
— Charlie Munger
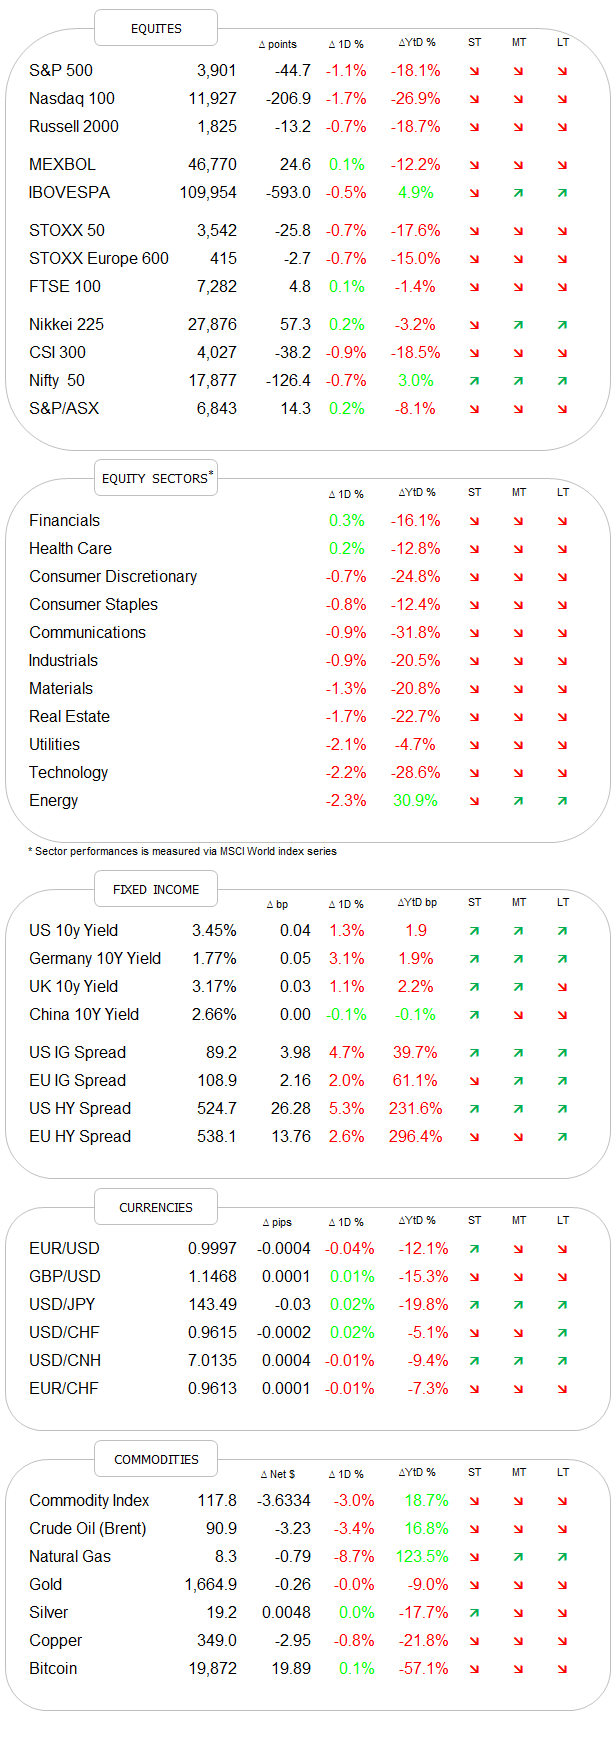
DASHBOARD
AGENDA
CROSS-ASSET DELIBERATIONS
Let’s start with today’s title and QOTD of The Quotedian … Throughout this week we had three different, well-recognisable ‘celebrities’ given their advice to the FOMC, on what they should do at their meeting next week:
Larry Summers suggested a 1% hike
Jeff Grundlach proposed to hike by 0.25% hike:
Elon Musk insisted on a 25 bp rate cut:
And all this, whilst the Fed has already said via their newly found favourite forward guidance tool, that they will definitely and guaranteed hike 75 basis points, as regular The Quotedian readers already know:
Now, back to our celebrities and their respective incentives for their rate demands:
Summers was the head of the Treasury a long, long time ago and now makes his living by being an economics professor and above all by selling newspaper articles for an associated media company. Fear and extremes sell, hence 1% it shall be.
Jeff Grundlach mainly runs bond portfolios with gazillions of $ under management. Sharply higher rates are bad for business…
Musk is levered up on very-long duration via his different equity stakes, not least Tesla. High rates = pain, lower rates = gain
So, with further ado (LOL), let’s look at some of the market (in)action over the past 24 hours or so, though after the lengthy introduction to today’s deliberations you probably already suspect the next part will be shorter than usual. However, keep in mind that Sunday’s usual gargantuan edition is just two days away ;-)
Stocks whipsawed lower in yesterday’s session, as the entire yield term structure remained firm. Especially in the last later half of the session did negative dealer gamma kick in and briefly pushed the S&P 500 below 3,900:
Though compared to Tuesday's massive sell-off where everything was down, there were some pockets of green yesterday:
To highlight sector performance a bit better, this is what yesterday’s session looked like for the eleven economic sectors in the S&P 500:
Let me also print you quickly yesterday’s European sector performance, as it carries some interesting information about a possible trade we discussed end of last week (or early this week, memory fails):
Aha! Investors continue to like the idea of higher, non-negative rates in Europe, with the simultaneous extension of the term where banks have access to all of that ‘free’ ECB money. Being long the BNK ETF continues to be a decent trade and the chart picture looks better by the day:
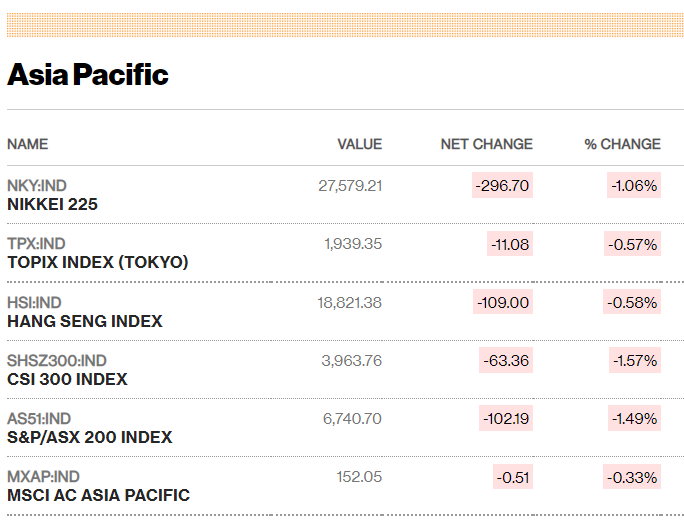
Asian markets are largely following heed to yesterday’s sell-off on Wall Street, with major indices down around the one percent mark as I type:
Index futures suggest a European opening at a similar pace to the downside.
Today should make for a fun, volatile, quadruple-witching session. The good news is that with all the options expiring today, a lot of the negative dealer gamma, which exacerbates moves in both directions, should be gone next week.
As mentioned further up, the yield complex remained firm, not only in the US but also over here in Europe. The chart for 10-year yields in the US, the UK and Europe (proxied by German rates) all look similar and as they say: “the trend is your friend right until the end when they bend”. Here’s the daily chart on the Bund (yield):
Curve flattening also continues via faster rising rates at the short end. The 10-2 year slope remains in firm negative territory but as described yesterday, our focus is now on the 10-year minus three-months spread as “recession confirmer”:
Over to currency markets, where there is really little to report on. The EUR/USD is confined to some tight range, with a break lower maybe still on the books?
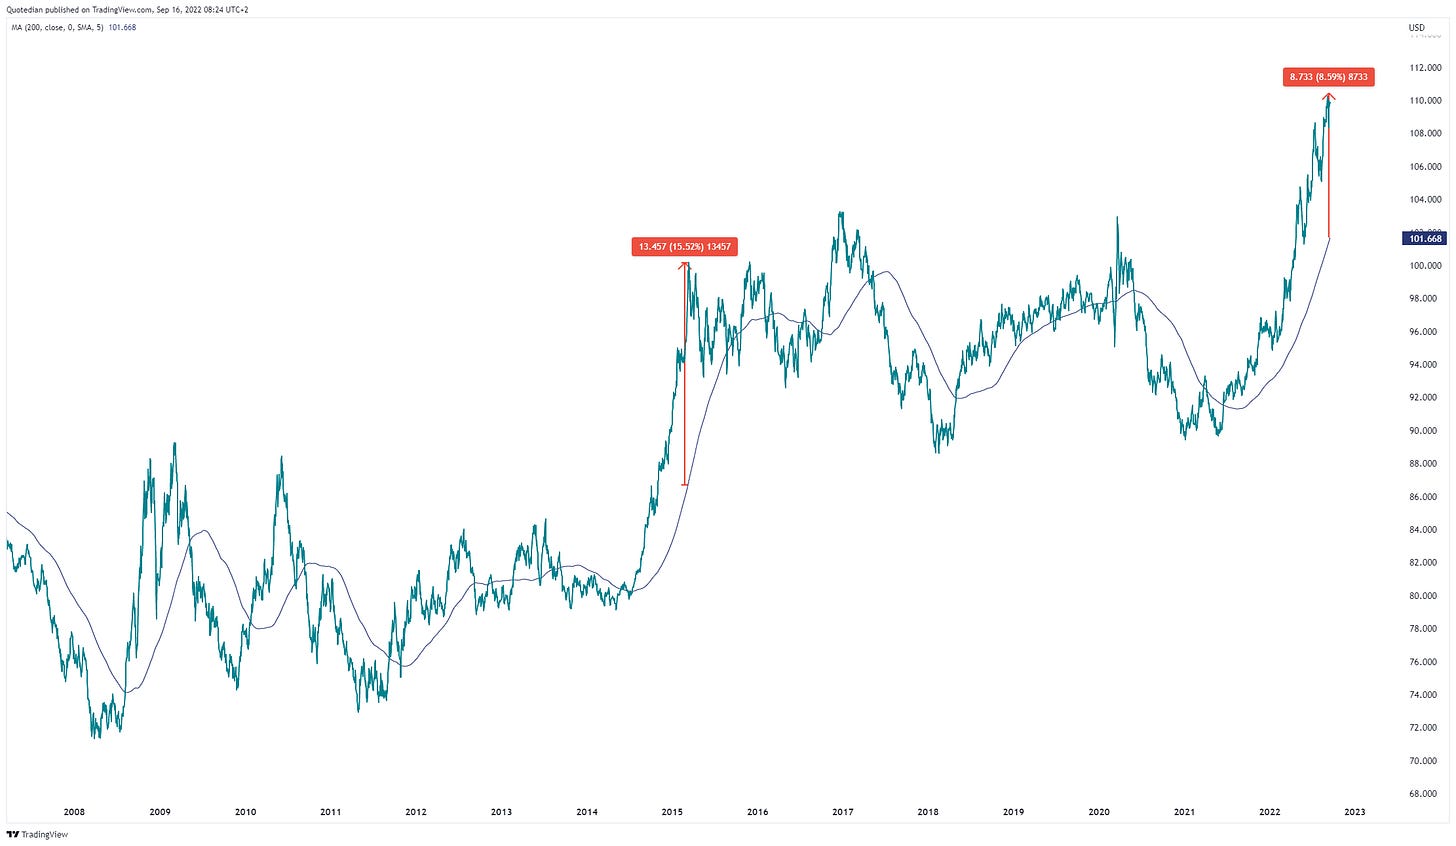
Though in terms of the US Dollar’s (DXY) distance from its own 200-day moving average we are still at one of the most stretched (i.e. overbought) levels since the GFC:
Then on the other hand, as the previous experience in 2015 shows, what is already overbought can get even more overbought.
Finishing with commodities, we have two OUCH! situations - one we can dust off, the other probably a bit more painful for many of us.
The first ouch! is to be found on the chart of Natural Gas (US edition), where Wednesday’s 10% gains was offset by a nearly 9% drop yesterday:
Uninvestable comes to mind …
And here’s the bigger ouch!:
Gold is breaking technical long-term support and the ‘only’ hope for gold bugs right now is that this is final, mother-of-all fake outs … unfortunately, as we all have painfully learned, is hope not an investment strategy…
Ok, high time to hit the send button, but just before that, let’s have a poll on today’s intro. I.e., with whom are you on what the Fed/FOMC should do next week? This should be something fun we then can discuss in Sunday’s edition!
Do not forget to hit the like button at the end of this mail!
Have a great Friday!
André
CHART OF THE DAY
Today's Chart of the Day represents every bear market since 1929 from peak to trough.
Notably, the average bear market decline is -37% and lasts 344 days. For reference, the SP500 is down -17.2% YTD, and we are at day 253 by the calendar and 174 trading days from the peak if we have not already seen the lows.
Though beware, this is descriptive, not predictive data. We have either had one of the shortest, sharpest bear markets in history (if the lows are in) or a very average bear market with the lows still to come.
If the latter should be true, the waiter has cleared the appetizer plates and is preparing the table for the main course. Stay tuned (and keep your serviette around your neck)…
Thanks for reading The Quotedian! Subscribe for free to receive new posts and support my work.
DISCLAIMER
Everything in this document is for educational purposes only (FEPO)
Nothing in this document should be considered investment advice
Past performance is hopefully no indication of future performance


