Size Matters
The Quotedian - Vol VI, Issue 81 | Powered by NPB Neue Privat Bank AG
“Ignorance more frequently begets confidence than does knowledge.”
— Charles Darwin
Dirty you. Of course, today’s title of The Quotedian refers to the performance difference between large- and small-cap stocks over the past week/month/year(s) … what else?
Fancy an investment chat over a nice cup of coffee? Contact us!
Contact us at ahuwiler@npb-bank.ch
Point in case: Here are the charts of the S&P 500 (large cap - left) and the Russell 2000 (small cap - right) over the past two weeks.
The opening line of Charles Dickens's “A Tale of Two Cities” immediately comes to mind:
It was the best of times, it was the worst of times, it was the age of wisdom, it was the age of foolishness, it was the epoch of belief, it was the epoch of incredulity, it was the season of Light, it was the season of Darkness, it was the spring of hope, it was the winter of despair, we had everything before us, we had nothing before us, we were all going direct to Heaven, we were all going direct the other way—in short, the period was so far like the present period, that some of its noisiest authorities insisted on its being received, for good or for evil, in the superlative degree of comparison only.
After having demonstrated my immense cultural knowledge (I ♥ Google), let’s get started on our financial market review - a topic where of which we can all boast not having a freaking clue …
Let’s start with the S&P 500, where the rally starting on October 27th started to stall at the beginning of the week and Thursday's outside candle had the potential of a trend reversal:
BUT, one candle does not make a trend…
… and Friday’s rally completely “blew out” that trend reversal possibility:
Three words (hopefully not of the category ‘famous last words’): “Bullish as hell"!”
In that context, we (the NPB’s Investment Committee) have decided to unwind the tactical underweight of the past two months, which paid off well in terms of reducing portfolio volatility (> Sharpe ratio), and bringing the equity exposure back to neutral for a year-end rally. You can read the official statement here.
How to position for such a rally? KISS*, i.e. gain beta-exposure via, for example, the SPDR S&P 500 Trust ETF (SPY), which would also allow you to handle precise risk management (aka stop loss).
It would be tempting to try and ‘play’ a rebound of the laggards, given that the S&P 500 index is up nearly 16% YTD and the S&P 500 Equal-Weight Index is negative over the same time period:
However, I insist: “Keep it simple, stupid”.
As today’s title insinuates, follow the leader and the leaders are large-cap stocks. And not so since yesterday only. Here’s the long-term ratio chart of small-caps (Russell 2000) to large-caps (S&P 500):
However tempting, do not catch that falling knife until you see a clear improvement on the chart. You may miss the beginning of the trend, but once it really changes, there will be plenty of upside to take advantage of.
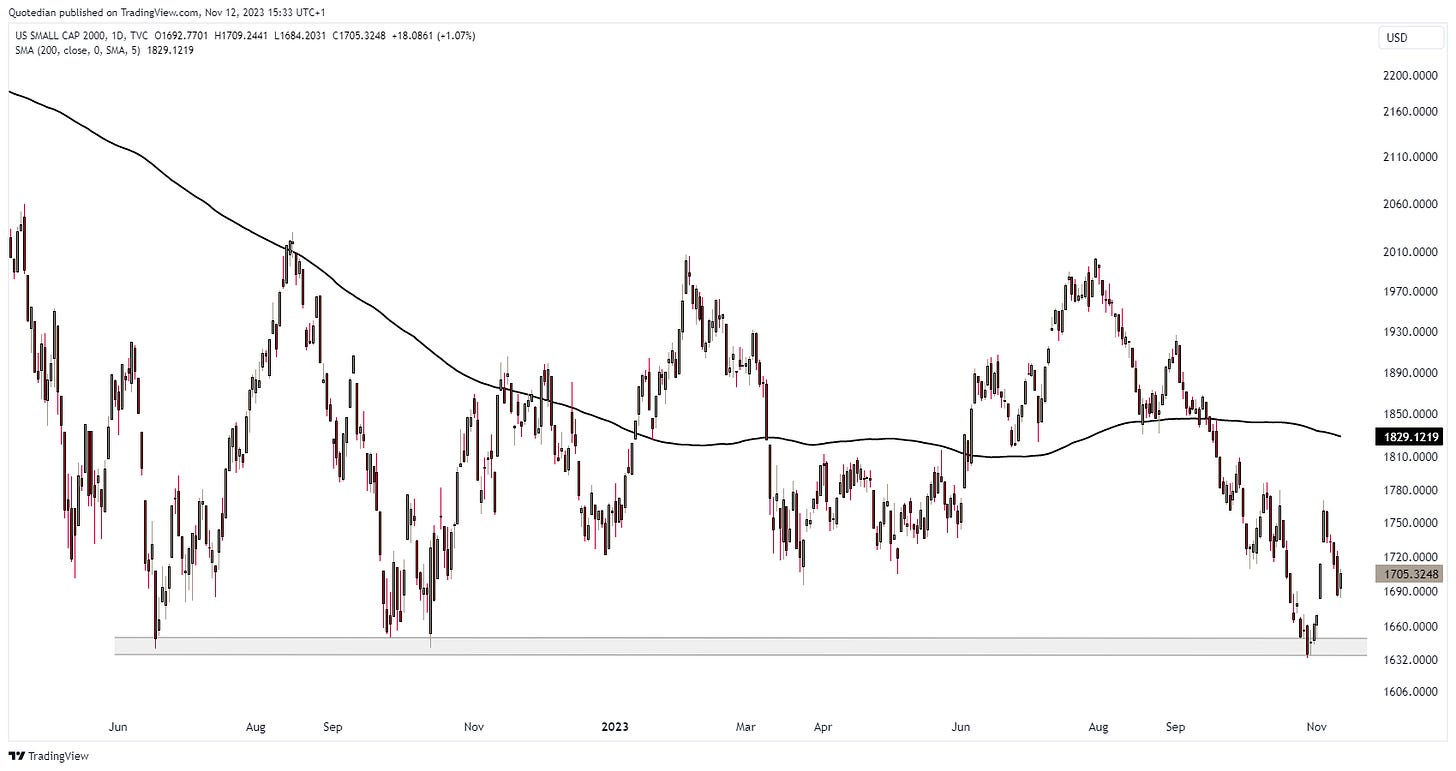
Here’s the stand-alone version of the Russell 2000 index:
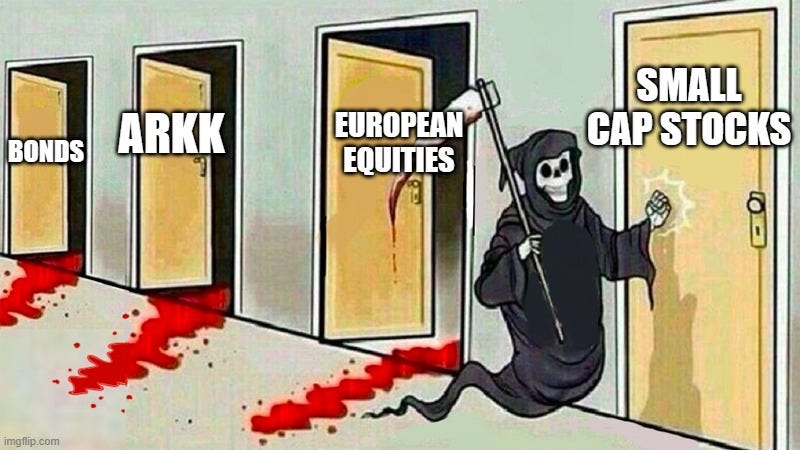
And talking falling knives, here is another one you should not try to catch:
Yes, DO NOT try to bottom fish that “European-equities-will-outperform-US-peers-because-they-are-much-cheaper” fad. The cemetery is full of ‘smart’ investors who have tried just that.
And talking European equities (were we?), our markets missed most of Friday’s late Wall Street rally, but the chart remains overall constructive too:
Taking out the 200-day MA at 4,265 on the EuroSTOXX 50 would be a major win for the Bulls.
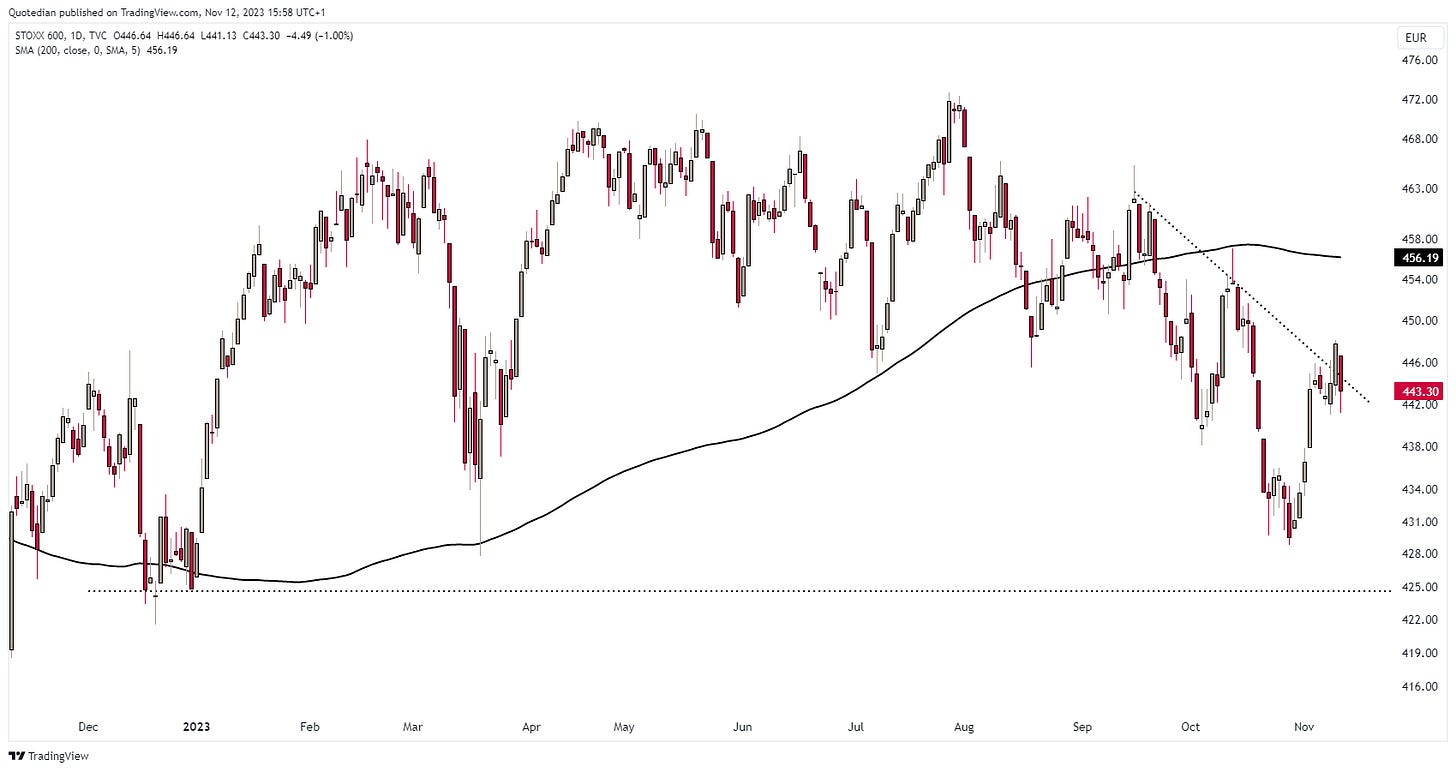
On the broader STOXX Europe 600 index (SXXE) that target is still a bit further away, but again, the chart has the potential to start pleasing the bulls:
Let’s have a look at how the best-performing stocks in Europe and the US this year have behaved over the past five days.
Starting with Europe, it was a good week for most stocks which are already having a good year:
Rolls-Royce for example, continues to ‘fly’:
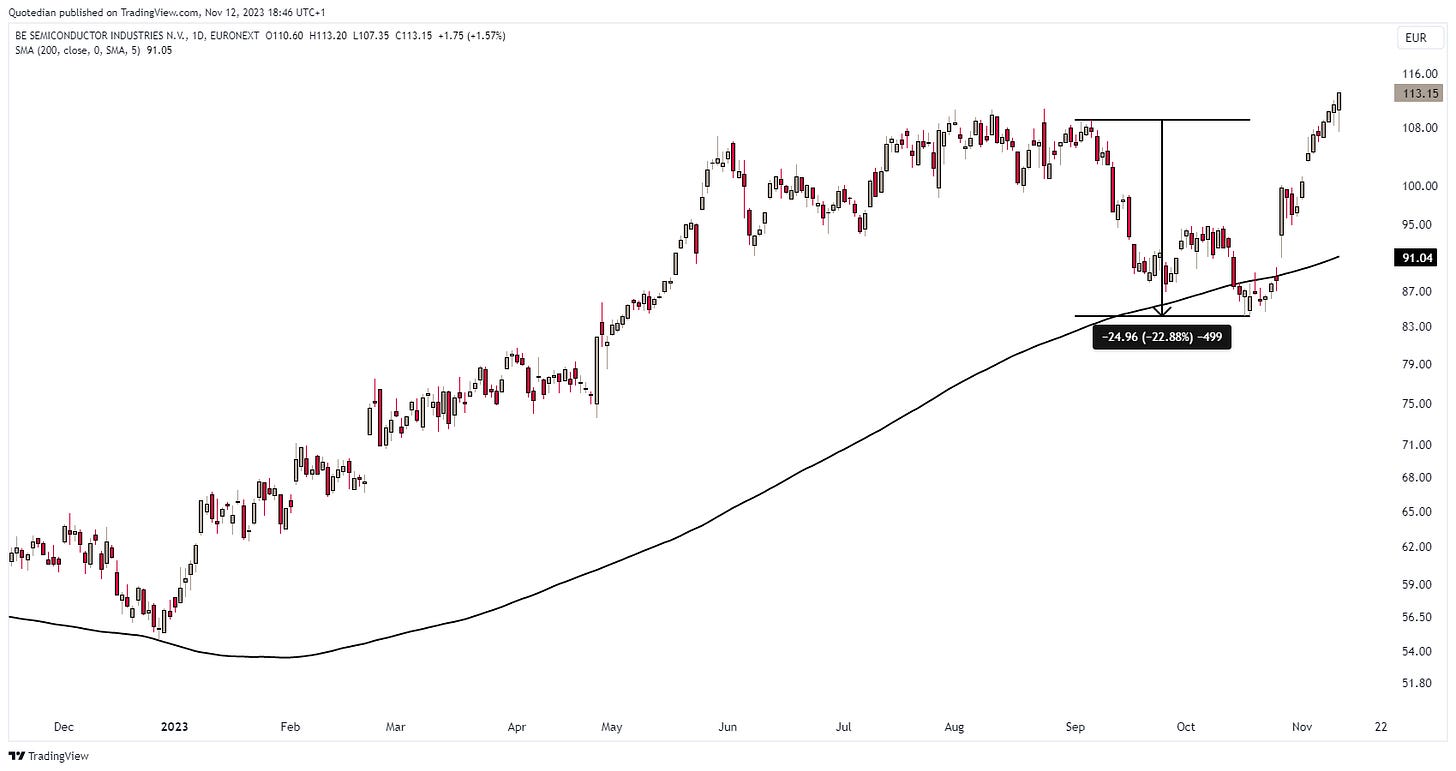
Not a bearish chart. Neither is the one of BE Semiconductors, which has recovered at a speed of 8.42938 GHz from a 22% plunge in September/October:
As a matter of fact, the entire semiconductor sector, in the following chart depicted via the Philadelphia Semiconductor Index (SOX) is showing a bullish constellation, and could be closing in on the 2021 all-time high (ATH) soon:
Turning to the top performing US stocks this year and their fortunes over the past five days, we note a similar extension of gains as observed in Europe:
On the chart of “Ueberflieger” NVDIA it is hard to recognise that the correction in October was actually to the extent of 20%:
Twenty percent(!), however, it didn’t even quite touch its 200-day moving average …
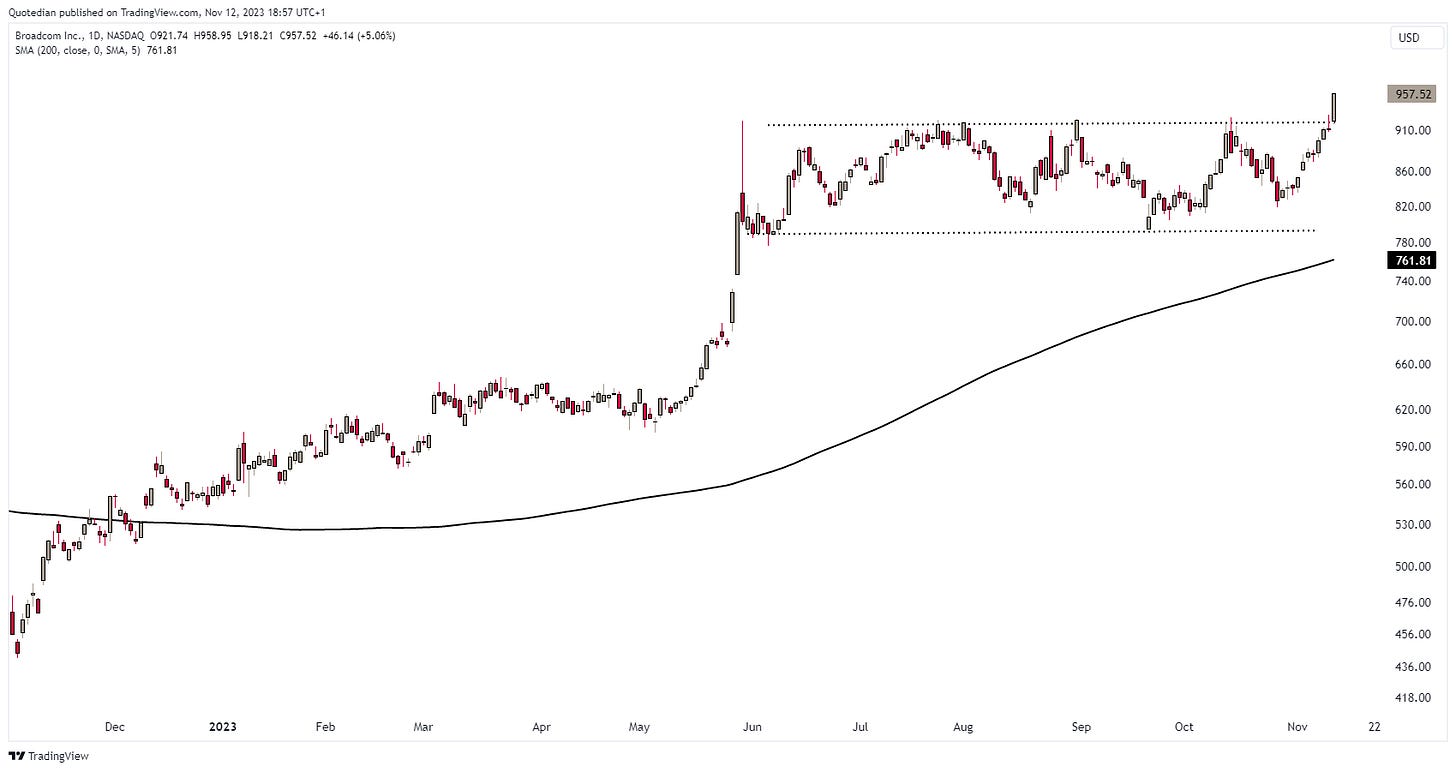
One stock, Broadcom, is already flying to new ATHs:
And talking high-flying stocks such as Broadcom for example, many of them are part of our Focus List of recommended stocks. Interested to see more?
Interested in our Focus List of Recommended stocks, bonds and funds? Become a client!
Contact us at ahuwiler@npb-bank.ch
Another stock on our recommended list of equities is Novo Nordisk - though pretty expensive already, good news is not abating for the company behind the weight-losing drug Ozempic:
´Hhhmmm… maybe better use a Log-scaled chart?
Yes, better, much less Vertigo!
Ok, time to wrap up the equity session and head over to bonds.
The focus of the week was the terrible 30-year US Treasury auction, which led to a spike in yields but also to the negative outside day on stocks as described above. However, markets got over it quite quickly, as the following 5-minute chart of the 30-year US yield shows:
The other theme of the week just gone by was, as we had discussed in the previous Quotedian, that FOMC members would be busy with hawkish talk, after stocks had rallied hard on the Fed pause and ‘dovish’ Treasury issuance calendar two weeks ago.
Result? Zero net progress in either direction on the 10-year Treasury last week (rectangle):
The curve steepening process has paused but continues in its well-defined uptrend and we would expect a positively sloping yield curve by Q1 2024:
Looking for something even more boring than a Sunday without money to spend? Here’s the chart of German 10-year yields (as a proxy for European rates):
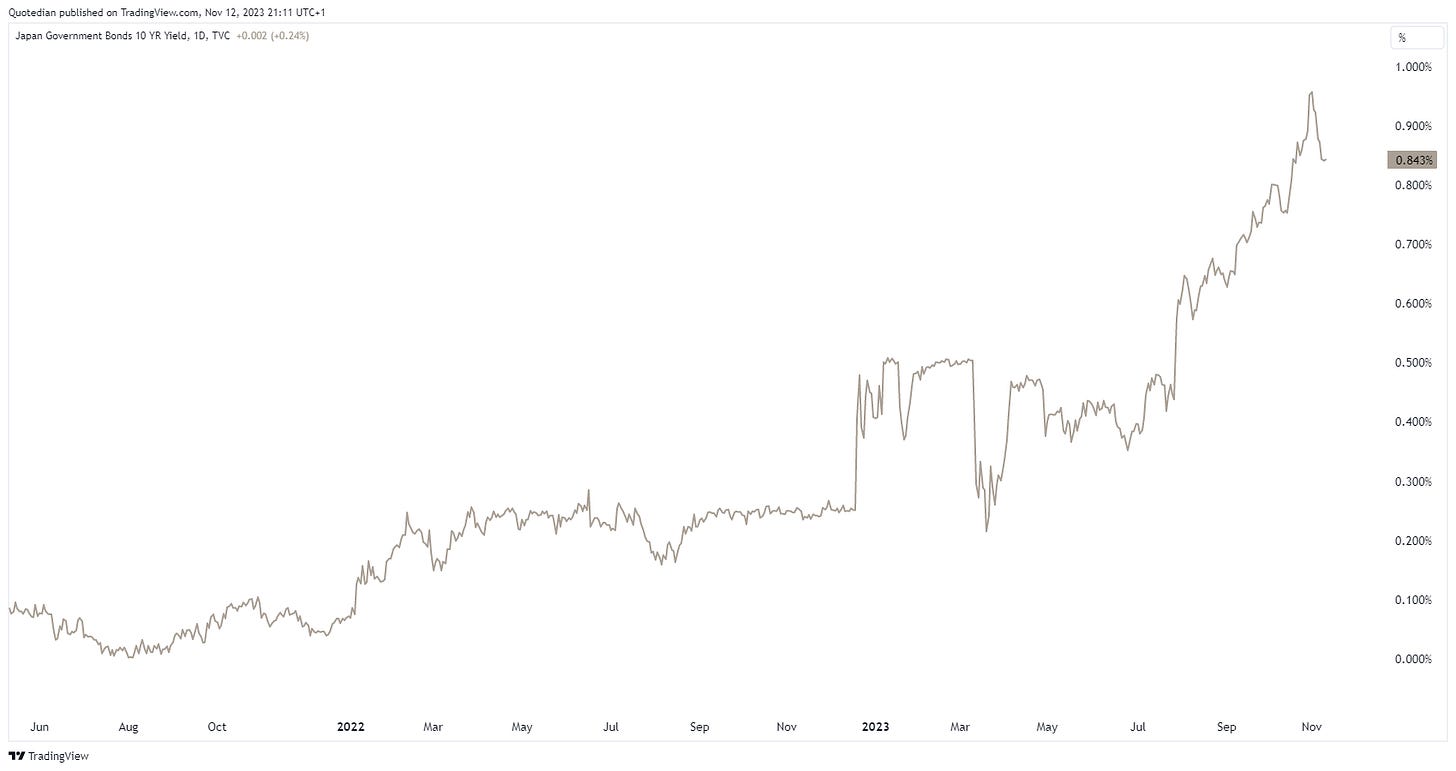
Who would have guessed that the chart of Japan’s JGBs are a firework in comparison:
Having said that, that market was “kaputt” for nearly a decade too (red triangle) - make sure to check out the y-axis for the range:
Before we get “range depression” symptoms, let’s hurry over to currencies …
And in order to avoid range-depression, let’s start with the most exciting currency chart … Bitcoin!
At >$37,000 that is 125% performance year-to-date … not bad, I’d say.
Other than versus, cryptocurrencies, the US Dollar did not have a bad week at all:
This is how those Dollar gains look like on the DXY:
Investors are continuing to push to see the resolve of Japan’s Ministry of Finance (MoF) regarding currency intervention:
Either this is an even greater widow-maker trade than being short JGBs over a thirty-year period, or, as I believe, once the Yen continues to start gaining it will be a huge carry-trade unwind which will end in tears not only for Mr and Mrs Watanabe …
Finally, moving into the commodity space, we observer that Gold has corrected a bit deeper than the Bulls would prefer:
The 200-day moving average needs to hold, otherwise ‘things’ become more complicated.
Oil (WTI) saw the shoulder-head-shoulder pattern triggered we discussed here a week ago.
USD66 the target, which is clearly recession territory.
Uranium continues to be one of my favourite commodity ‘plays’, but a cooling down period (pun intended) seems necessary, given the distance to the 200-day moving average:
As today’s title suggests, Size Matters, and having it small has not paid off recently. Well, let’s cross out recently, as the following chart suggests:
Investing into US Small Caps has been a zero-sum game if you invested in 2002, and for now, no end is in sight.
In Europe, the situation is slightly better (if you went long small cap versus large cap in 2002), but the last few years have been extraordinarily painful too:
Conclusion: Size matters
Everything in this document is for educational purposes only (FEPO)
Nothing in this document should be considered investment advice
The views expressed in this document may differ from the views published by Neue Private Bank AG
Past performance is hopefully no indication of future performance


