

The Wall
Vol VIII, Issue 20 | Powered by NPB Neue Privat Bank AG

“All in all, it's just another brick in the wall”
— Pink Floyd
Enjoying The Quotedian but not yet signed up for The QuiCQ? What are you waiting for?!!

Of course does this week’s title of The Quotedian not refer to the absolutely brilliant Pink Floyd song “Another Brick in the Wall”, but rather to equity markets once again climbing to new all-time highs despite all the adverse “news”.
But, just in case you are a lover of big, big fantastic genre-changing songs such as Bohemian Rhapsody or the aforementioned “Another Brick in the Wall”, here’s the link to the latter to accompany your reading today:
Before we dive into the analysis of who is likely to win the bull/bear race,

let me start with the conclusion:
No Freaking Clue!
HOWEVER, here at NPB Neue Privat Bank AG we have been working relentlessly for months on a new strategy, which has the premise of taking out most of the guessing game. In our shortly-to-be-released new strategy, dubbed “Kairos”, we will seek to get rid of most directionality of markets and position portfolios for more sideways returns as much on the fixed income as on the equity side. Without spilling all the beans, this will of course include the substantial use of alternative strategies (alt liq), but if you want to find out more and hear about the newest developments and roll-out of “Kairos”, drop an email to
kairos@npb-bank.ch
and we will include you on this exclusive list.
AAANNNDD…
… off we go to the races!

The Wall of Worry seems (once again) mightier than ever:
Israel vs. Iran War
Possible shut-down of Strait of Hormuz
Trump Trade Tariff Tantrum
US Fiscal Deficit
Fed not cutting rates
Taiwan Invasion (2028 edition)
OBBBA (One Big Beautiful Bill Act)
Labor Market
Sticky Inflation
Russia / Ukraine (ongoing)
etc
etc
etc
However, whenever an investor feels overwhelmed with such a sheer amount of bricks in the wall of worry, glancing at the following chart should give some immediate anxiety relief:
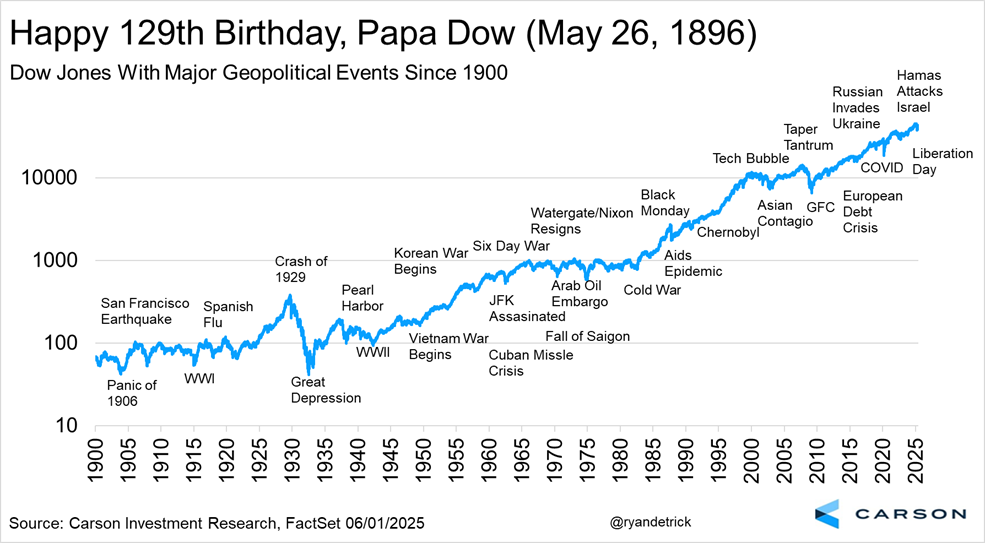
So, on the long-run that’s about a 7% return p.a. with dividends reinvested, but of course market bears will quickly refute the preceding by countering that on the long-run, we are all dead. And indeed, if you bought in late 1929 the very market top, it took you quite a while (quite a while = 25 years) to be break-even again. Could it happen again? Of course! It just has in Japan, which only last year reached a new ATH (Nikkei), some 25 years after the 1989 market top. And it is actually one of our assumptions that this may be the case again for the US market, hence our aforementioned “Kairos” project. For example, is the equity risk premium in the US now negative, something that has not been the case since the late innings of the Dotcom bubble:

But here we focus on a bit more on the short- to intermediate term, hence let’s continue doing just that.
Stock market bulls are probably feeling a bit frustrated this year, especially with their US equity portfolio. They shouldn’t, as year three of every bull market in the past 50 years has seen this sideways turning and churning as the following chart neatly shows:

Sideways and then out of the blue, the uptrend resumes. And that moment of a bull-trend resumption may be not long off, given that the accumulative advance-decline (red line, lower clip) spread on the S&P 500 (grey line, upper clip) has broken out to new cycle high already in early May, leading the index higher:

Now, naysayers would quickly point out that sentiment is becoming a bit overly bullish again, which should be interpreted as contrarian, i.e. a negative sign. And indeed has the AAII Bull-Bear spread moved decisively into bullish territory (red circle) after having been overwhelmingly negative since the second week of February:
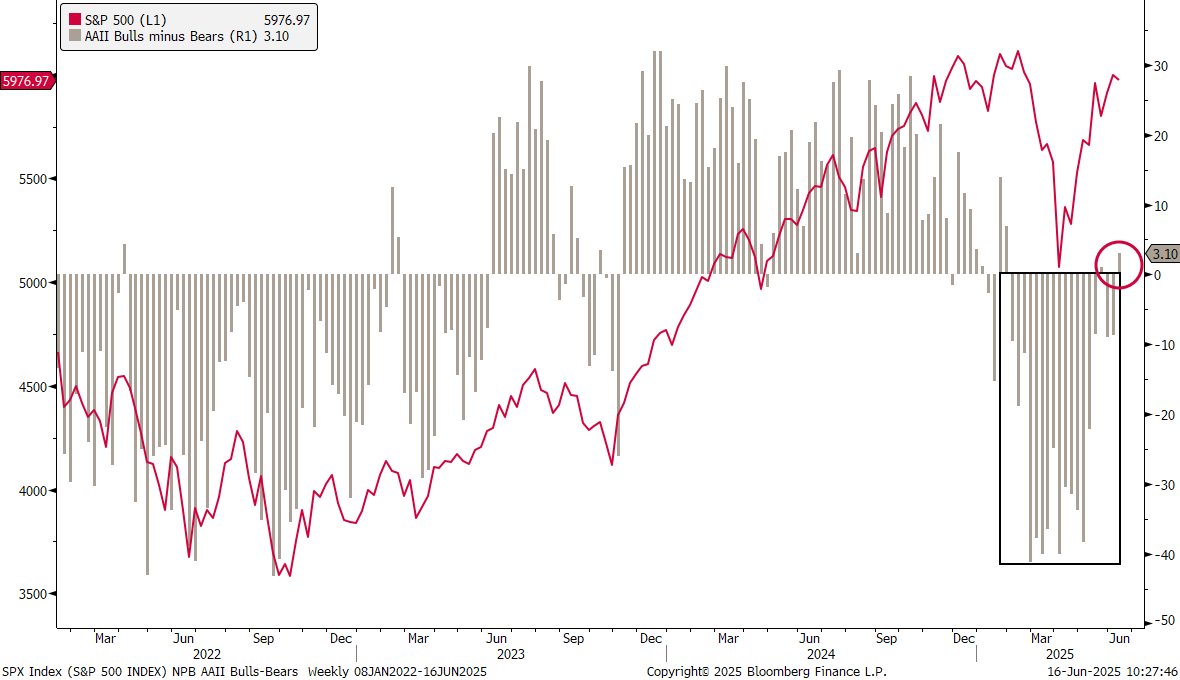
However, as the following (slightly massaged, aka data mining) statistic shows, is are future returns on the market pretty positive when the AAII Bulls-Bears spread moves into switches to positive after having been negative for a prolonged period:

Pulling up a daily chart on the S&P 500 mini-futures (ES1), we quickly note that early signs of panic following the Israeli attack on Iran on Friday have already been brushed away again:

As a matter of fact, the index remained well above the 200-day moving average which I had cited a possible target in Friday’s QuiCQ (click here).
With the index less than two percent away from a new ATH in the face of the increasing geopolitical tensions, it is hard to interpret that as bearish.
Turning to Europe, the STOXX 600 index looks a bit top heavy today,

however, looking under the hood we note 34 new 52-week highs versus only three new 52-week lows:

The index’ advance-decline ratio (red line, lower clip) then confirms the broad participation of the SXXP (grey line, upper clip) in the ‘rally’, similar as previously observed in the S&P 500:

UK stocks (FTSE 100) are seemingly ready to push into uncharted territory:

Interestingly enough, have UK mid-cap stocks (FTSE 250), which are more exposed to the domestic economy, outperformed their large-cap peers since the post-Liberation day bottom on April 7th:

The Swiss market (SMI) continues to be a laggard and the chart does not look overly constructive:

This comes a bit as a surprise, given the amount of Swiss Francs are being bought for “safe haven” purposes. Given that the Swiss National Bank (SNB) will reinstate a ZIRP policy again this Thursday, and 2-year Treasury bonds are firmly in negative territory, I would have expected the stock market to be more bid.
Admittedly, when checking in on the Solactive Swiss Equal-Weight index, which consists of Switzerland's 20 largest companies, the picture looks a tad more constructive:

Over in Asia, Japan’s Nikkei 225 seems ready for a break higher now:

Let’s skip other Asian markets this week and have a look at the following two interesting factor-charts. First up, Global Value continues to work (circle) for now as pair trade over Global Growth:

However, it is important to note that it has been working much better in Europe than in the USA:

As a matter of fact, it continues NOT to work in the US …
Quick check-in on sector performance/rotation now:

Industrials remain the top contender for the sixth week now. Interesting is that technology stocks have fought back their way to the number two spot. But most interesting I find the momentum pick-up we see in Energy stocks. Let’s check on Bloomberg’s RRG function whether we find a similar message:
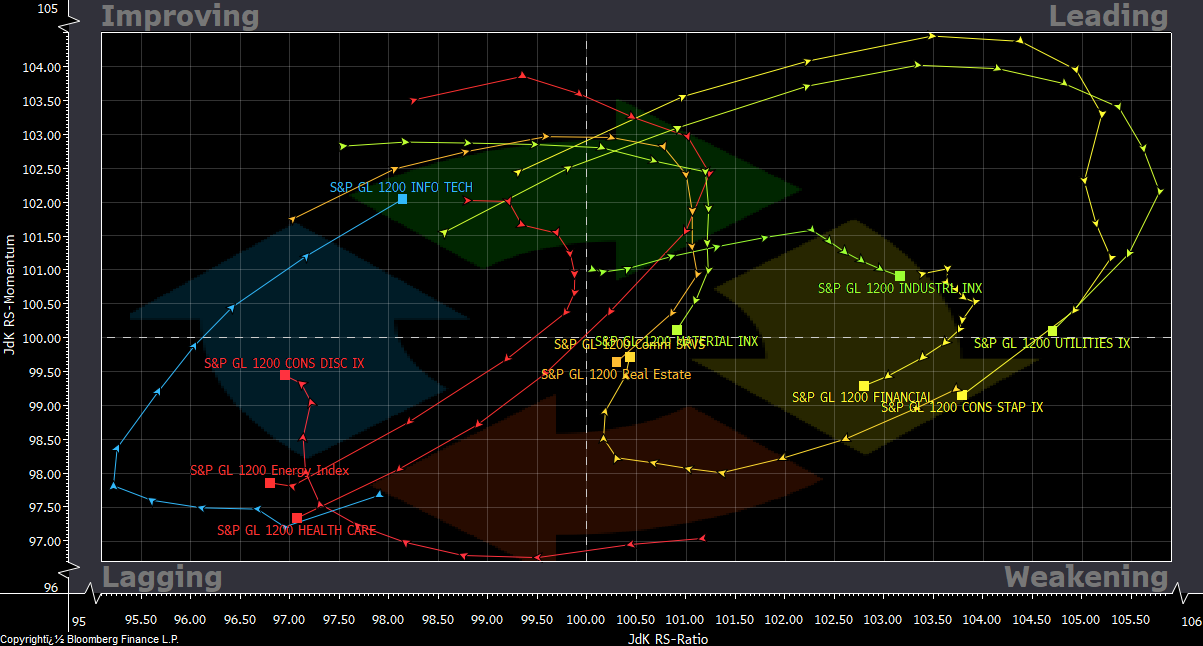
Clearly Industrials are in the leading sectors, but may be losing momentum, whereas tech stocks are just about to move into the leading quadrant. Energy stocks are still downbeat albeit bottoming out. Maybe some further consolidation is needed?
Finally, the end the equity section, here are our usual tables of the best performing stocks in the US (S&P 500) and in Europe (STOXX 600) on a year-to-date basis and how they have behaved over the past week. With further ado:
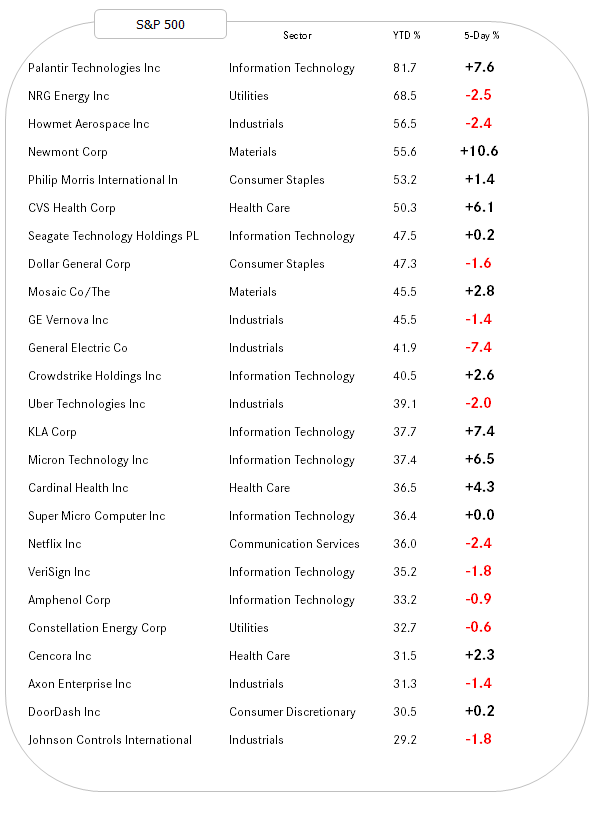
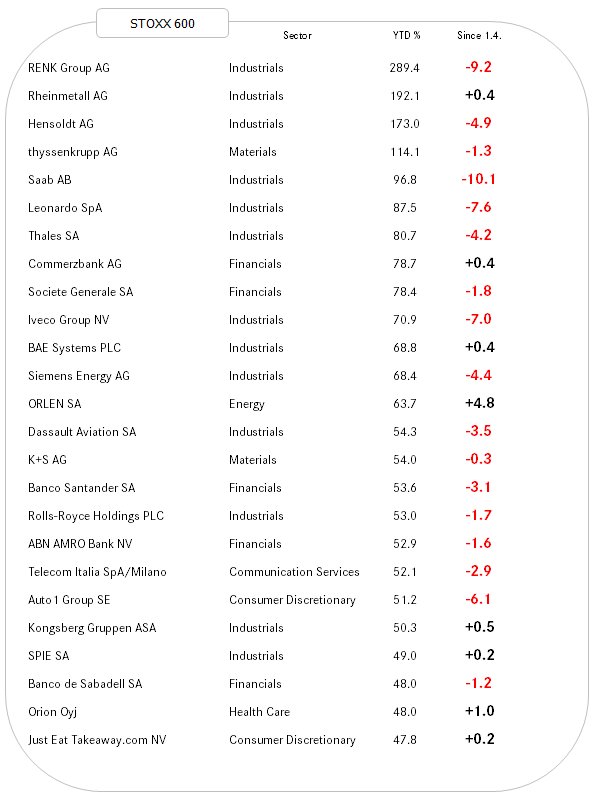
Both regions have seen some of their best performing stocks giving back some gains, which is most likely attributable to Friday’s weakness. With markets up today Monday, some of this is probably already unwound again.

Not much time to be spent in the fixed income segment this week, as interest rate are (attention: oxymoron ahead) wildly moving nowhere. Here’s the 10-year US treasury yield chart as proxy for the entire global rates complex:

One interesting chart that continues to intrigue me is that of the iShares 20+ Year Treasury Bond ETF (TLT):

Equity investors … remember that this is not necessarily a function of demand and supply or even support and resistance, but rather mathematically depending on the the path of interest rates. A break lower would be fascinating to observe…
Whilst recent action on bond markets has been (attention: next oxymoron coming up) excitingly boring, this week it could get excitingly exciting with several central banks due to announce their interest rate policies.
In order of appearance …
The Bank of Japan (BoJ) is due to update on their monetary policy tomorrow, where no change is expected:

Next up, the mighty US Federal Reserve Bank on Wednesday (European) evening. Last week’s benign inflation number was not enough for futures markets to expect a rate cut already at this meeting:

Thursday, the Swiss National Bank (SNB) is prone to reinstate ZIRP again, with NIRP expected by the end of the year:

And finally, the Bank of England (BoE) is expected to stay put on Thursday lunchtime:


Last week saw the Dollar Index (DXY) go through a seesaw of emotions as first it broke through key support (dashed line) on Wednesday/Thursday post the ‘weak’ CPI number, then rallied on Friday as a safe haven function as the war between Israel and Iran erupted, only to today break decisively lower again:
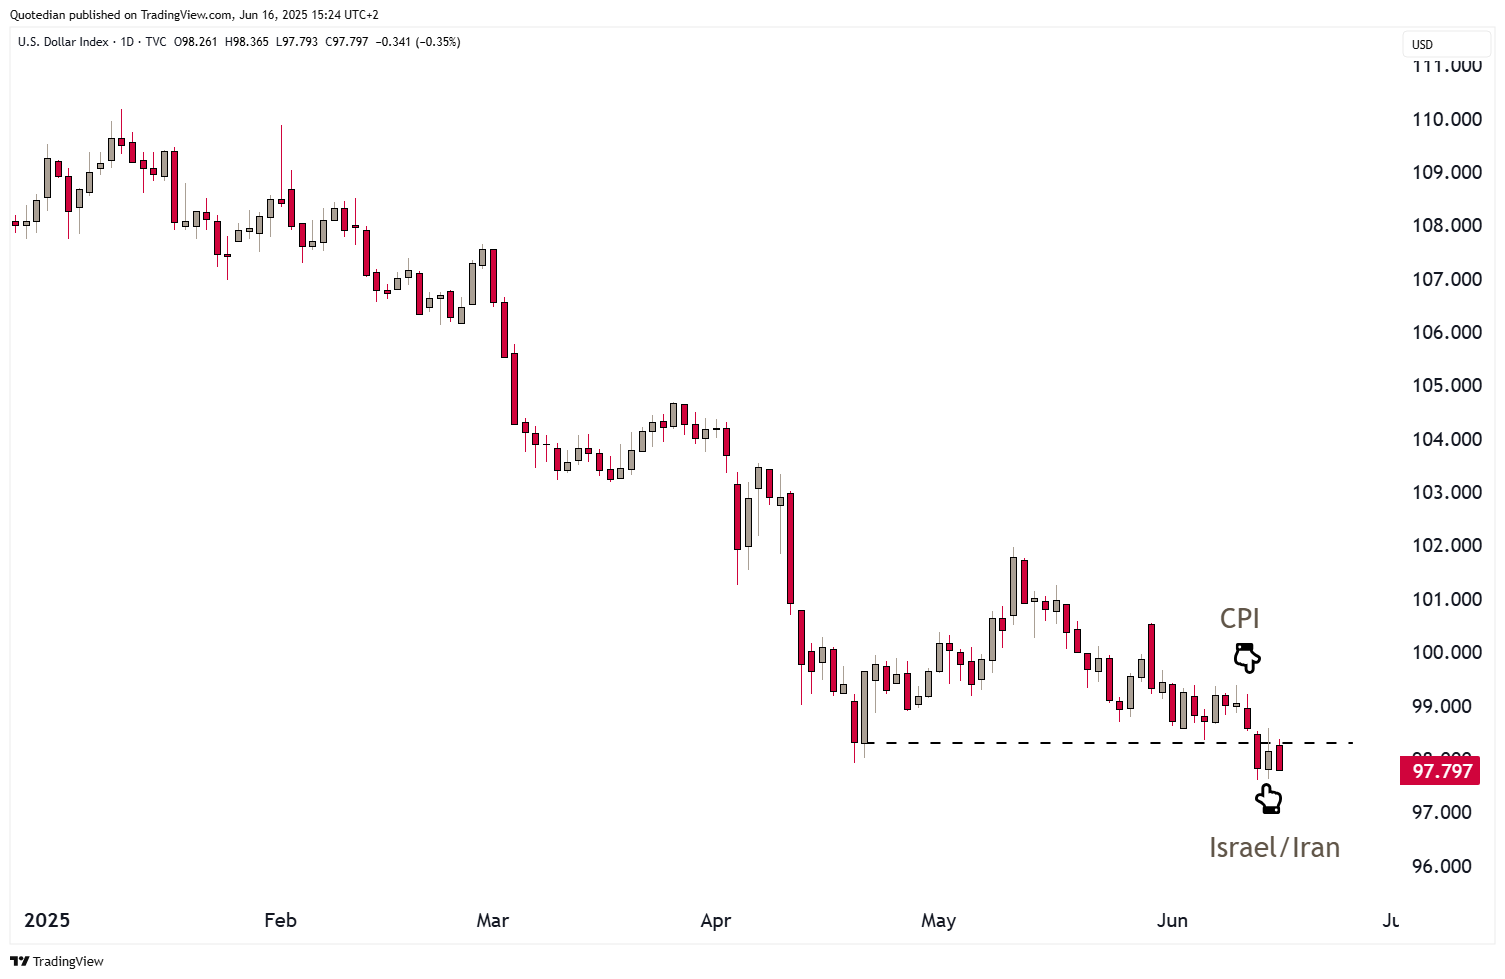
The failure to follow-trough on the upside given the rising geopolitical tension is prove to me of the structural weakness of the Greenback and indication that substantial more downside may lay ahead. In that context, the DXY is on its way to test a 14-year uptrend:

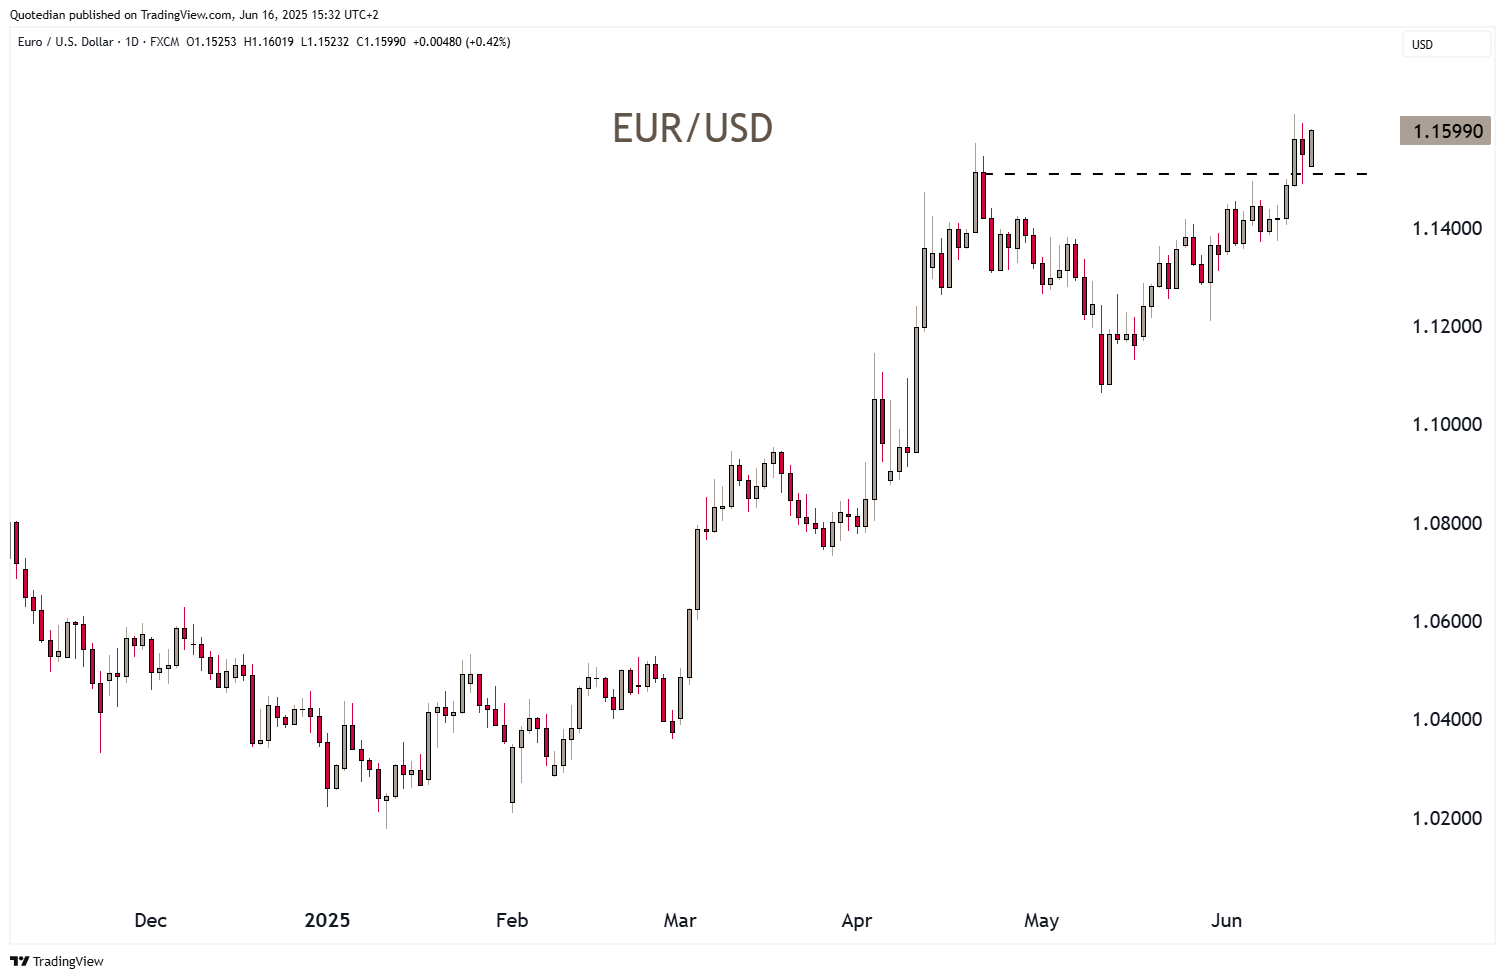
Here’s how the Dollar weakness translates onto the EUR/USD chart:
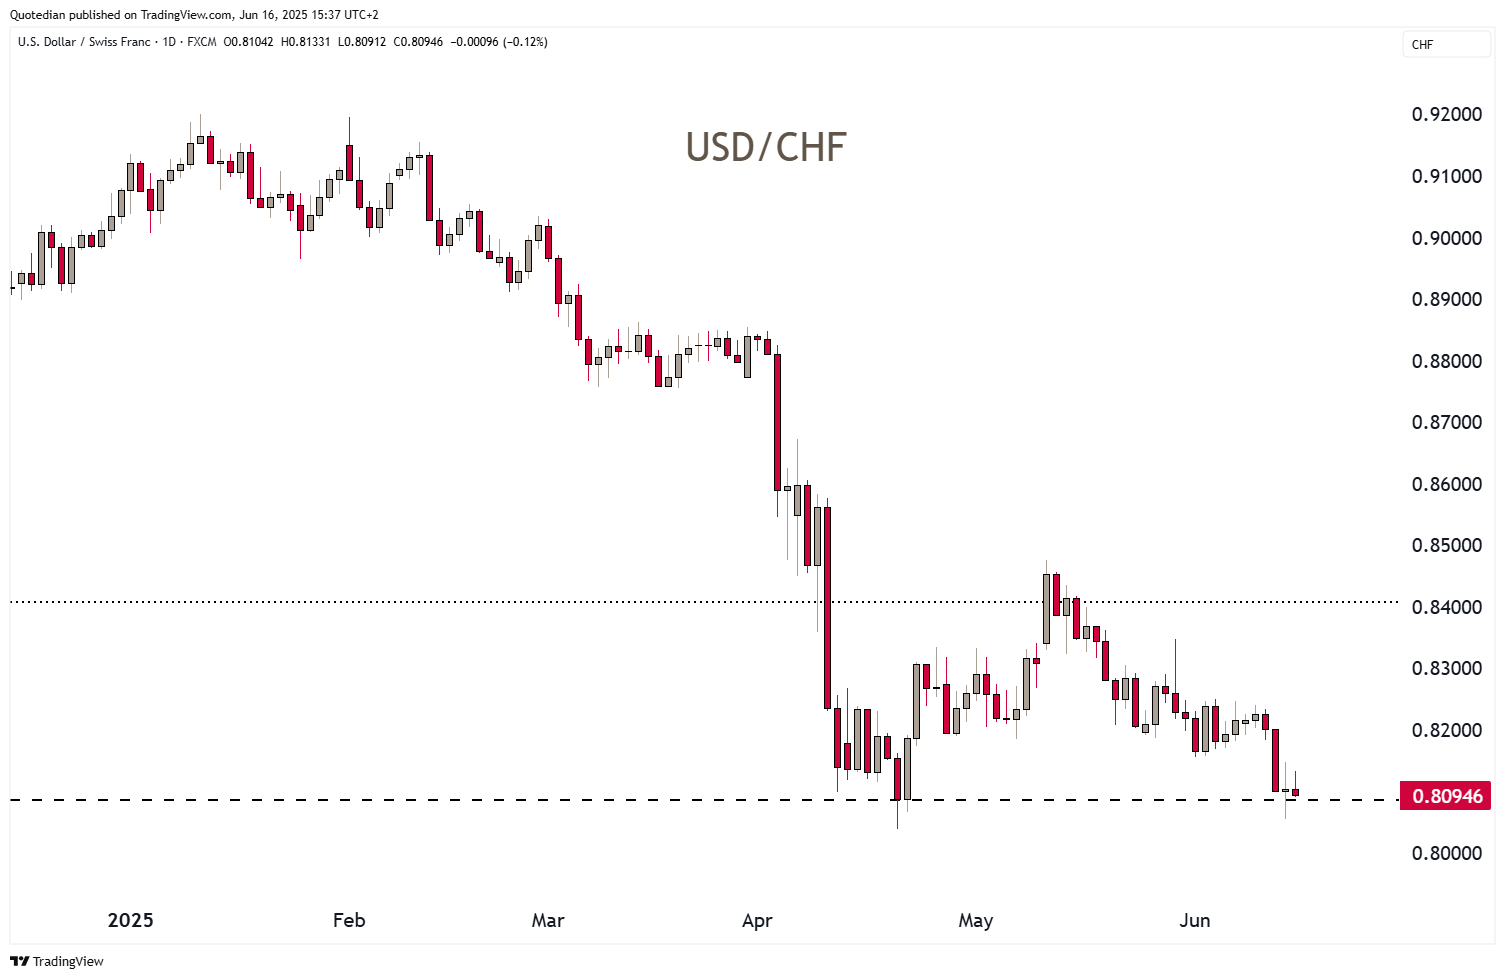
Definitely worthwhile observing this week should be the USD/CHF, as the currency pair is scratching at the lowest levels the black hole of 2012, where the SNB came in and decided to peg the Swiss Franc to the Euro.

Now remember back from the fixed income section above, that the SNB is set to meet this week and lower their key policy rate to Zero … and maybe something more …?? Here’s a close-up of the same currency pair:
Bitcoin got stuck at around the 110k mark last week:


Turning the commodities, a break below the 14-year uptrend line in the US Dollar discussed above would obviously enormously help the entire commodity complex.
Not that Gold would need any particular help with its rally:

Gold has more than doubled since 2022, and on a non-log chart looks absolutely brutal:

Here’s log version of the same to clam down your excitement (a little bit):

And finally, a close-up of Gold, illustrating how close the shiny yellow metal is to a technical break-out of its ascending triangle, which would give a price target count up to somewhere around 4,500(!):

We have discussed in this space in the past (click here) that every reserve currency looses its status after about a hundred years:

But then we wondered which currency may take over that honour from the US Dollar. The answer may lay in this chart:
. | Liam Dawson, CFA CAIA FDP")
Other precious metals have now started to play catch-up with the Gold performance:

The Israel-Iran conflict has accelerated a rally in oil, bringing the Brent and WTI barrel prices above their respective support levels which had been broken in April post-Liberation Day:

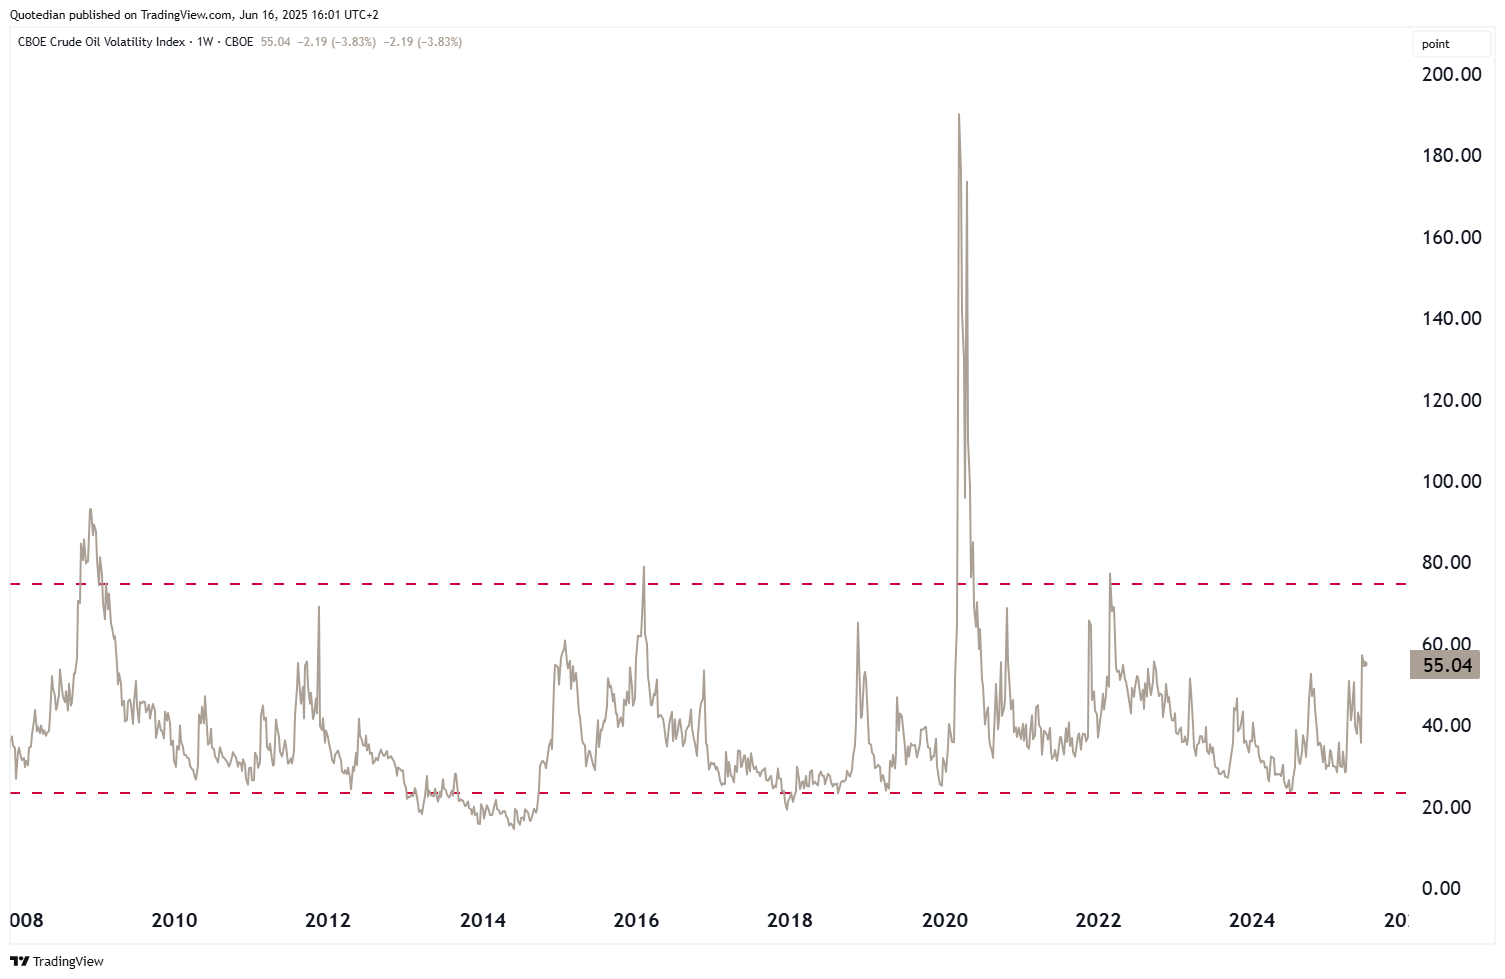
A better way to “play” oil is probably to buy oil volatility, which should remain elevated no matter the Hormuz outcome:
Alright, time to hit the send button. Please remember that you can ask question, give feedback or challenge my assumptions anytime via the comment section on Substack:
Not trying to shoot myself in an already busy foot, but it would be nice to get some conversation(s) going within our little Quotedian/QuiCQ family.
Have a great week and let’s keep climbing that wall!
André
P.S. And click that ‘Like’-Button pleeeeezzzeee

In reality, you need no other Disclaimer than the one above, but just in case:
Everything in this document is for educational purposes only (FEPO)
Nothing in this document should be considered investment advice
Investing real money can be costly; don’t do stupid shit
Leave politics at the door—markets don’t care.
Past performance is hopefully no indication of future performance
The views expressed in this document may differ from the views published by Neue Private Bank AG
It is extremely difficult to differentiate between the short and medium/long term at the moment. As I assume that this time is no different, and therefore the key figures of valuation/profit margins etc. remain unchanged, there is a high, indeed very high probability that there will soon be some very lean stock market return years....(probably for 5-10 years).
The market is driven by the hope, glass-half-full mentality. As Marko Papic said, the market is currently looking through everything. The hope that everything can be better in a few months is the oil that continues to fuel the market, alongside the balance sheets pumped up by QE and fiscal spending. Any attempt to short except for a few % will burn your fingers.
Looking back, I am sure that all the ingredients for a bubble could then be clearly identified. We know exactly these ingredients now, but they are currently being interpreted differently.
If the market then collapses, it will probably fall significantly below these critical thresholds (-20%), because only then will the BTFD logic become untenable.
Until then, be with one foot at least in the market, but be ready, have hedges ready. Then, like André, concentrate on sideways returns for many years - I am all in favour of this logic