

This Is The End
Vol VII, Issue 46 | Powered by NPB Neue Privat Bank AG

"Every new beginning comes from some other beginning’s end."
— Seneca

This is The End of The Quotedian

for this year.

Today’s letter brings the seventh year of The Quotedian in its current form to an end. But on-and-off and in different forms and shapes, I have been writing on markets for well over twenty years now. As they say, time flies when you’re having fun…
Of course, today’s letter could have had much cooler titles, with the top contenders being:
Quantum of Solace

or
Quantum Leap

or even
Willow

Of course, all of this titles are a nod to Alphabet’s (company formerly known as Google) introduction last week of their quantum computing chip dubbed “Willow”.
As per Forbes:
To put it in perspective, Willow's computational power is staggering. It can solve a complex calculation in under five minutes, taking the fastest classical supercomputer around ten septillion years to complete. Yes, septillion — as in a one followed by 24 zeros
For more, click here or watch this:
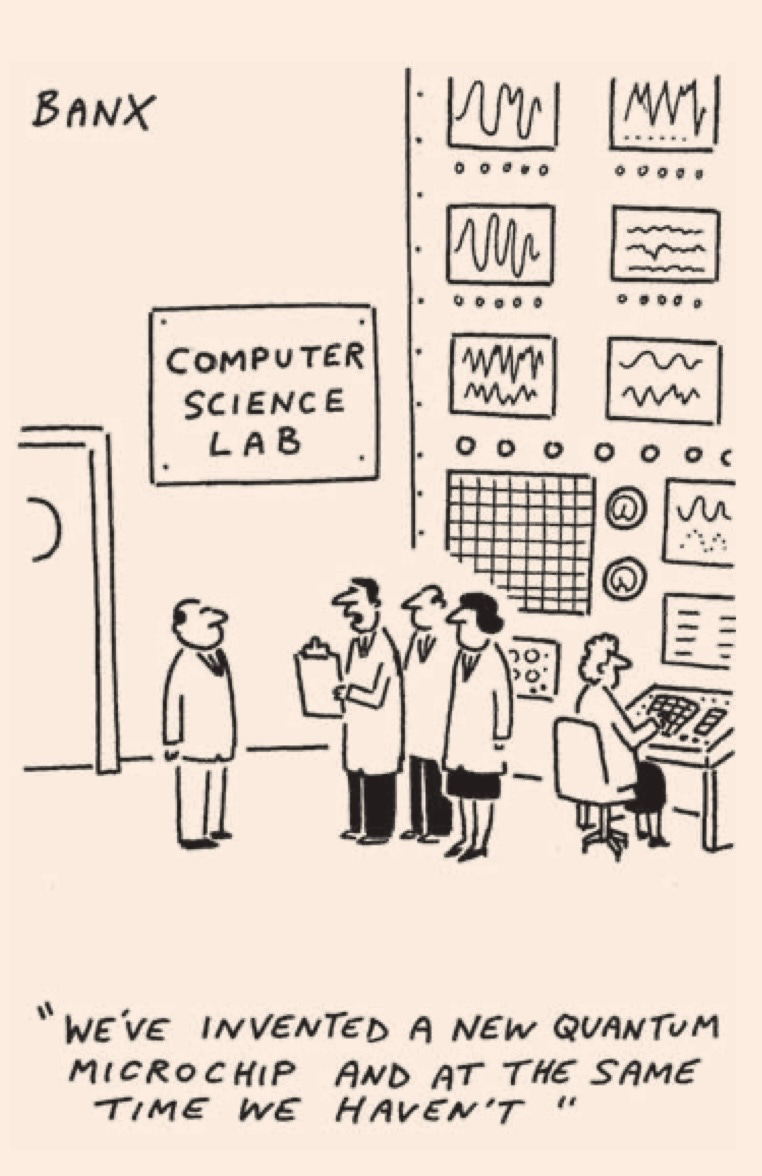
And finally, all this lengthy introduction only to be able to place this silly cartoon:
Anyway, this week’s Quotedian, the final for the year of 2024, will be (even) a bit more chaotic than usual. A tidbit or potpourri or Tohuwabohu of financial observations and charts … ENJOY!!

To start, equities, as measured by the MSCI World Index showed negative weekly returns. This is quite scandolous, as it is the already the 18th time this happened this year:
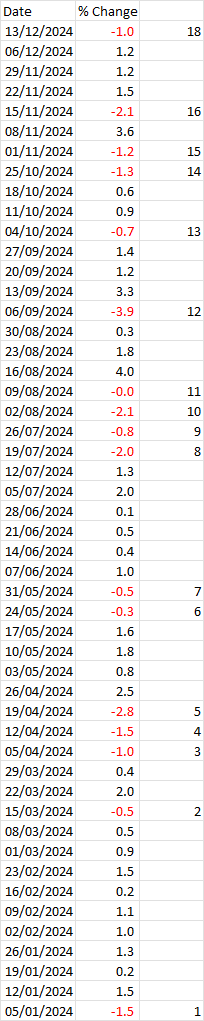
Yes!
Of course!
Big time tongue in cheek!!!

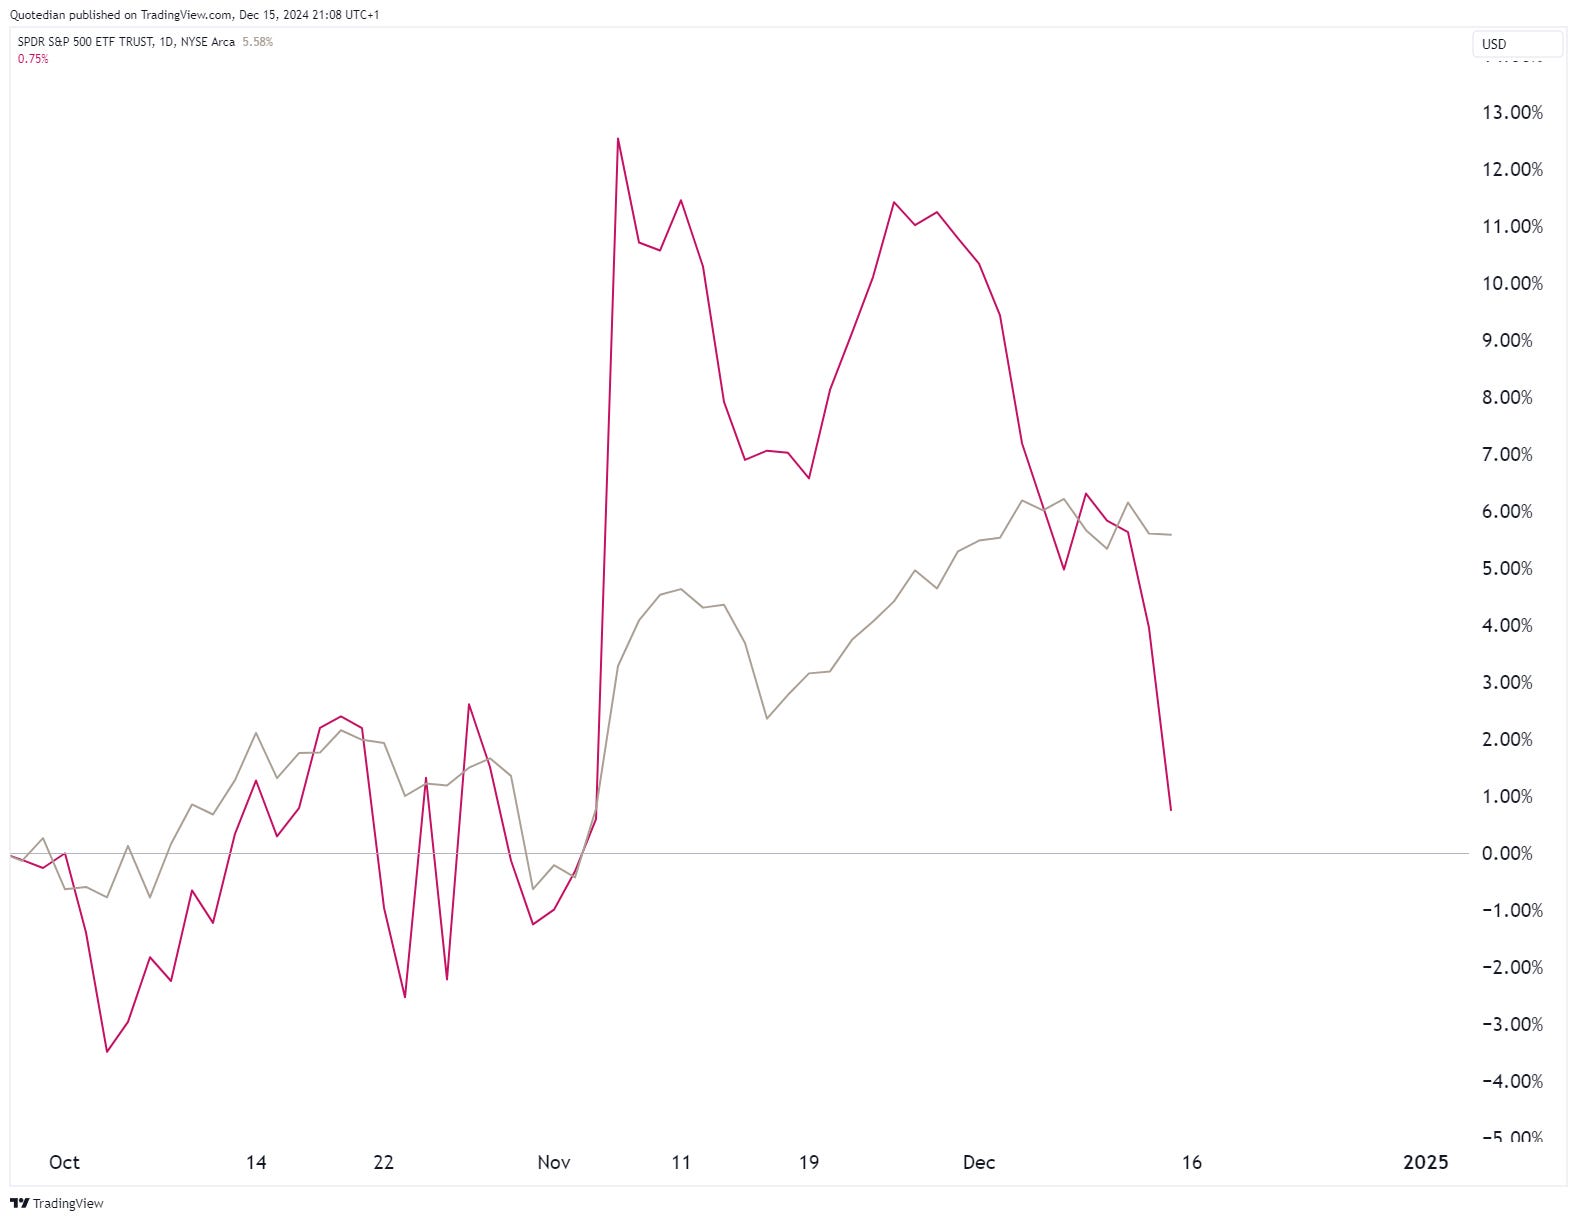
For the S&P, that weekly “down” looks as follows:

Scary, right?
On the daily chart, not even Friday 13th can add some “thrill”:

Of course, we have heard a seemingly endless series of comments of how only the Mag 7 have been upholding order in the village over the past few weeks. And even I highlighted via our daily letter,
that for the past two weeks more stocks have been moving down than up.
A few points on this:
(1)
This has led to the McClellan Oscillator to be pretty oversold, which during the current bull cycle has had following outcome:

(2)
Yes, the equal-weight index (red9 has diverged recently from the equal-weight (grey) S&P 500:
But in the most recent uptrend cycle (grey channel), these ~3% have been very common:

(3)
From a “macro” point of view, the Mr. Market seems to have decided that the current Fed easing cycle is one of the good ones:
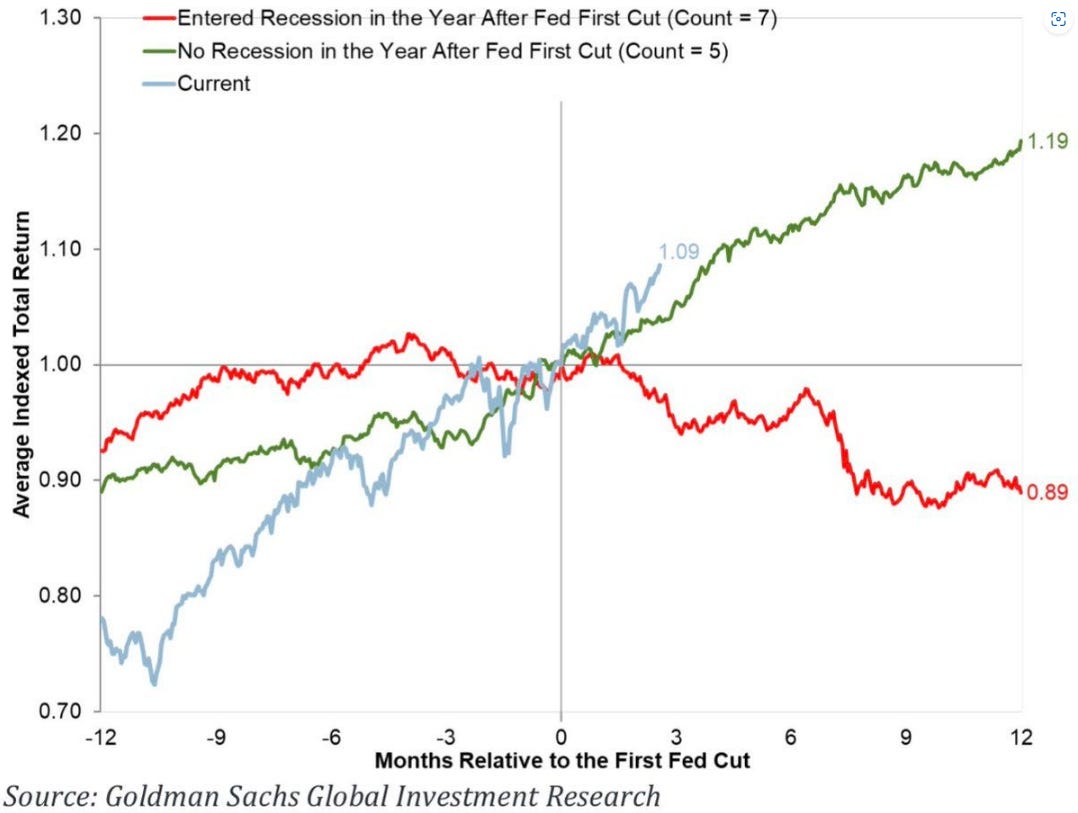
(4)
Finally, in our series of bullish comments, here’s a comment and chart we already showed last week in a QuiCQ post:
We all have seen these “if history repeats” overlay charts, where the current period is compared to a previous period. Normally, these are doomsayers charts where the overlay suggests that a imminent crash (aka “end of the world”) lays ahead.
Well, I have found a much more pleasant one, that compares the roaring 20’s a hundred years ago to the roaring 20’s nowadays. I have long been saying that the introduction of ChatGPT to the world is comparable to the introducing of Netscape (that was the first useful web-browser, for the younger folks out there) in 1994. What ensued was a wild six to seven year rally into the bubble top in 2000:

In conclusion, I am well aware that everybody is pointing out how crazy everything is right now, but in the meantime … Party on Wayne!

Or, in other words, and what a Freudian food-for-thought-festival that is, everybody is bearishly pointing out how bullish everybody is. Endless charts of mania, hype and tulips …
In the meantime, we who prefer NOT to follow the broken watch model,
 - S01E06 Drama | Video gifs by quotes | 278093c7 | 紗")
can enjoy the extra returns - for now.
Other markets now …
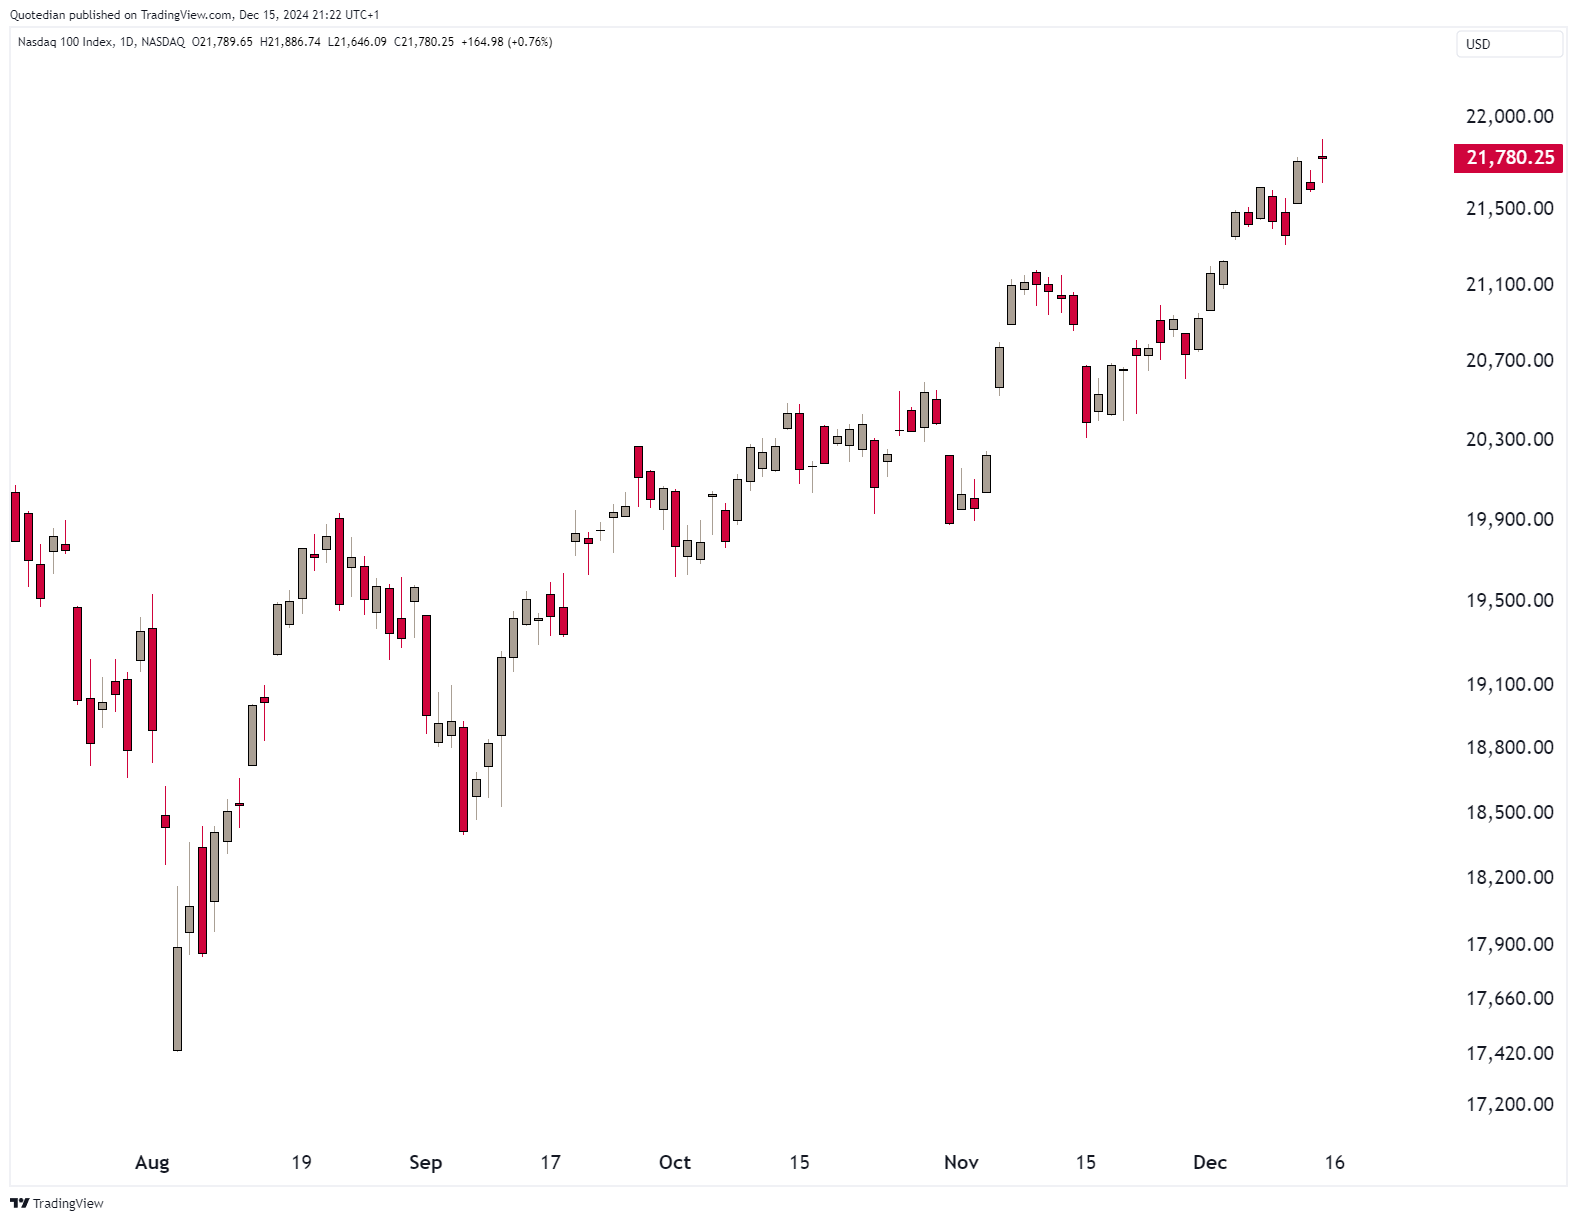
Nasdaq 100 - not bearish:
Here is Europe’s STOXX 600 index - not bullish:
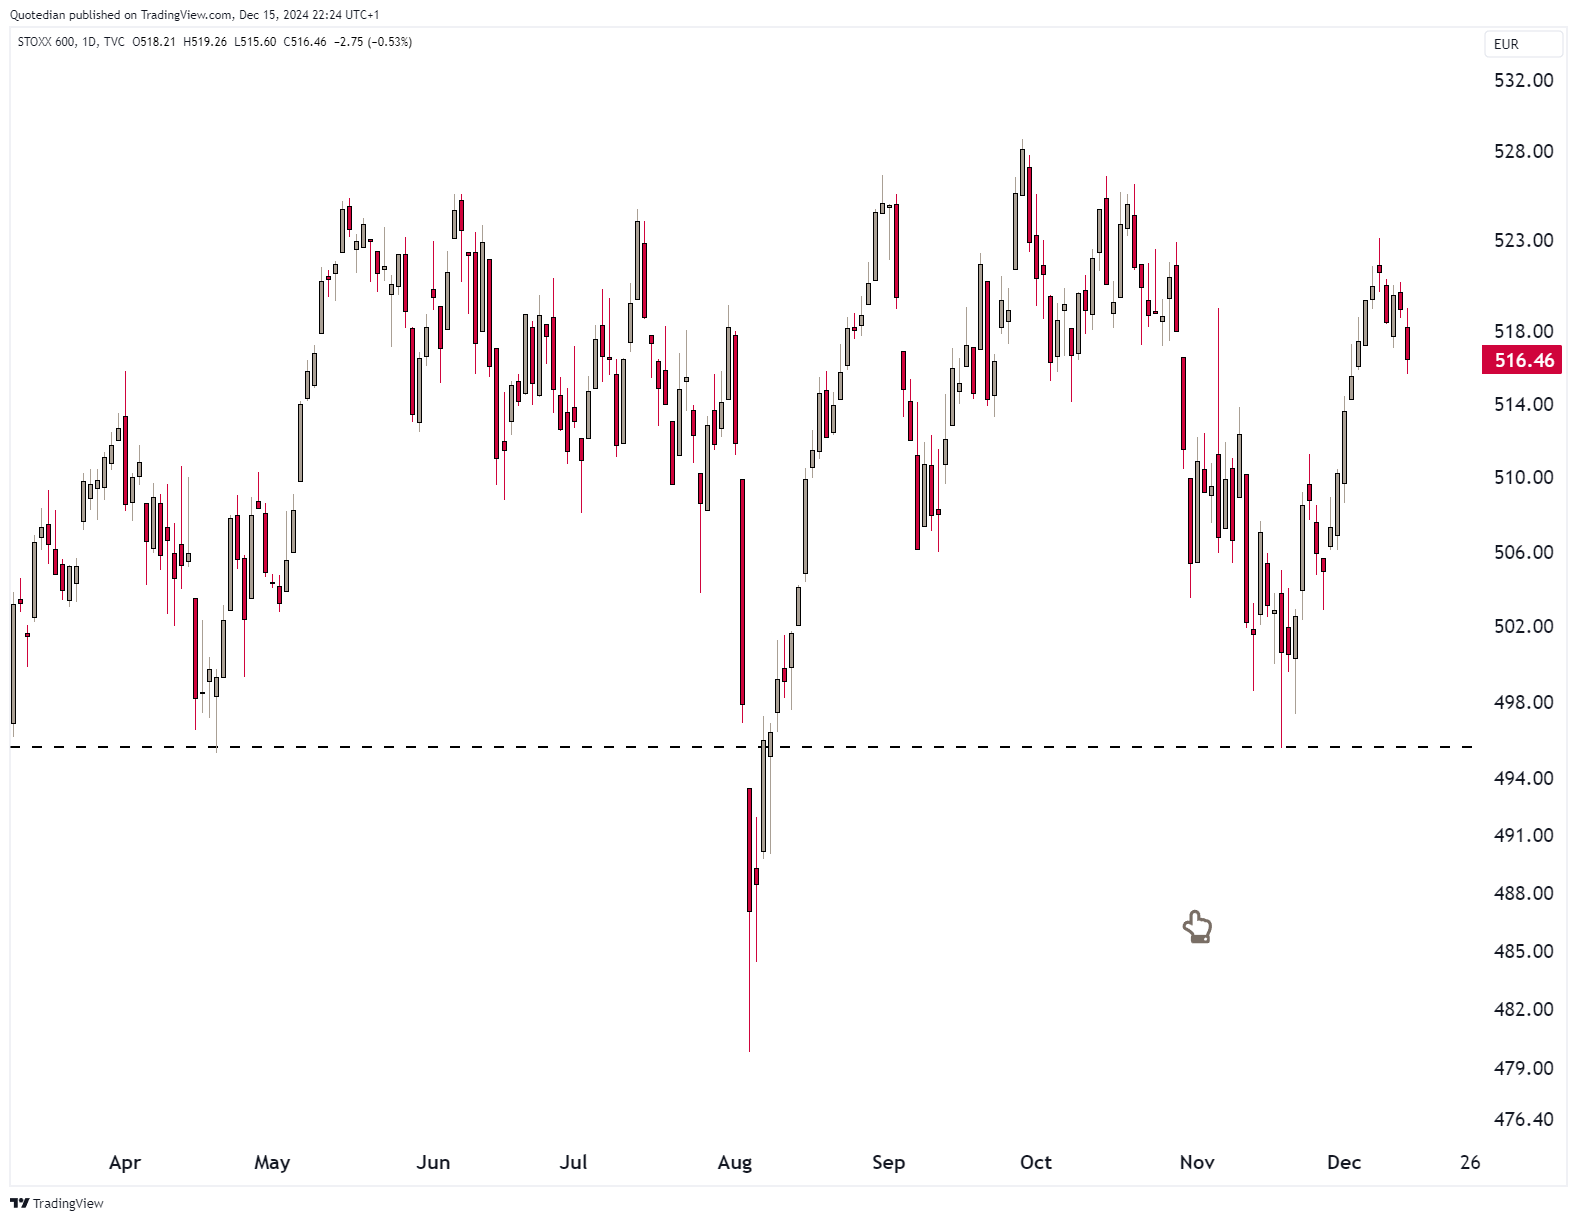
Let Yoda summarize the chart above for you:

Switzerland’s SMI is depressing:

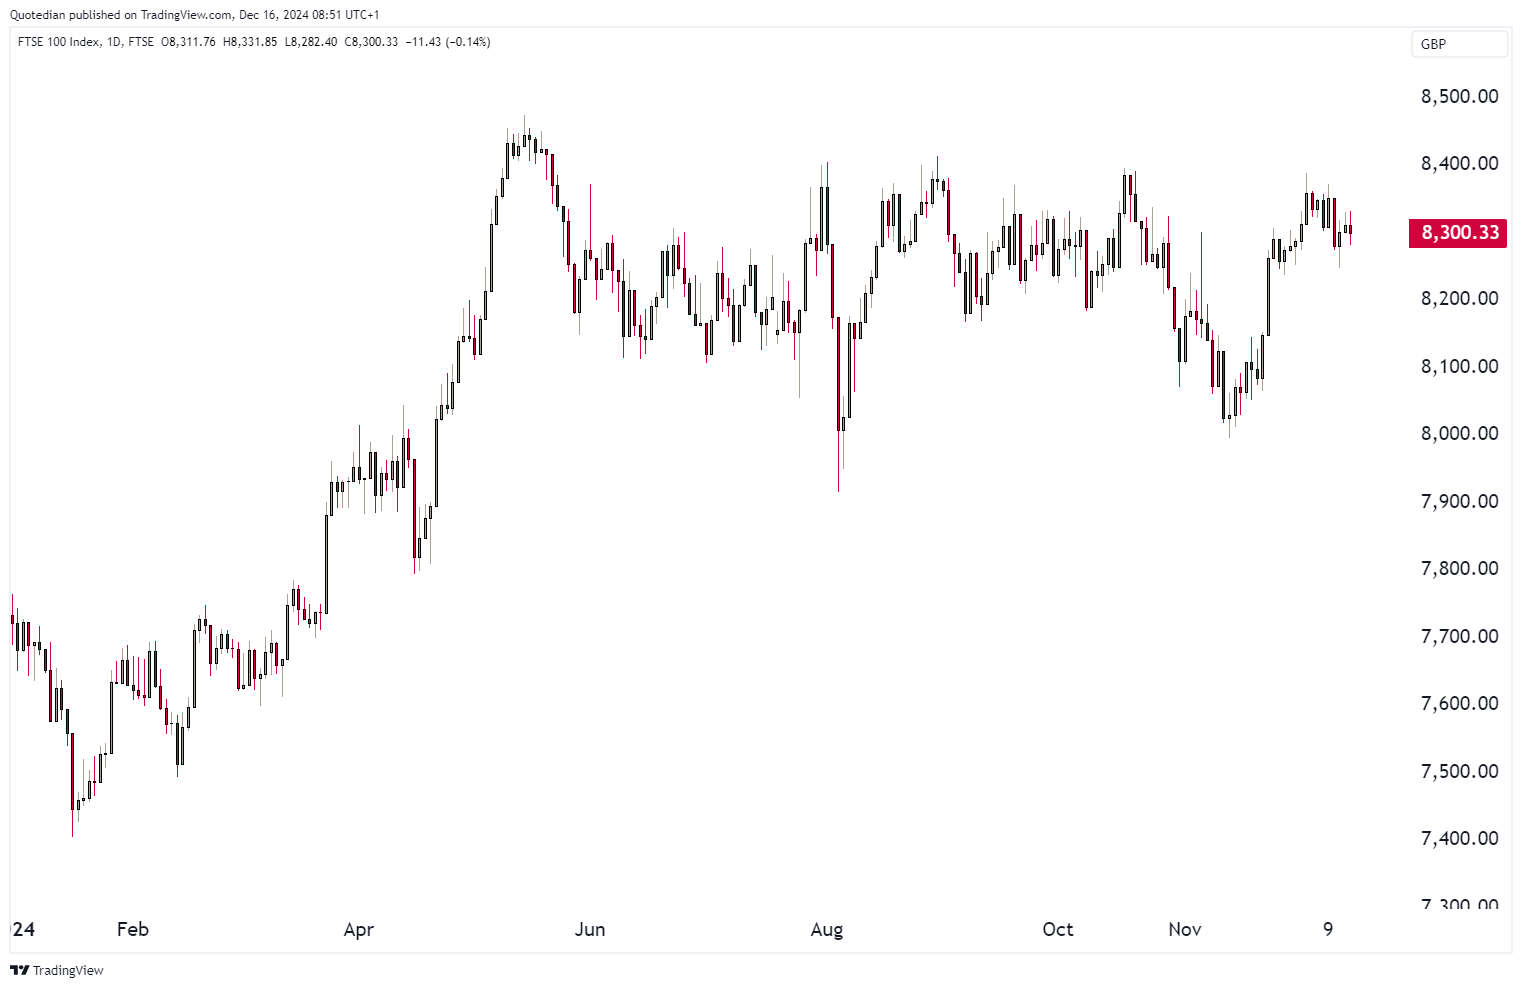
As is UK’s FTSE-100:
Turning to Asia, Japan’s Nikkei continues in consolidation mode - now seven months and counting:

China’s CSI300 is failing to find additional traction after the initial stimulus boost back in late September:

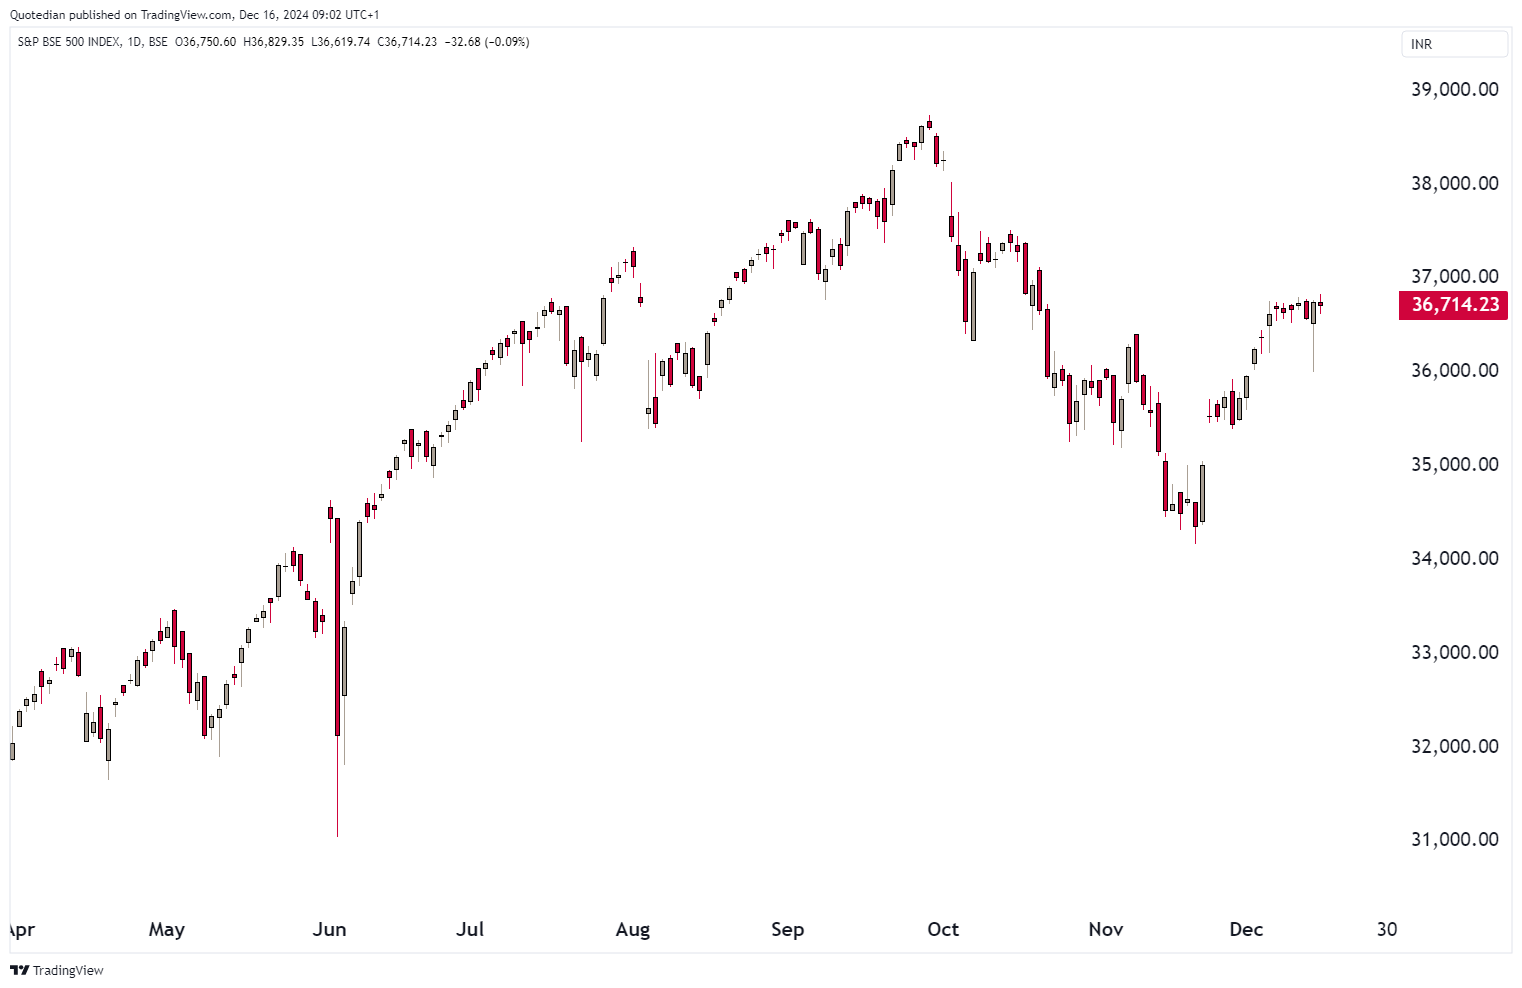
In India, the BSE500 has stalled at about half-way of its recovery rally:
One chart of interest is definitely the one of the Dubai Financial General Market Index, up 3.5% today:
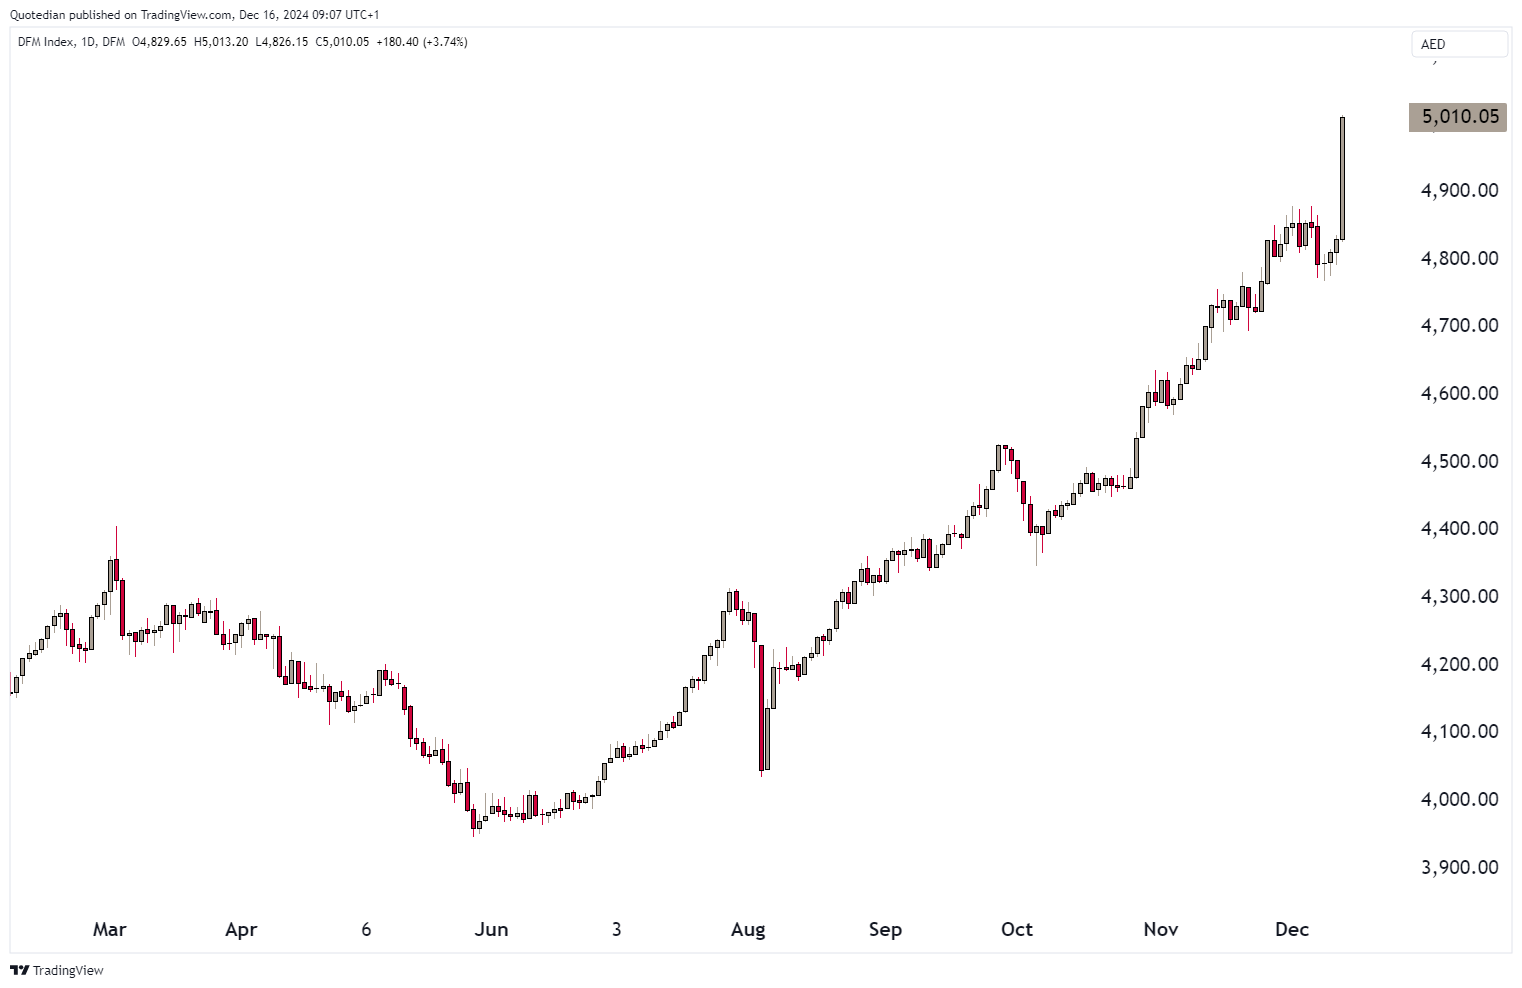
The rally today is apparently on the back of real estate companies rallying in the UAE, after Emaar said it intends to declare dividends at 100% of the share capital for 2024 and the following few years. The index is now closing in on its 2014 highs:

Time to do some sector and individual stock deliberations now …
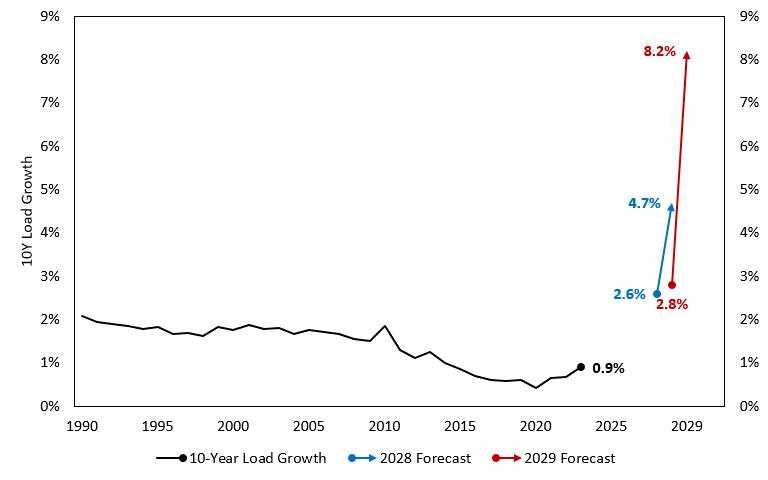
Goldman Sachs had an interesting study out last week, wherein they upgraded their outlook for power usage. In their words:
“The era of flat power demand is behind us…Over the past two years, the 5-year load growth forecast has increased by almost a factor of five, from 23 GW to 128 GW, including Grid Strategies’ estimate of recent update reports. The official nationwide forecast of electricity demand shot up from 2.8% to 8.2% growth over the next five years to 66 GW through 2029 -- but with an additional 61GW of growth in preliminary updates, nationwide electric demand is forecast to increase by 15.8% by 2029. Last year, we pointed out 2028th estimate was revised up from 2.6% to 4.7%.”
They offered this accompanying chart,
and being GS, of course also immediately invented a fitting index (GSENEPOW) to track the story:

This is how the Power Up America story has gone this year:

Interesting!
And as we are talking about Power already, can someone remind why Germany went through with their plan to shut down the remaining Nuclear power facilities AFTER Russia was declared a state-non-grata following their Ukraine invasion?

No wonder we get such a bifurcated stock market:

As we just kind of slipped into individual stock performances, let’s use the momentum (big wink to the insiders who got this pun) and have a look at the best performing stocks in the US and Europe on a year-to-date basis and how they have behaved over the past five days.
Starting with the US:

Quite some reversal performances (NVDA, TPL, FICO, ORCL), but also encouraging signs of continuation (AVGO, TSLA, ANET) …
And here’s the European list:

Overall, actually quite some decent continuation last week, despite an overall mediocre stock market performance.
As the equity section is already getting a bit long, maybe one final sector observation … the ratio chart of US consumer staples (XLP) to the overall market (SPY) shows that it is hitting its lowest since the bursting of the DotCom bubble in early 2000:

With staples stocks being considered ‘defensive’, a turn higher here could be an early warning sign. But until then … party on!

Looking at rates and fixed income markets, we note that voices are becoming louder on how sticky the US inflation is. Here are four ways to look at US inflation:

And yet, the Fed seems to be poised to cut rates for a third time since September, bringing the key policy rate 1% lower since the cycle high:

Is this why the bond market may be revolting at the moment?

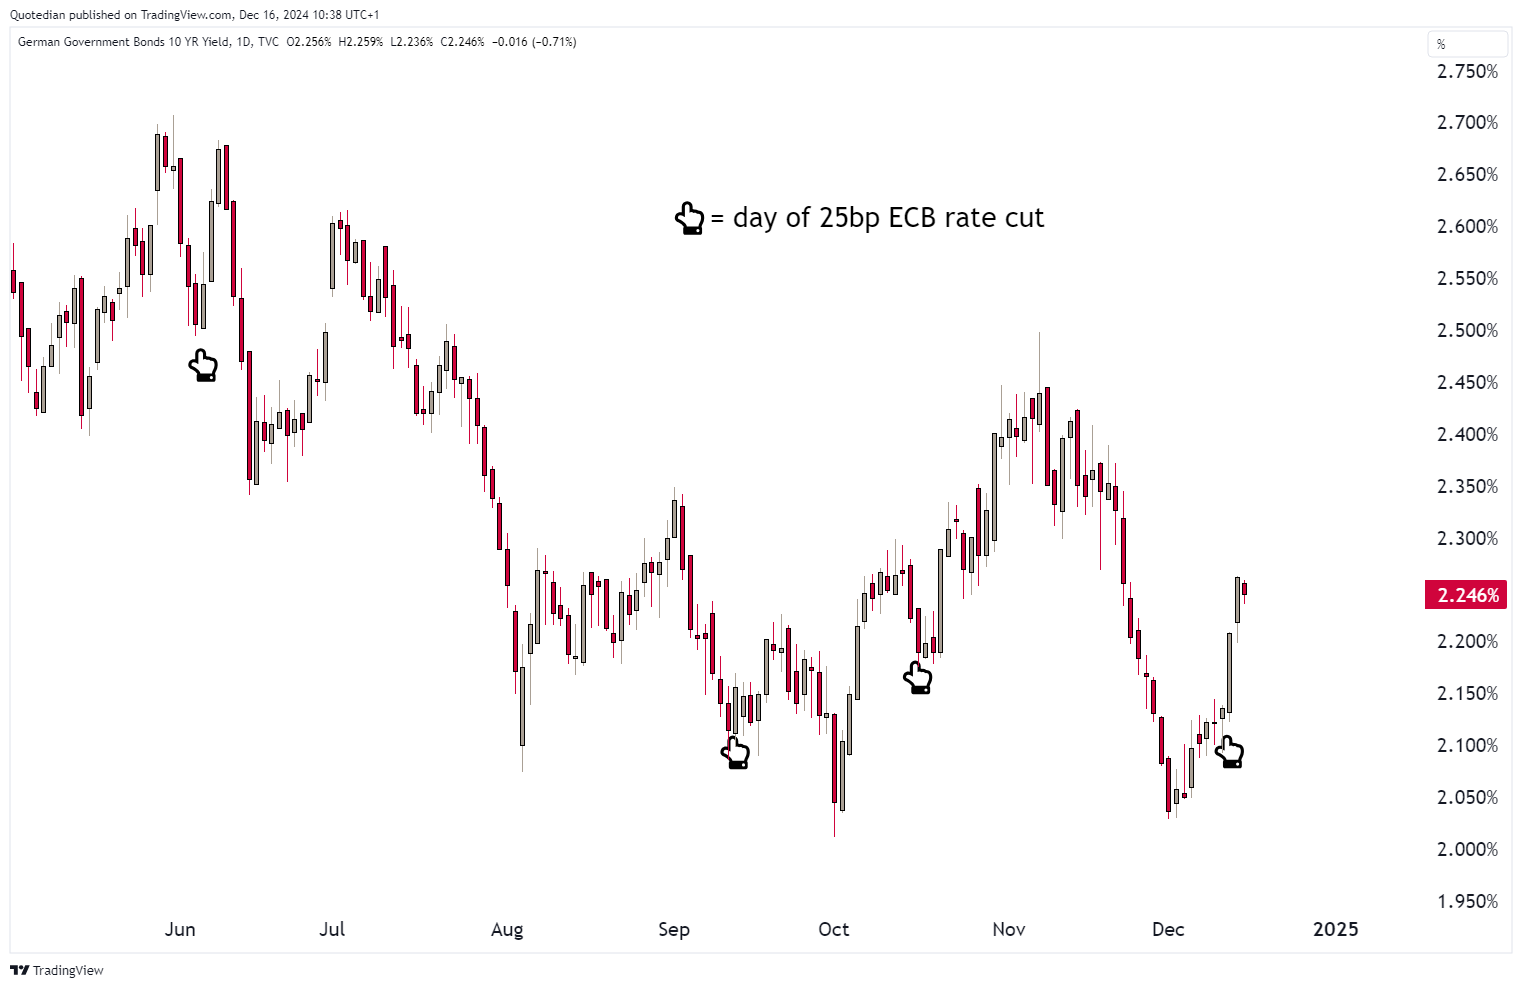
In Europe, the ECB cut another 25 basis points last week and gave a further dovish outlook. How low will it be taken? According to Futures markets, the key deposit facility rate could be a 2% by June next year:

The 10-year German Bund yield showed slight concerns after last week’s rate cut:

However, the following chart of the same 10-year bund yield reveals that these short-term, post-cut spikes are not uncommon:
The Swiss National Bank surprised with a large 50 bp point cut, bringing rates down to 0.50%:

And Futures market are even considering negative rates again next year (as is the SNB) …

What did the bond market think of all this? Not much, with rates apparently accepting their destiny to fall below zero again …

Let’s highjack the Swiss yield conversation and use it as a segue into the FX section …

One of the main objectives of the SNB’s jumbo 50 basis point cut is/was of course to weaken the Swiss Franc (CHF). It worked on the day, but now the momentum in the USD/CHF cross has seemingly already stalled below the 0.8950 level:
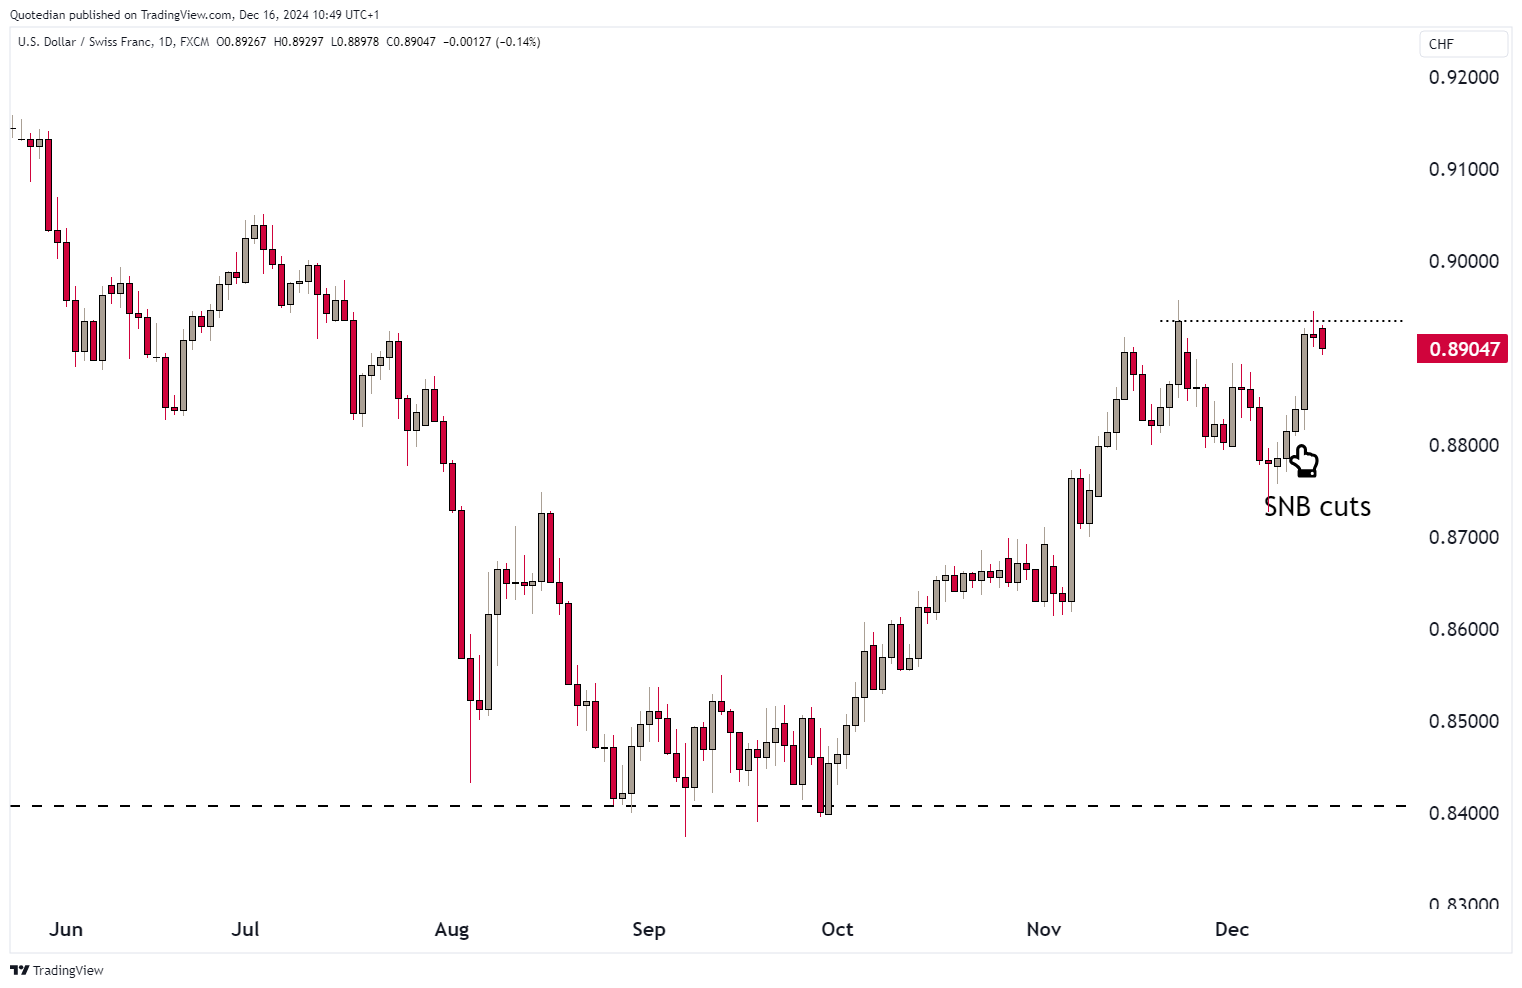
The longer-term USD/CHF chart reveals that the SNB’s dovish rate policy to weaken the Swiss Franc has been of little success:

Or maybe it was successful and we would be looking at a 0.50 Dollar-Swissy rate without such a policy …
The Euro is at danger of seeing further downside acceleration should 1.04 give:

My 2025 call for a USD/JPY short is not working for now:

Maybe long the Yen versus the Euro is the better call?
Of course, we cannot leave the currency section without talking crypto. As Bitcoin is comfortably settling in above 100k,

I found the following interesting table, which I wanted to share with you:

Pretty self-explaining, but just in case … it shows the annual performance of 14 different assets over the past 10 years. Bitcoin was the top performing asset on eight occasion, and on the other two it was the worst performer.
 - S01E02 Sci-Fi | Video gifs by quotes | 3ab99f4a | 紗")
Whilst Bitcoin seems to have considerably more upside ahead, some corners of the cryptoworld are reaching Max Stupid. If you have the time and if you can handle the tone, spend 20 minutes watching this video, aptly title “Have we reached max stupid?”
If you do not have the time, here’s a point-in-case:

A recently launched cryptocurrency called, well, uh … this is awkward … hhmm … FARTCOIN … (I’m blushing, I swear!) reached 0.80 cents this morning, up 2,200% since November. With approximately 1 Billion tokens in circulation, that would give it a market cap of USD800 million. Not bad, for a thing called after smelly air.

There were also some examples of Altcoins reaching max stupid in last week’s letter. Check it out by clicking here, in case you missed it.

In the commodity complex, Gold is ‘obeying’ to my “the top is in for now”-call and has retreated again somewhat has bond yields went higher:

Silver is approach key support at $30:

Zooming out on the same chart, we could even identify a shoulder-head-shoulder reversal pattern, with a price target at for the bulls nasty $25.25:

Copper seemed to be breaking out of its coiling consolidation pattern but failed (circle) and his heading towards support again:

Natural gas was rejected for a second time in the current cycle at key resistance:

The bull’s (me) patience is being tested …

Time to hit the send button, but just before that, one more thing:

Never forget this Chinese Proverb:
"A smile will gain you 10 more years of life."
And now, with that happy smile on your face, a final cookie for you!
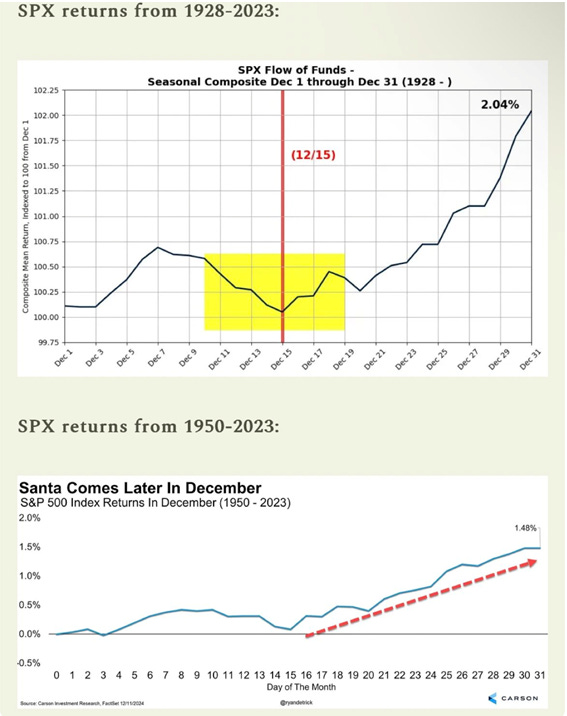
Santa is coming to town … just about now!


Everything in this document is for educational purposes only (FEPO)
Nothing in this document should be considered investment advice
Investing real money can be costly; don’t do stupid shit
The views expressed in this document may differ from the views published by Neue Private Bank AG
Past performance is hopefully no indication of future performance