Topsy-Turvy
Volume V, Issue 156
“If the world is upside down the way it is now, wouldn't we have to turn it over to get it to stand up straight?”
— Eduardo Galeano
And CLICK HERE to listen to the fitting soundtrack to this Sunday’s Quotedian. 😂😂
DASHBOARD
AGENDA
CROSS-ASSET DELIBERATIONS
I am a runner.
A slow one, but a runner. Running as in physical exercise that is. And don’t you dare call me a jogger. Not jogger, runner. Even though my wife insists that only cowards run…
Anyway, there are few things that help me more to settle stress and dream up all the rubbish I write in this place than when the endorphins start kicking in a few kilometres into the run. Well, a couple of bottles of red will also work, but the “muscle cramp” from the run usually is easier to handle …
Like most runners, I have my preset routes where I know how long it will take me and the appropriate course is chosen depending on the time available.
But what never ceases to surprise me is when on any given day, I chose a route I have run 50 times or more and decide to run it the other way around. Anti-clockwise instead of clockwise for example, if you know what I mean. And suddenly, on the very same route, I burnt the rubber (not really, slow runner, remember) of my ON Cloudeflyer shoe, there is suddenly a whole new perspective. It actually feels like a new route I am seeing for the first time with a whole new world to discover.
So, that is what we will do today. Aside from our usual weekly performance review of different asset classes and their subset, we will also look at the charts of some of the most important benchmarks upside down. Let’s see what we discover …
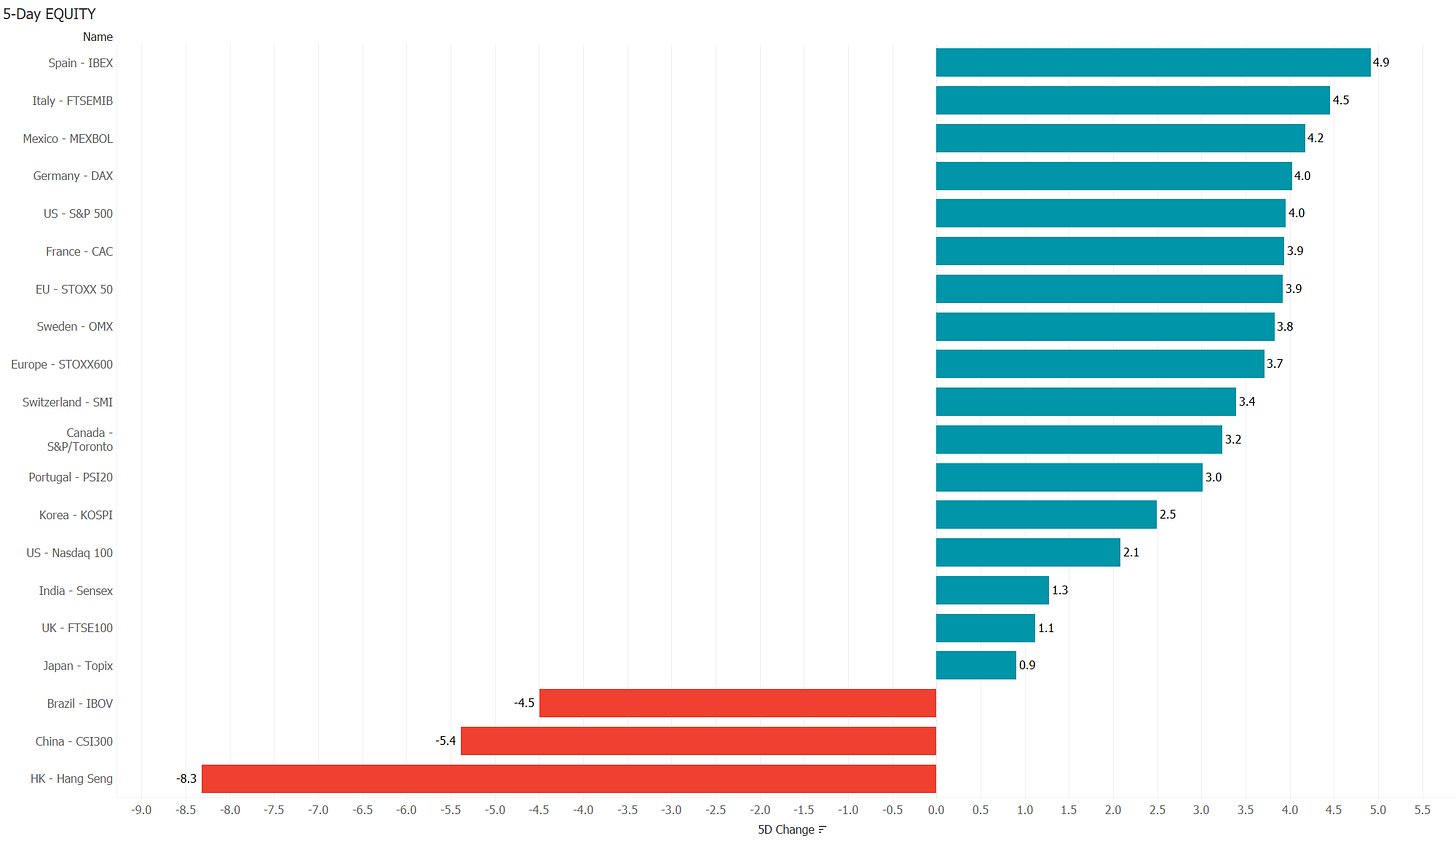
Starting with equities, unless the Bloomberg ticker of the stocks you invest into contained HK, CH or BZ you were likely to have a very decent week with your holdings:
Of course was the pain for Brazilian equity investors somewhat muted, as this was mostly about some pre-election profit-taking with the Ibovespa still up about 10% in local currency terms on a year-to-date basis. In the case of Chinese and Hong Kong stocks, it was however more the case of “when it rains it pours”, with the indices down 28% and 36% YTD respectively.
So, let’s have a topsy-turvy look at the S&P 500:
TBH, this chart looks like it has further downside, at least to the area where the dashed uptrend line converges more or less with the 200-day moving average (blue line). That would be 4,150-ish, or another six percent downside (upside, if you still follow me).
A similar picture is present on the European stock market (SXXP), with the shaded area a possible target zone (approx. 4-5% move from here):
So, what about the ‘naughty boys’, Hong Kong and Mainland China?
Looking at the Hang Seng first, as tempting as such a deep rise (sell-off) and a 5.6x P/E are, it still seems dangerous to catch that “falling knife”, given a previous template (see rectangles):
Similarly, Chinese stocks may not be quite done yet, with an upside (downside) target still some 15%+ away from current levels:
Alright, let’s have a look at equity sector performance of the past week:
Pretty decent, I’d say.
Taking a quick look at the weekly performance of the components making up the S&P 500, leaves us also with an interesting observation:
This is basically the point I was making in Friday’s letter (Pivot³), that the heaviest weighs in the index have started being net distractors, rather than contributors. Were it not for Friday’s difficult-to-understand stellar performance 7%+ performance by Apple on the back of so-so results, the gap between the ‘normal’ S&P 500 (SPY - green line) and the equal-weight S&P 500 (RSP - blue line) might have been even larger:
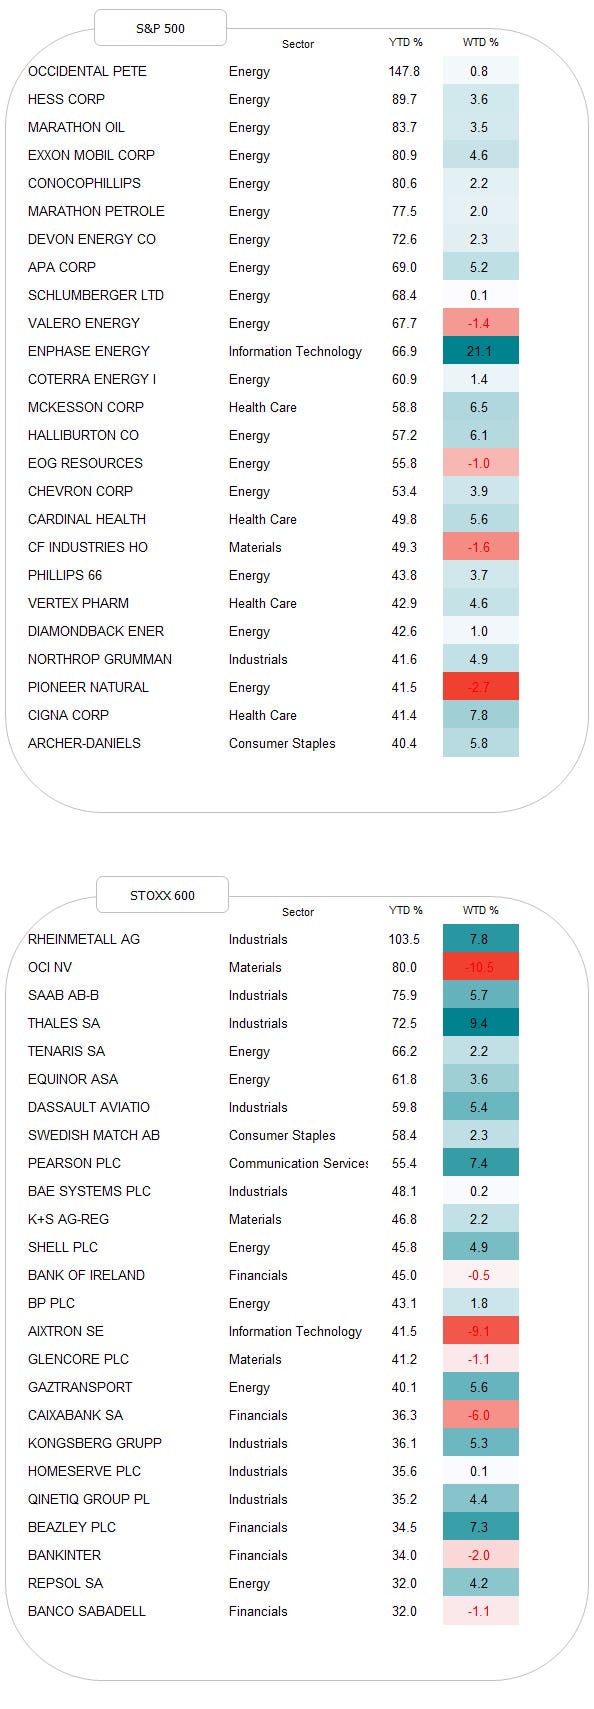
Let me also fit in here quickly our usual Sunday table of this year’s best performing stocks in the S&P 500 and the STOXX Europe 600 index and their weekly performance:
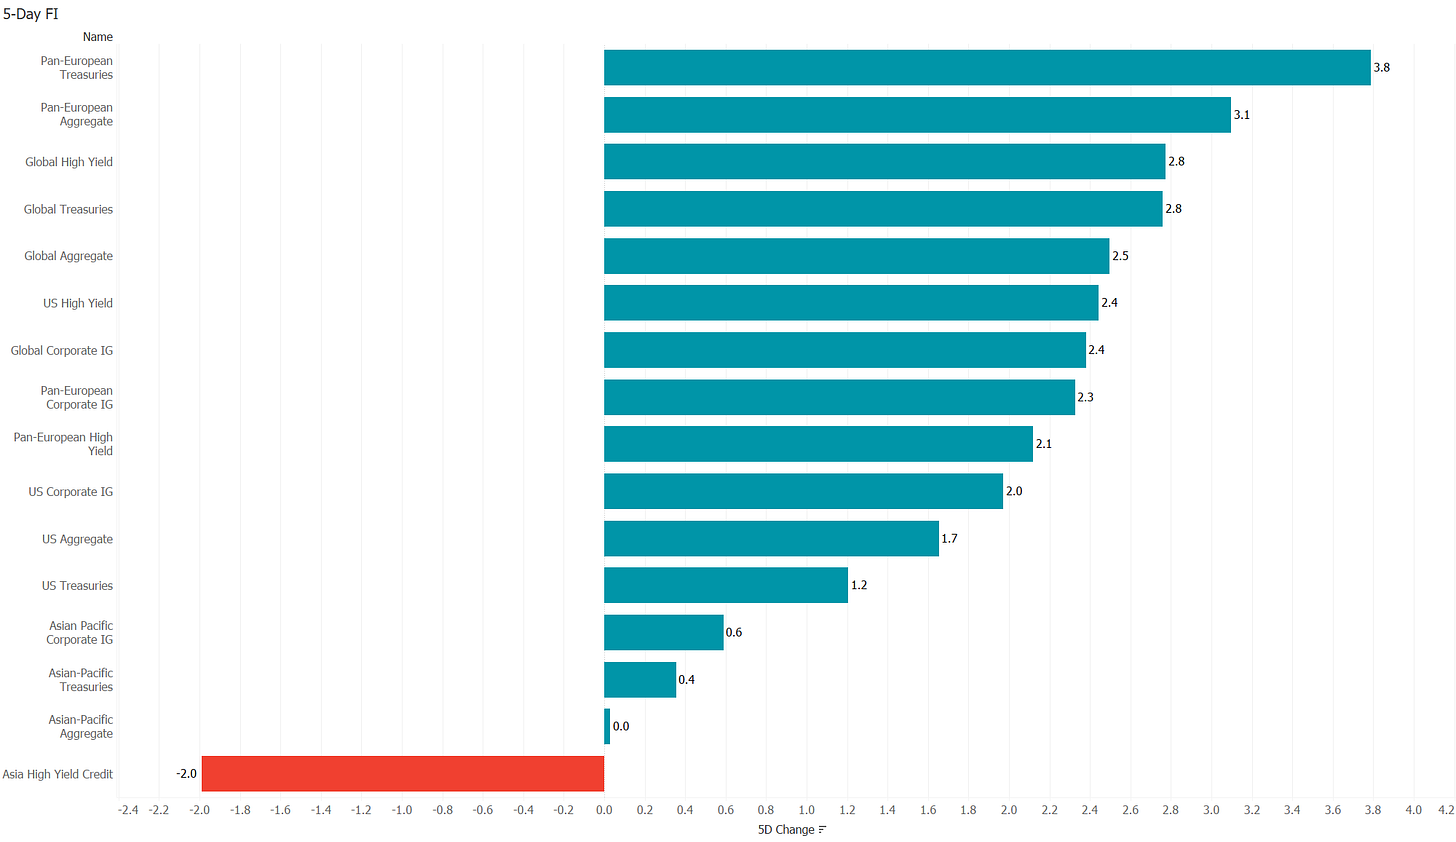
Rolling into fixed-income markets, we finally, finally see some relief for bruised and burnt bond investors:
Taking our reverse-run approach again, are 10-year US treasury yields trying to put in a bottom (top)?
A first hurdle may have been cleared, but definitely, more work is needed to call it anything else than a consolidation period.
Ok, needing to press on, let’s have a brief look at the currency complex. Here’s the performance table of major currencies versus the US Dollar over the past five days:
Except from some profit-taking in the Brazilian Real (elections tonight, remember?) the US Dollar gave back some further terrain this week.
Here’s the inverse EUR/USD chart:
Seems like the uptrend (downtrend) has been broken, at a price target of 1.06 does not seem too unrealistic (note to self: check CTFC positioning for Tuesday’s letter).
Regarding the US Dollar to Japanese Yen cross-rate, it seems that the BoJ has decided to do a Gandalf at 150.00:
And finally, here’s the performance table for the commodity complex:
Hhhmm, a well-diversified picture I would suggest…
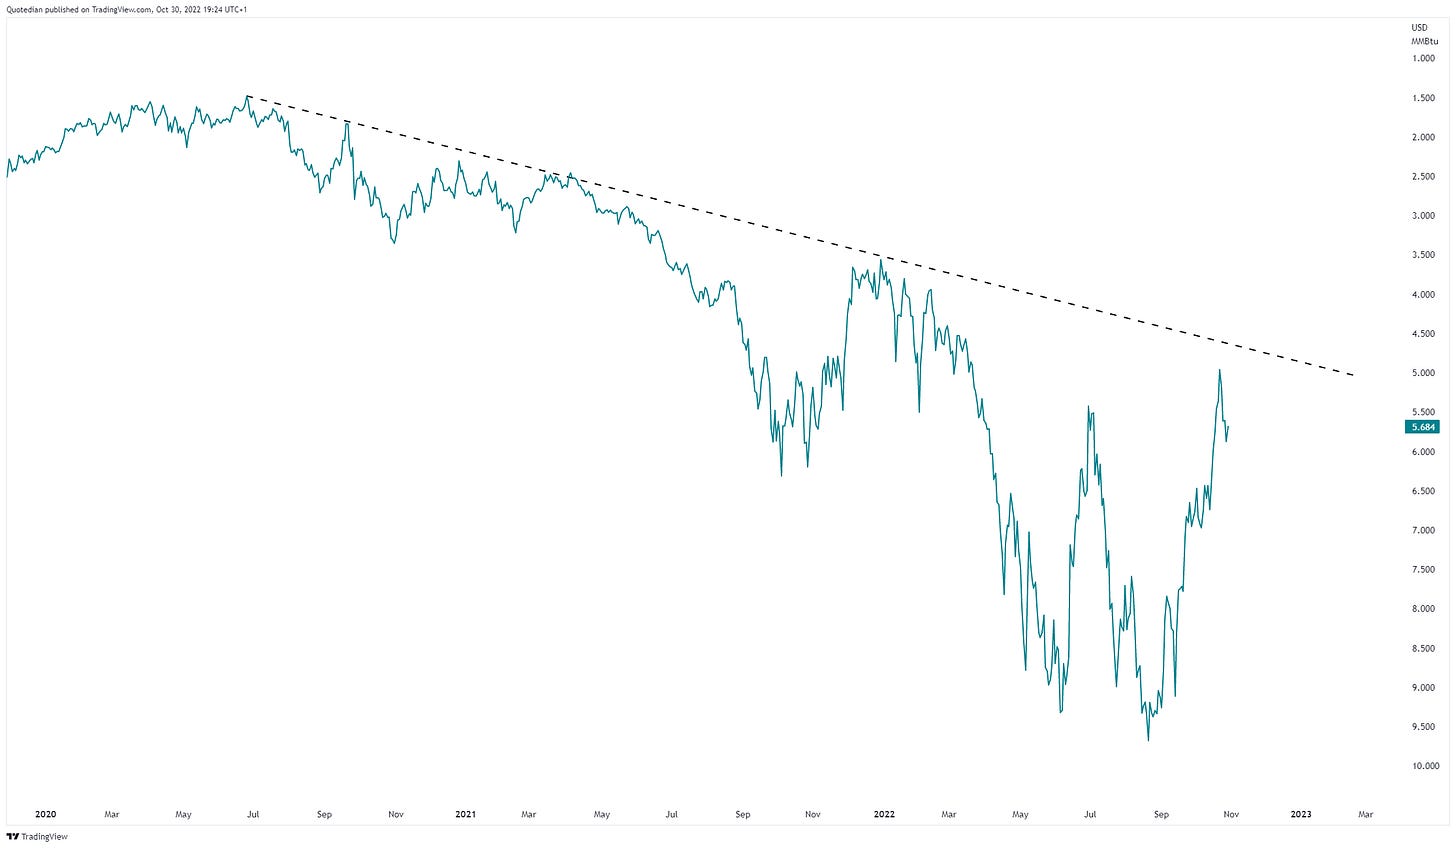
The volatility in Natural Gas continues to be astonishing, here the inverted chart:
IMHO, as long as the price is above $5, the risk remains to the upside (downside on the chart above).
The picture on Gold is not overly bullish:
I wanted to write much more, but as usual time has flown and I need to cut short here.
Back on Tuesday, enjoy the rest of your Sunday!
André
CHART OF THE DAY
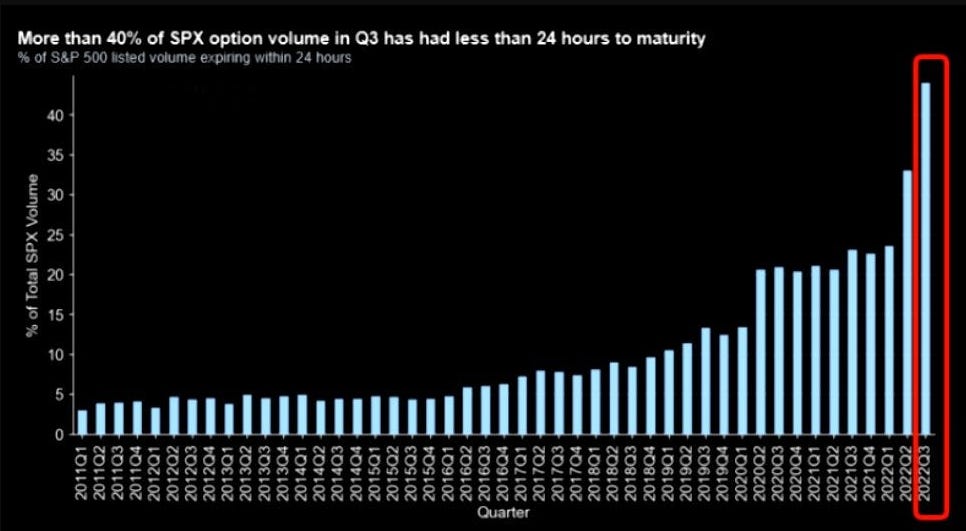
And in the category of “Worry of the Day” we have an interesting chart on options trading activity.
Options are bought by investors for all kind of reasons, such as hedging or yield enhancement amongst many others, and, of course, for short-term speculation. It is a decent way for smaller investors to buy lottery tickets call or put options to speculate with a small amount on a bullish or bearish outcome.
Without going into detail, a very short-dated option, i.e. an option that matures in due course, has more ‘leverage’ than a longer-dated option.
This brings us back to our chart, which makes the following statement: “Animal spirits amongst investors are well alive and fully kicking!” as speculators pile into options with a maturity of 24 hours or less …
Thanks for reading The Quotedian! Subscribe for free to receive new posts and support my work.
DISCLAIMER
Everything in this document is for educational purposes only (FEPO)
Nothing in this document should be considered investment advice
Past performance is hopefully no indication of future performance


