Tread Lightly
The Quotedian - Vol VI, Issue 56 | Powered by NPB Neue Privat Bank AG
“August is the slow, gentle month that stretches out the longest across the span of a year. It yawns and lingers on with the light in its palms.”
— Victoria Erickson
The Dashboard and Calendar will return with the next edition.
CROSS-ASSET DELIBERATIONS
Sitting on the fantastic beaches of lovely Tuscany and sipping a glass or two of Vermentino I suddenly realized one thing with three implications.
The ‘thing’ noticed was that today is August 1st:
Implication #1 - it’s Swiss National Day!
Implication #2 - it’s a full moon!
Implication #3 - If today is the first day of a new month, yesterday was the last of the month just gone by (yes, found that all by myself, even without being a CFA chartholder!).
This of course means that you are eagerly waiting for the end-of-month and year-to-date statistics of the different asset classes we discuss here in The Quotedian on a regular basis.
Hence, I will go through the gargantuan effort to leave alcoholic beverages (mostly) aside for a couple of hours and put the usual stats and graphs together on a best-effort basis. Please accept my apologies for my accompanying comments being sparser than usual.
The good old Quotedian, now powered by NPB Neue Privat Bank AG
Want more macro and asset class insights? Become a client and enjoy our tailor-made approach to financial services!
Contact us at info@npb-bank.ch
Aaaand, off we go….
Starting with equity performance tables, a quick reminder of how they work: Performances shown are year-to-date (YTD) and month-to-date (MTD), with the sort being YTD Descending. The thicker, ‘heavier’ bars are MTD, and the thinner, semi-transparent bars are YTD (e.g. in the graph below Japanese stocks, third from the top, were up 1.5% during July and are up 22.8% since the beginning of this year):
We quickly can deduct that with the exception of Sweden, Hong Kong and China all markets added further to their already decent YTD gains.
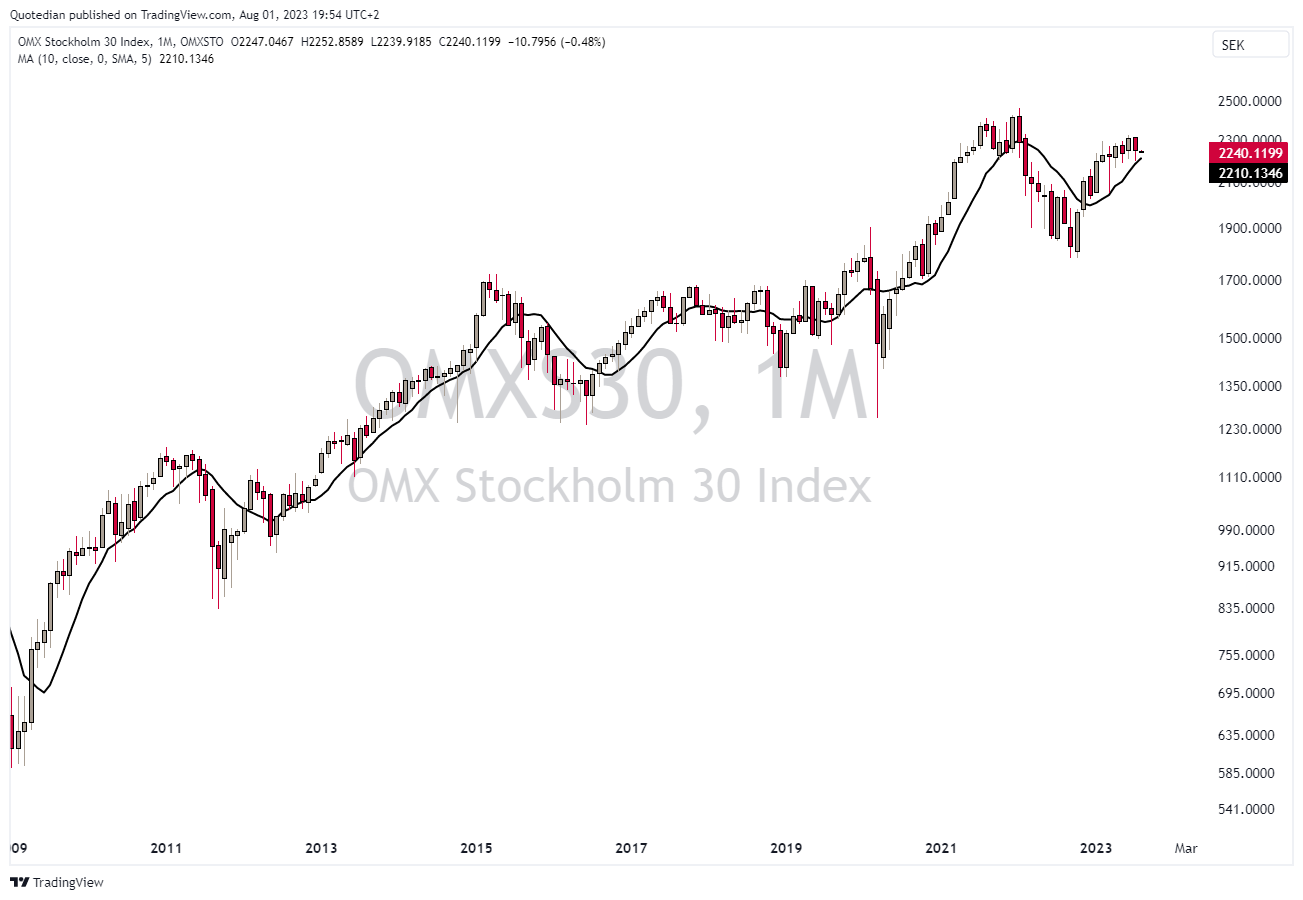
In the case of Sweden, some index heavyweights (e.g. Electrolux, Hexagon) took some massive its in July:
However, the main index (OMX), remains above the 10-month moving average on the monthly chart, and hence relatively constructive:
The other two exceptions I highlighted above, Hong Kong and China, actually also showed positive performance in July, but compared to their peers which added to YTD gains, the duo actually reversed YTD losses completely to go positive on the year.
Here’s the Hang Seng Index in Hong Kong:
And here the mainland focused CSI300:
Both are now trading above their long-term (10 months) moving average, which is bullish - like it or not.
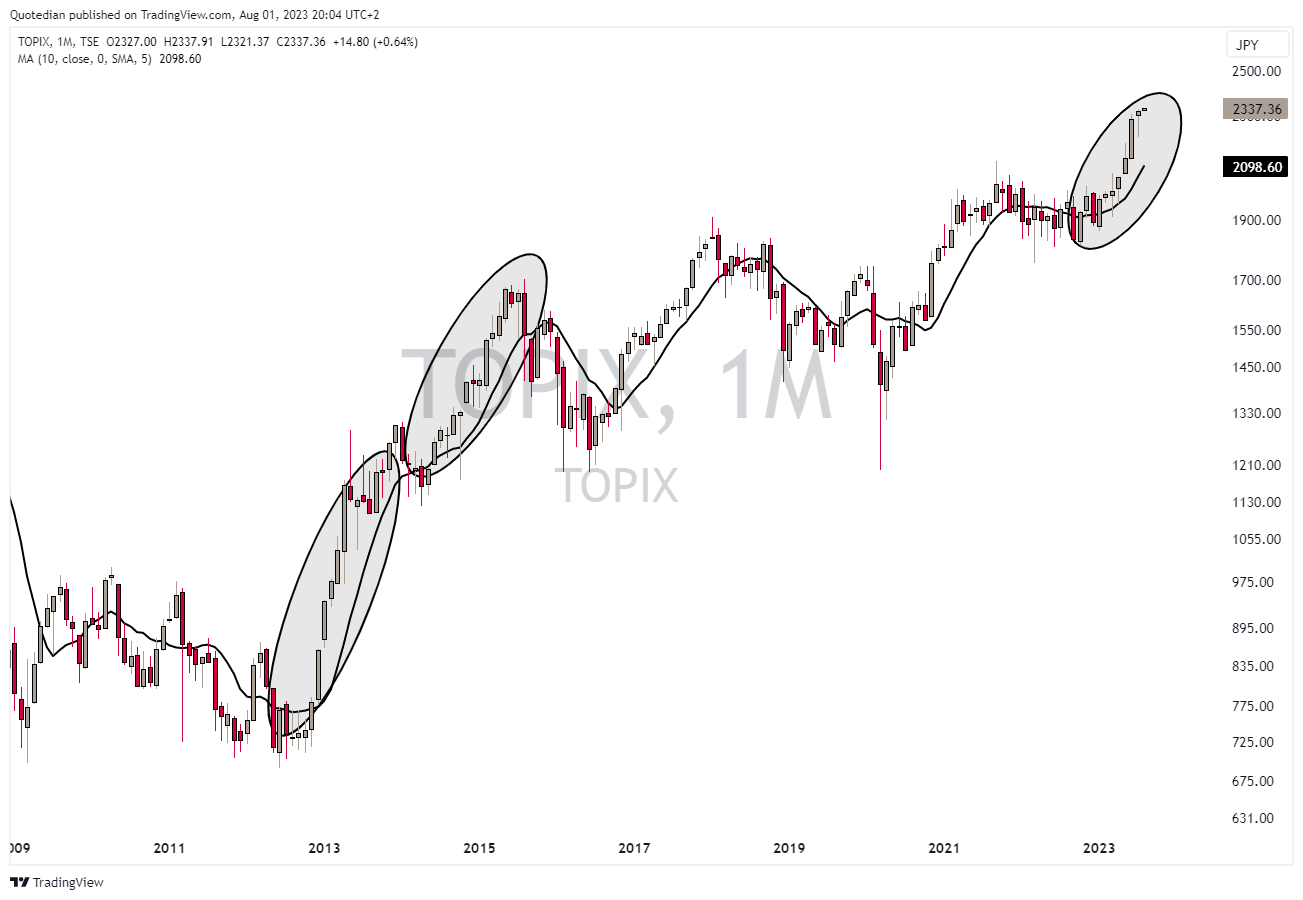
Staying in Asia for two more moments, the acceleration in Japanese stocks (TOPIX) starts looking a bit like those in 2012 and especially 2014, which would mean that we have only seen about half of the total gains so far:
And here is the chart of India’s BSE500 index, which is a punch in the face for any investor not participating in the epic equity rally in that country:
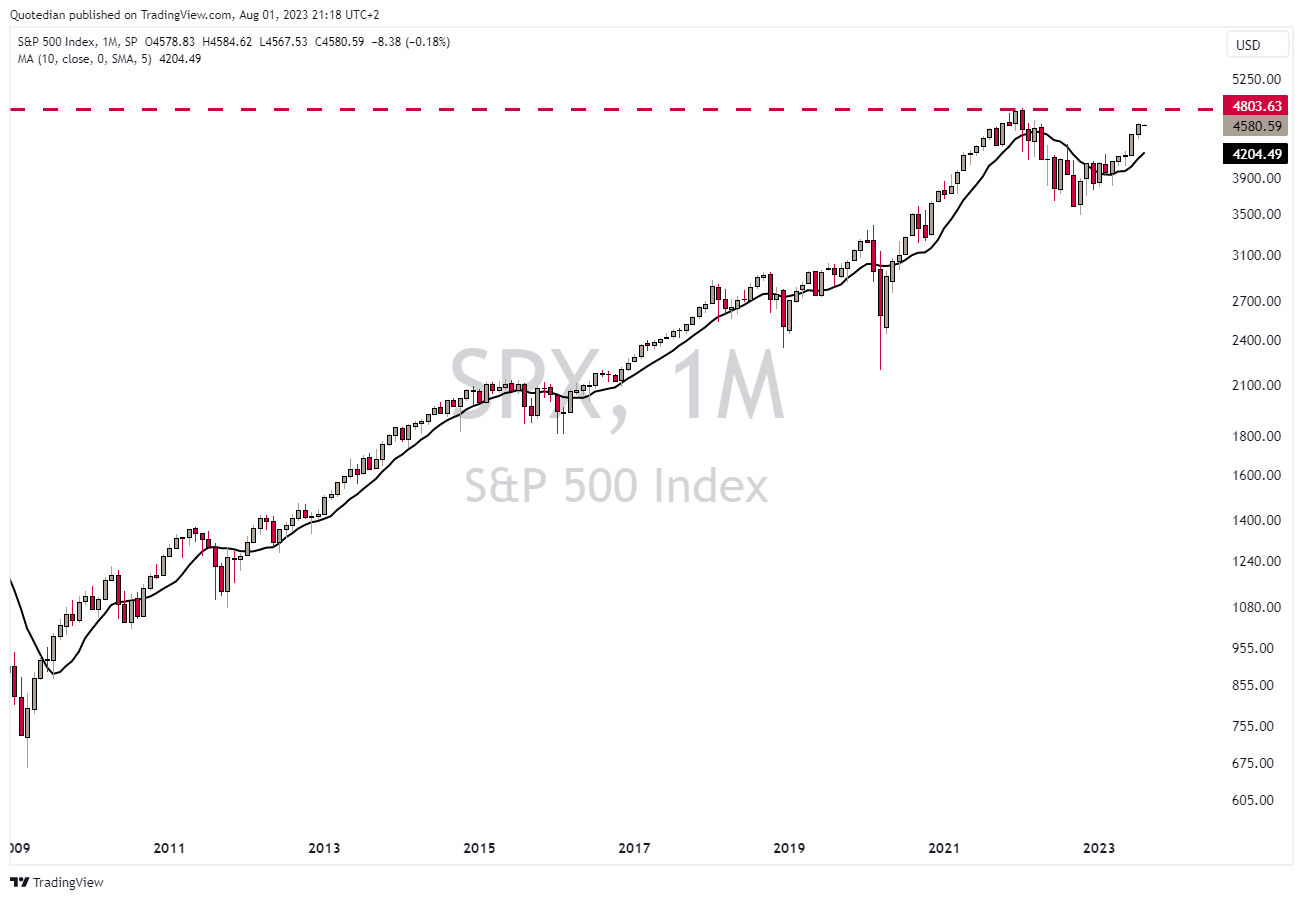
Ok, let’s hope over to the Western world, to have a look at the S&P 500, the one index to rule them all:
The index continues to defy all recession signals and is according to my back-of-the-envelope calculation less than five percent away from a new all-time high (ATH). This further increases the chances for the scenario of a multi-year of sideways movement, comparable to the 1966-1982 period, laid out here at the beginning of the year:
I will return to this in more detail in one of the coming issues.
One index hitting a new all-time high (and closing above the previous ATH) already is the DJ Transport Index:
Should the DJ Industrial index do the same this or next month, we would have the ultimate Dow Theory buy signal (which would jeopardise my ‘sideways-for-longer’ view dramatically):
Have you missed the rally so far, and are looking for a segment that was lagging but now is accelerating? The Russell 2000 (small caps) is your place to be:
Hopping over to our side of the pond, the STOXX 50 had reached a new all-time high already in June, but has added in July to those gains:
The broader STOXX 600 Europe index, which includes UK, Swiss and Swedish (remember?) stocks amongst others, has yet to reach a new ATH:
Time to look at equity sector performance (MSCI):
At the perils of over-repeating myself: WE DO NOT PAY ENOUGH ATTENTION TO SECTOR ALLOCATÍON/ROTATION!!! There is a 40% performance delta between best (technology) and worst (utilities).
Somebody really, really smart recently said something along the following lines:
“Stocks don’t react to interst rates anymore. Individual sectors maybe yes, but not the overall market, which has just become a function of liquidity.”
Amen.
(Note to self: better exploit the yield/sector relationship)
Ok, let’s press on, it’s getting late, BUT, not without this warning to equity investors who tend to sign off at this time of The Quotedian... please read on, it may be very important for your risk on/risk off decision..
Turning to fixed income markets, bonds (as in price) had a really good month, mostly based on compression of credit spreads, but partially also to slightly lower yields:
Let’s have a look at the yield component for bond price formation first. Here’s the US 10-year treasury yield:
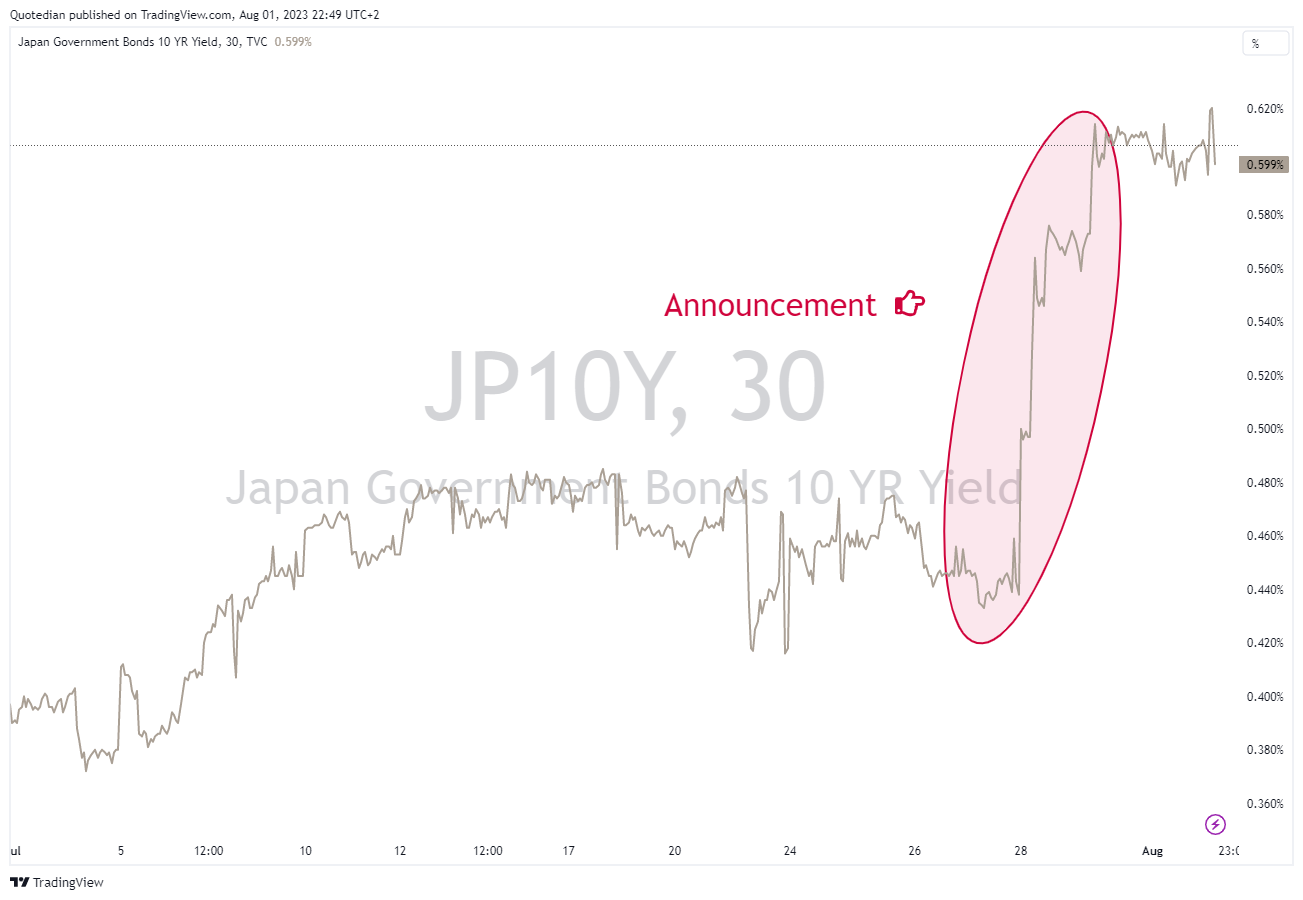
Well, here’s the possible stick to the equity bull wheel. The arrow shows that yields broke above the consolidation pattern in July, which would reinforce our minimum 5% target for the Tens. This has further accelerated in the first day of August. Reason? Most likely last week’s decision by the BoJ to increase the ‘floating’ level of the 10-year JGB:
For now, underappreciated by most market participants, this has the potential to be the most important macro event of the year … stay tuned!
Let me zoom in for a moment to show what yields are doing over the past two or three days since the BoJ announcement. Here’s the 10-year JGB:
Here the US 10-year yield:
Here 10-year European rates (as proxied by the Bund):
Zooming out on this latter, returning to monthly candle charts, we see the formation is not as bullish (for yields) as on the US Tens, but the constant holding above the 10-months moving average is a very positive sign (for yields) too:
These are, despite (or amid) my quote on de-correlation of interest rates and equity markets above, not good sign for risk assets. Of course, with equity markets still rising, credit spreads fail to show any signs of distress:
BUT, with liquidity also deteriorating (aside from not so hot earnings and mediocre ISM readings), at a minimum tread carefully!
The Greenback is having a mixed year and had a mixed month:
The Dollar Index (DXY), which had decisively broken below the all-important 101.00 level, managed to creep up above it by month end:
The British Pound versus the US Dollar adhered so far to our topping above 1.30 call and has reversed lower:
As a reminder, our 8-year cycle guestimate does not call for a bottom before Q1 2025 for the Sterling (will show chart in a COTD soon).
Finishing with commodities, first here are the commodity ‘sector’ performances:
All commodity sectors showed a positive monthly performance, but especially the nearly twelve percent energy upside vindicates my bullish view on the segment. I still think the smartest way to play it is via energy equities, which provide a high shareholder yield (dividend yield + buybacks) and low valuations.
Ok, finally, and then I let you go, here are is the performance table of the some more popular commodity futures:
In short, some really good MTD performances to ‘cosmetic’ an overall mediocre year for most commos.
Ok, enough sacrifice on my part for today - back to the important matters:
With this issue of The Quotedian I held up my part of the bargain. Now it is your turn to hold up yours, which is hitting the like button (even old farts less tech-savvy such as A, P, M, A, D or even S can give it a try). Not too much to ask, no? :-)
Enjoy summer,
André
Thanks for reading The Quotedian! Subscribe for free to receive new posts the moment they are published.
DISCLAIMER
Everything in this document is for educational purposes only (FEPO)
Nothing in this document should be considered investment advice
The views expressed in this document may differ from the views published by Neue Private Bank AG
Past performance is hopefully no indication of future performance


