Aaand it's gone!
The Quotedian - Vol VI, Issue 15 | Powered by Neue Privat Bank AG
“I felt a great disturbance in the Force, as if millions of
voicesDollars cried out in terror and were suddenly silenced.”— Obi Wan Kenobi (ever so slightly paraphrased)
DASHBOARD
CROSS-ASSET DELIBERATIONS
In The Quotedian, called “Achtung Baby!”, issued on December 18th last year, we published the following Chart of the Day (COTD):
The chart and our accompanying comments referred to central banks around the world which have embarked on financial conditions tightening mission, by withdrawing liquidity (green line) and increasing interest rates (red line). And this in turn was leading to “accidents”, which first started in the newest hot thing (crypto) but quickly spread into other, more traditional asset classes (private equity, private debt). This is what Warren Buffet referred to in his famous quote:
“Only when the tide goes out do you discover who's been swimming naked.”
We alluded in that Quotedian about three months ago that this was only the beginning and things would get worse - or even much worse…
And then this headline crossed our Bloomberg screen on Friday:
That reminded us of this hilarious scene in Southpark (click on pic to view on YouTube):
Anyway, and in conclusion, as Blackstone is in danger of being rebranded to Blackhole, its peers and investors better gauge their liquidity measures closely over the coming months …
On to the market review!
The good old Quotedian, now powered by Neue Privat Bank AG
NPB Neue Privat Bank AG is a reliable partner for all aspects of asset management and investment advice, be it in our dealings with discerning private clients, independent asset managers or institutional investors.
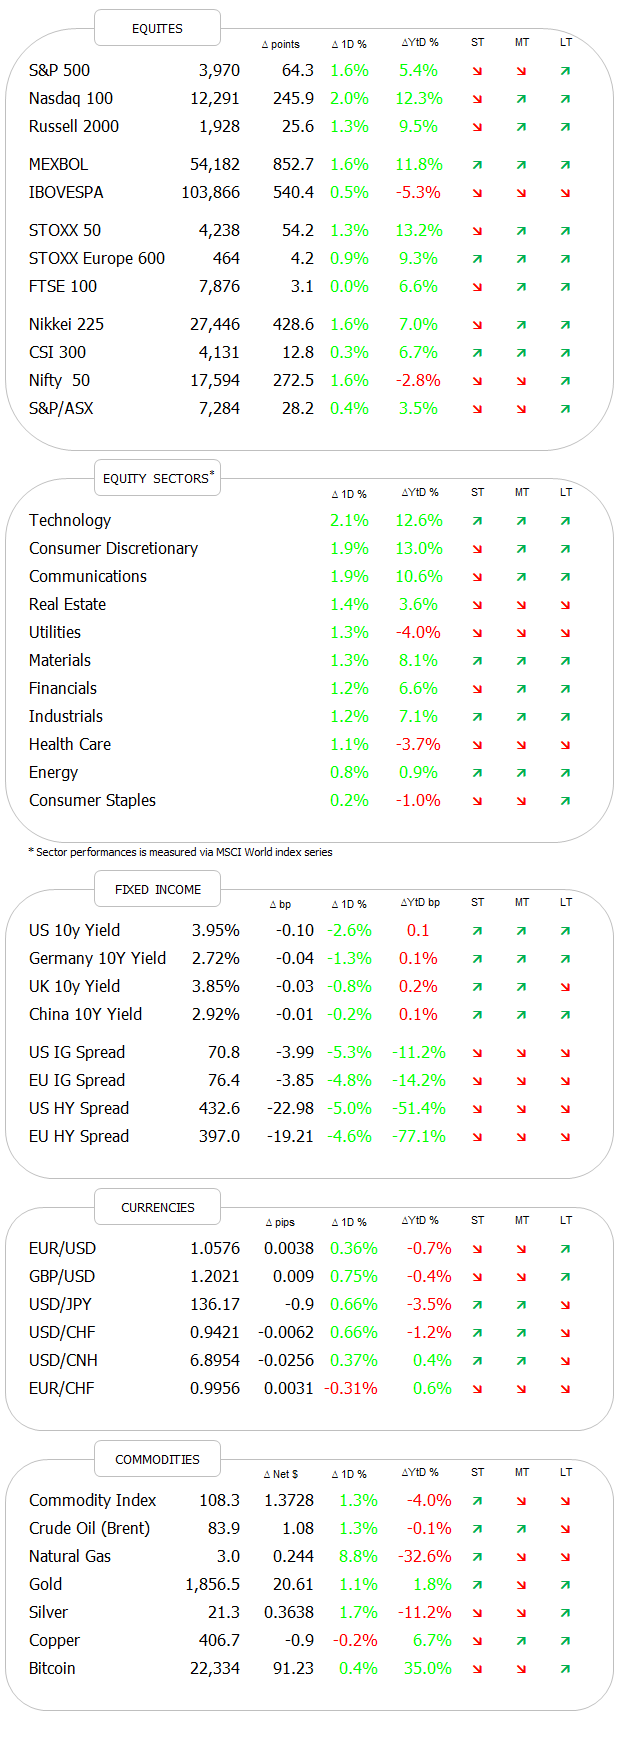
Despite my doomsday introduction to this Sunday’s Quotedian, equities had a very good week around the globe, bucking the trend of the past few weeks. The MSCI World index cranked out a 1.9% gain over the past five days, its first weekly advance in over three weeks. Here are some of the most closely followed benchmark indices around the globe:
In the case of the S&P 500 the ‘turnaround’ couldn’t have happened at a more perfect time for tealeaves readers technical analysts, as the index reversed gear right on top of its 200-day moving average (MA):
European stocks, here measured by the STOXX 600 Europe index, already had a more constructive pattern and are about to break out to new recovery highs:
This chart does not look bearish and can be interpreted as a few more weeks to months of equity gains ahead before heading into a probably (very) volatile summer.
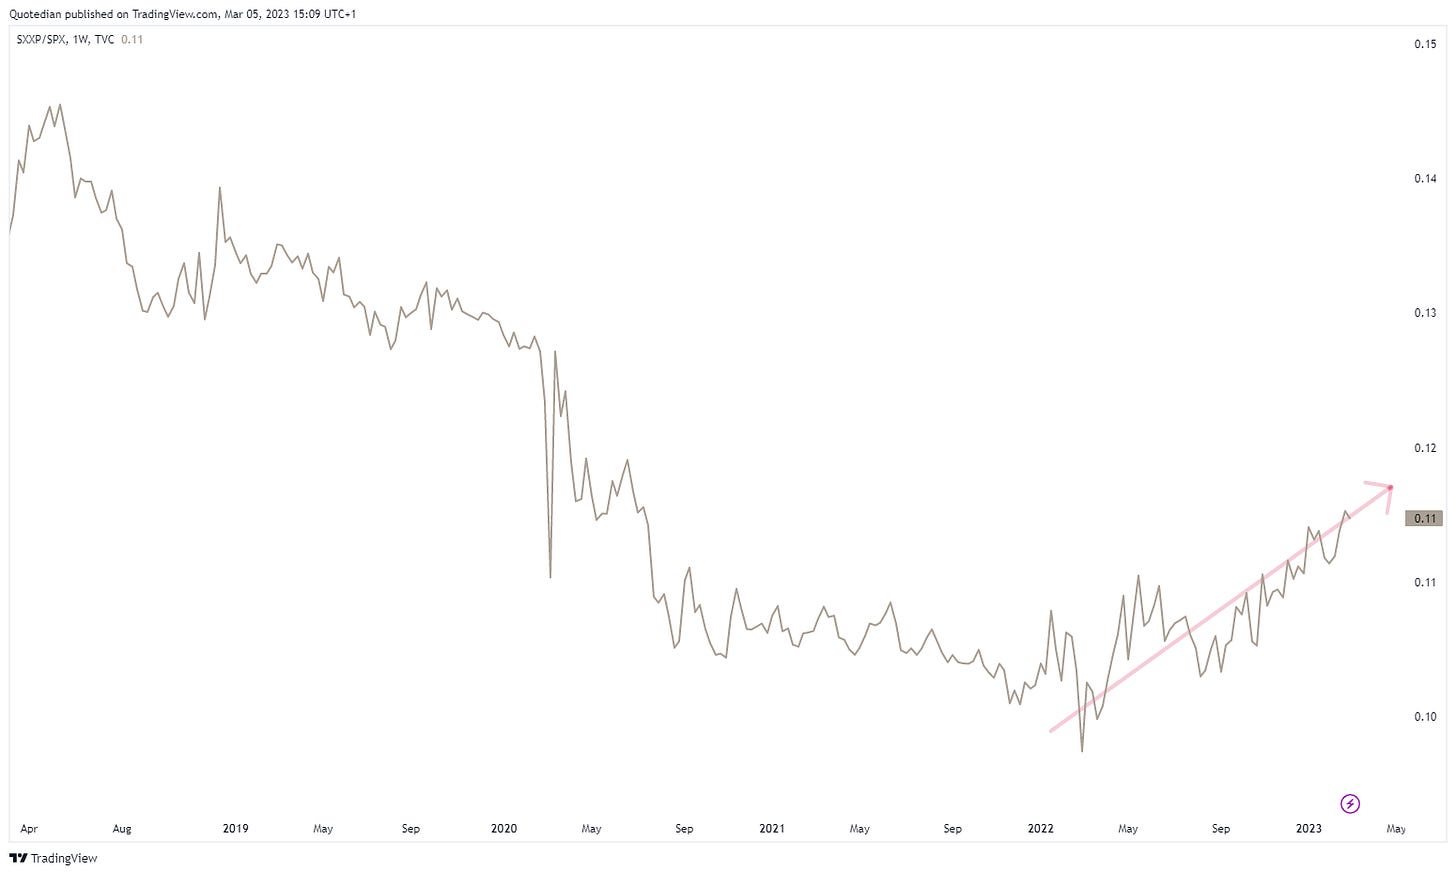
Hence, Europe’s outperformance over over the US continues be alive and healthy:
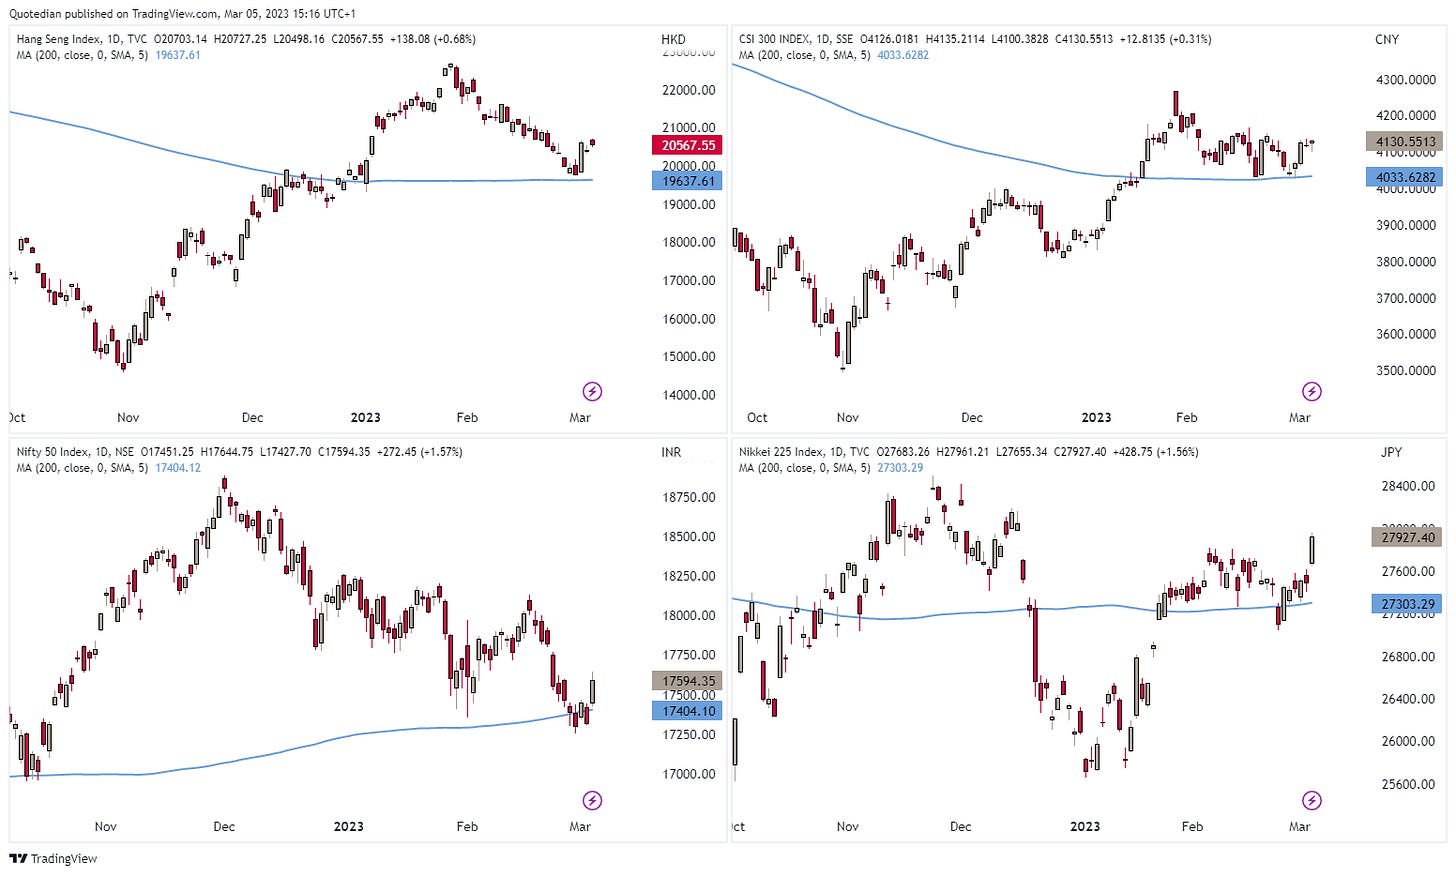
But as we can deduct from the stastical table further up, Asian markets also did pretty well, with many of them rebounding on the 200-day MA too. From the top left and clockwise - Hang Seng, CSI300, Nikkei 225 and India’s Nifty:
A look at equity sector performance reveals that only the most defensive segments were flat to negative - everything else was more or less flying. :
Let’s also have our usual weekly look at the best-performing stocks in Europe and the US on a year-to-date basis and how they have done over the past five sessions.
Here’s the US list:
And here the European one:
Strength begets strength or momentum investing works as the two preceding tables show, as most winners this year expanded on their gains (note to self: start tracking performance on this).
Now let’s head into the fixed income section …
Thinking back to the equity sector performance in the preceding section, and realizing that some of the longer duration sectors (communication, consumer discretionary, tech) were amongst the best performing, one would assume that bond yields softened last week.
This could not be any further from the truth.
Here’s the US 10-year treasury benchmark yield:
Except for the reversal on Friday, yields marched constantly higher, with the Tens reaching an intraday high of 4.08% on Thursday - it’s highest since November last year.
And as I mentioned in last Sunday’s Quotedian (“To land or not to land”), if this were a chart of an equity, I’d be long over my ears.
Or consider short rates, the 2-year Treasury yield for example:
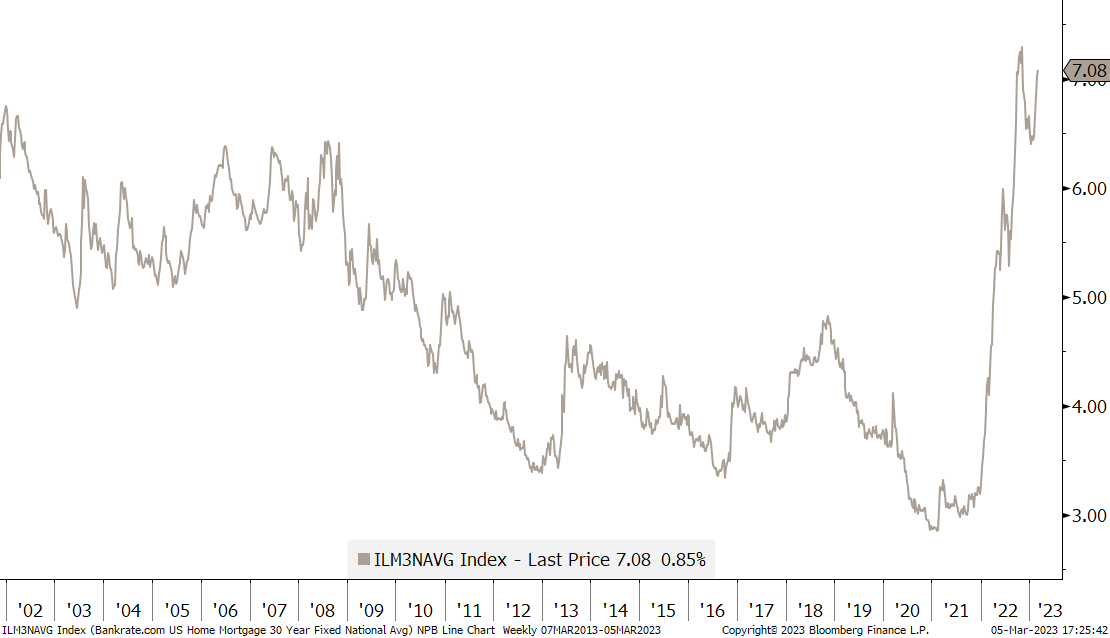
The 30-year mortgage rate in the US is marching towards 7% again, a level not seen in over 20 years (except last year of course):
However, this is not as huge a problem as one may assume, as most Americans actually have 30-year fixed rate mortgages, i.e. are not exposed to this increase.
This is however much less the case in Europe, where floating-rate mortgages, are much more common. So what’s happening to European mortgage rates then?
Here’s the 10 year Pfandbrief yield as proxy for the old continent:
Not at a 20-year high, but getting there and probably more important here is the speed of the rate-of-change from 0% to above 3% in just about a year’s time.
Ok, time to have a look at last week’s performance figures for the bond market. I fear the worst:
Yup, not nice for only a week’s worth of work … unless you are invested in Asian bonds only of course, which you are not…
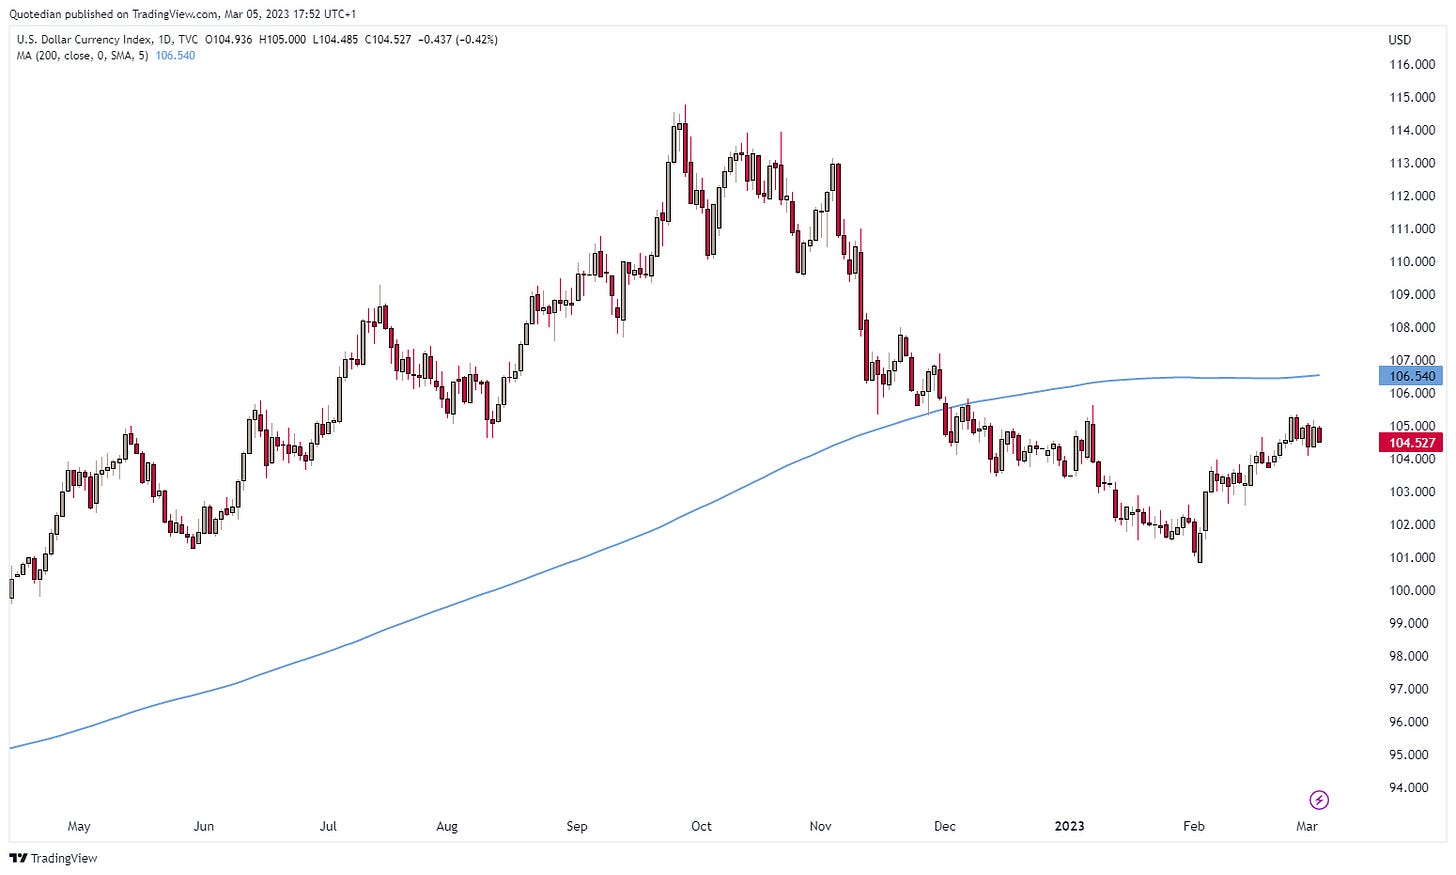
Ok, it’s getting (as usual) late, so let’s press ahead looking at the Greenback’s performance versus other major currencies over the course of the week just gone by:
Aha! That could be the reason for the risk-on mood amongst equity investors. According to the table above the US Dollar softened again. Let’s check the charts:
Well, “softened” seems to have been the right choice of word, as the move lower is barely visible on the DXY chart above.
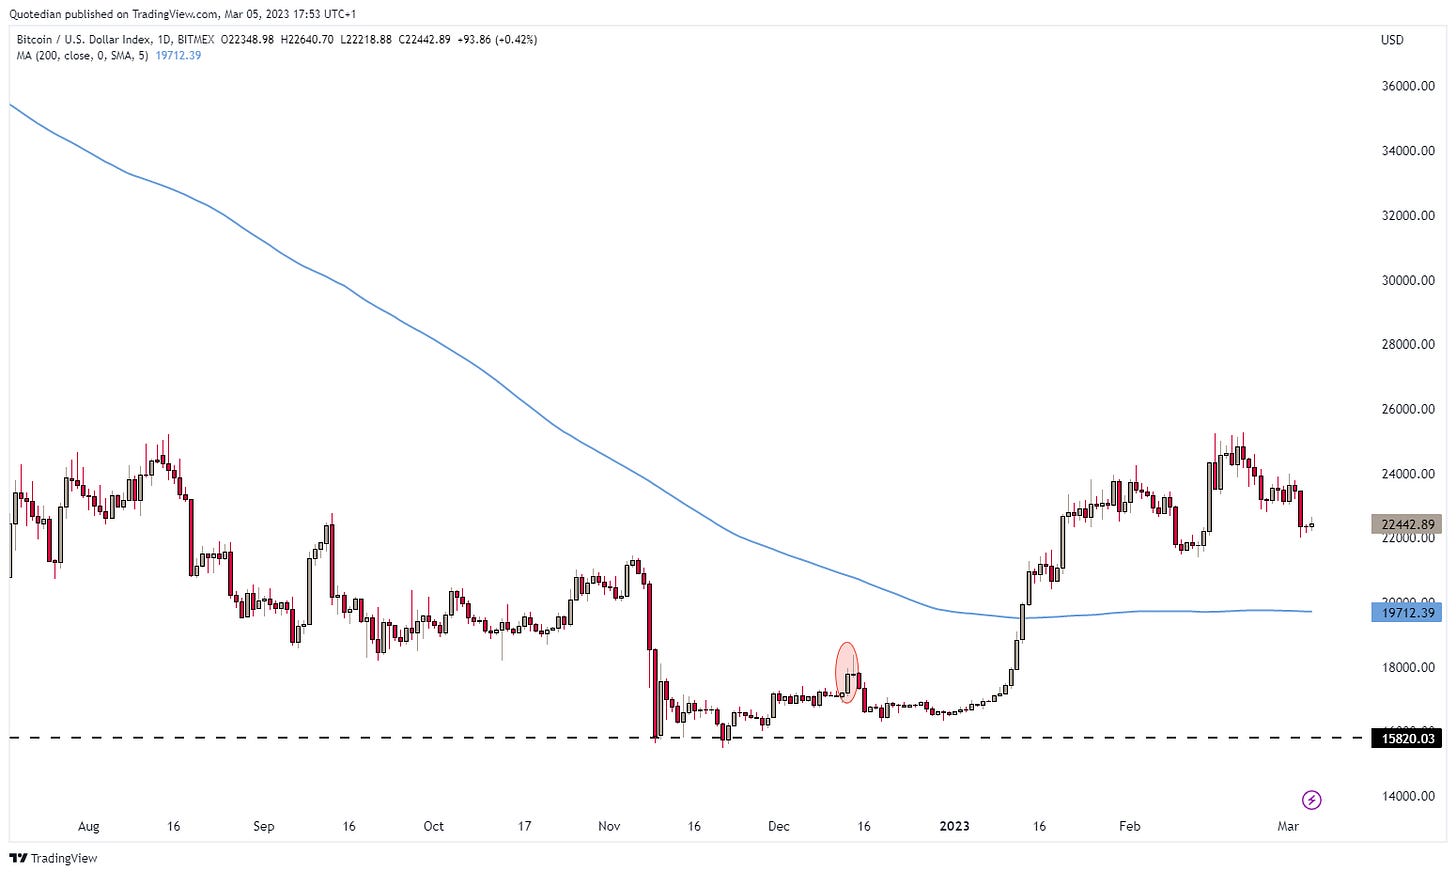
Bitcoin was under pressure again (together with other cryptos) as crypto-bank Silvergate Capital is tumbling towards zero:
And here’s the chart of Bitcoin:
In the interest of time I will skip any charts in the commodity section today, but leave you for completeness purposes with the statistical performance table:
Ok, maybe one last chart. I think we spoke about natural gas last week - we should not only have talked the talk but also walked the walk …
Ok, that’s all folks! Enjoy the remainder of your weekend and always remember:
“Laugh a little and wine a lot. ”
André
CHART OF THE DAY
We noted in our deliberations above that stocks were up and laughing in the face of higher bond yields. And this on the back of an increased number of accidents happening (see Blackholestone). At the same time, as this first COTD shows, is equity volatility (VIX) diverging from bond volatility (MOVE).
Plus, as this second COTD from the chaps at Goldman Sachs suggests, consider that for the first time in over two decades, 6-month Treasury bills (which many would consider being virtually risk-free) yield now more than a 60/40 stock/bond portfolio (which many would consider no to be risk-free at all).
In two words: Not good.
Maybe seasonal tailwinds will be able to keep stocks afloat into early summer, but don’t forget to hedge (reduce) when you can, not when you have to!
Thanks for reading The Quotedian! Subscribe for free to receive new posts the moment they are published.
DISCLAIMER
Everything in this document is for educational purposes only (FEPO)
Nothing in this document should be considered investment advice
The views expressed in this document may differ from the views published by Neue Private Bank AG
Past performance is hopefully no indication of future performance


