

Good Buy or Goodbye?
Vol VIII, Issue 11 | Powered by NPB Neue Privat Bank AG

"The end is where we start from."
— T.S. Eliot
Enjoying The Quotedian but not yet signed up for The QuiCQ? What are you waiting for?!!

As Vladimir Ilyich Lenin famously quipped:
“There are decades where nothing happens; and there are weeks where decades happen.”
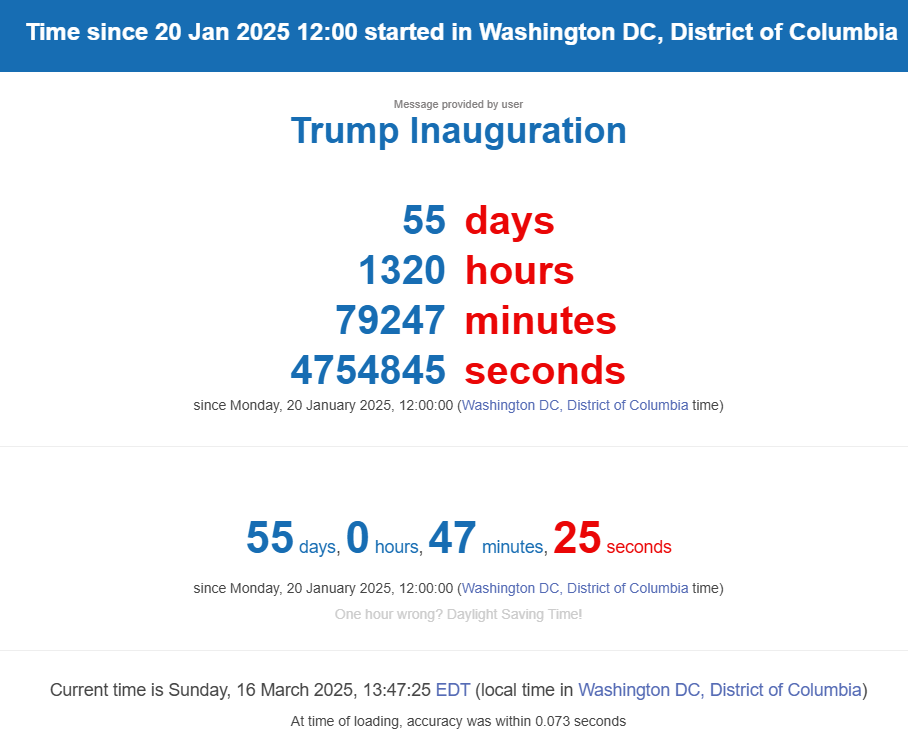
Is it really only 55 days since President Trump was sworn into office for his second term?
Love him or hate him (remember our letter Marmite 2.0?), it is impossible to deny two things:
He has not been lazy
He has been doing exactly what he said he will do (which for a politician, is a major achievement.)
This is not an endorsement. Time for a reminder of the fourth point in The Quotedian’s disclaimer:
Leave politics at the door—markets don’t care.
In any case, what is probably one of the biggest surprises in Trump 2.0 and a complete 180 degree turn from his first term, is the (lack of) obsession with the stock market this time around.
Quite, “au contraire” … it seems that Señor Trump does not care at all about the stock market anymore. Consider this:
Speaking outside the White House on Tuesday, where he was testing out his brand new Tesla car with Elon Musk, Trump called the stock market "a fake economy." That's after he said on Sunday, "you can’t really watch the stock market."
Shortly after he was backed by his Treasury secretary:

And finally, just to make sure nobody missed the message, this is what Bessent said only a few hours ago on NBC’s Sunday show ‘Meet the Press’:

Here are another two comments here before we dive into our market review:
Two, three or more comments regarding not watching the stock market is not coincidence - it’s a deliberate message
Be careful what you wish for …
Hence, this week’s letter will have a close look at equity markets and try to answer the question whether the recent weakness witnessed is a “Good Buy” or if is “Goodbye” to stocks for now.

Last week was difficult for global stock markets - even the recently mighty Dax took a breather:

But most telling is probably that US equity indices (S&P and Nasdaq) make up the tail end of the table above.
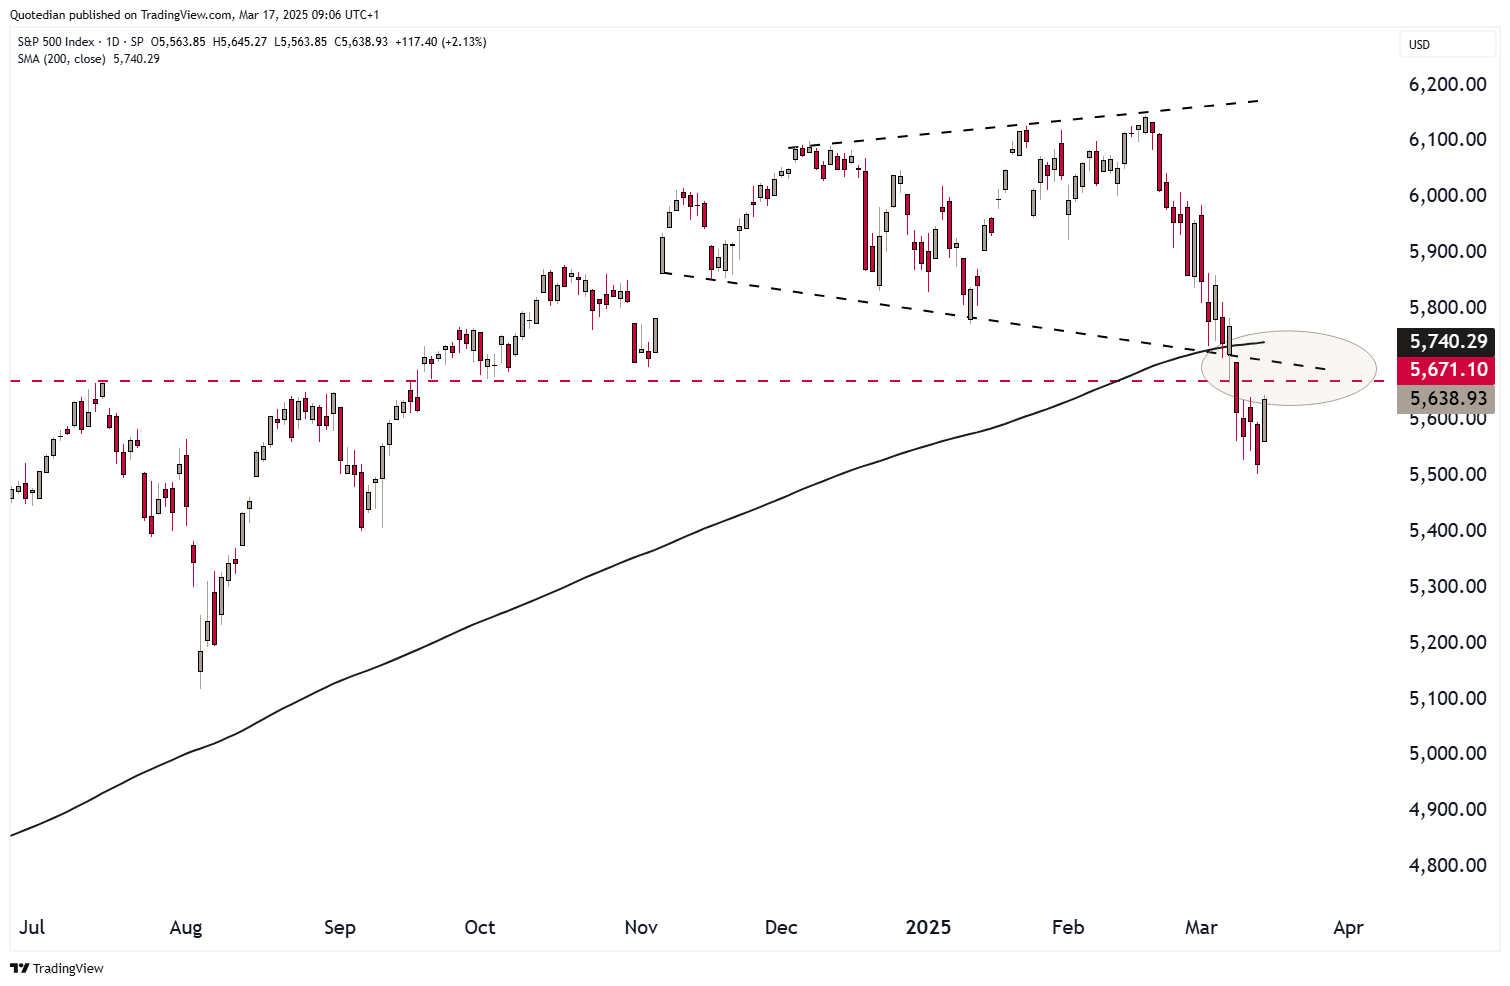
In last week’s letter titled “Clear and Present Danger” (click here) we discussed the critical juncture (200-day MA and lower end of megaphone pattern) the S&P 500 was at:

Well, here’s the updated version of that chart:

Well, that “Clear and Present Danger” is now gone and has been replaced with a “Clear and Present Downtrend”. Friday’s two percent plus rally on the S&P was encouraging, but with the index below the 200-day moving average and a cluster zone of resistance (see circled area below) the burden of the proof lays with the bulls for now:
As mentioned in last Friday’s QuiCQ (click here) with Thursday’s 1.4% drop the index had officially entered correction territory, as defined by a drop from recent highs of 10% or more:

So, how many times does a correction then turn into a bear market, defined as a top to bottom drop of 20% or more?
Two stats on this.
The first is from Ryan Detrick at Carson Group, showing that since Word War II, there have been 48 declines of 10% or more, of which about a quarter turned into bear markets of at least 20%:

Another statistic from the fine folks at Yardeni Research goes back a bit further (1929), and shows that out of 56 declines of 10%, 22 morphed into bear markets, or roughly 40%:

Whilst many indicators (sentiment, momentum - see below) would suggest that the bounce could continue, my feeling is that rallies should be continued to be sold for now or, at a minimum, do not try for the moment to catch the falling knife. As forementioned, a solid move above the 200-day moving average would be needed to improve the medium term outlook.
As indicated, sentiment is negative, which should/could be a positive. The AAII bull-bear spread has been at a multi-month low for weeks now:

CNN’s Fear and Greed index is back at 21, which is still Extreme Fear territory,
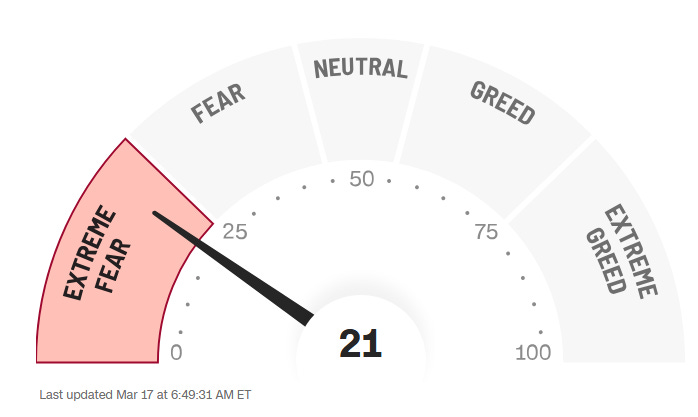
however, it hit a multi-month low last Monday at 14:

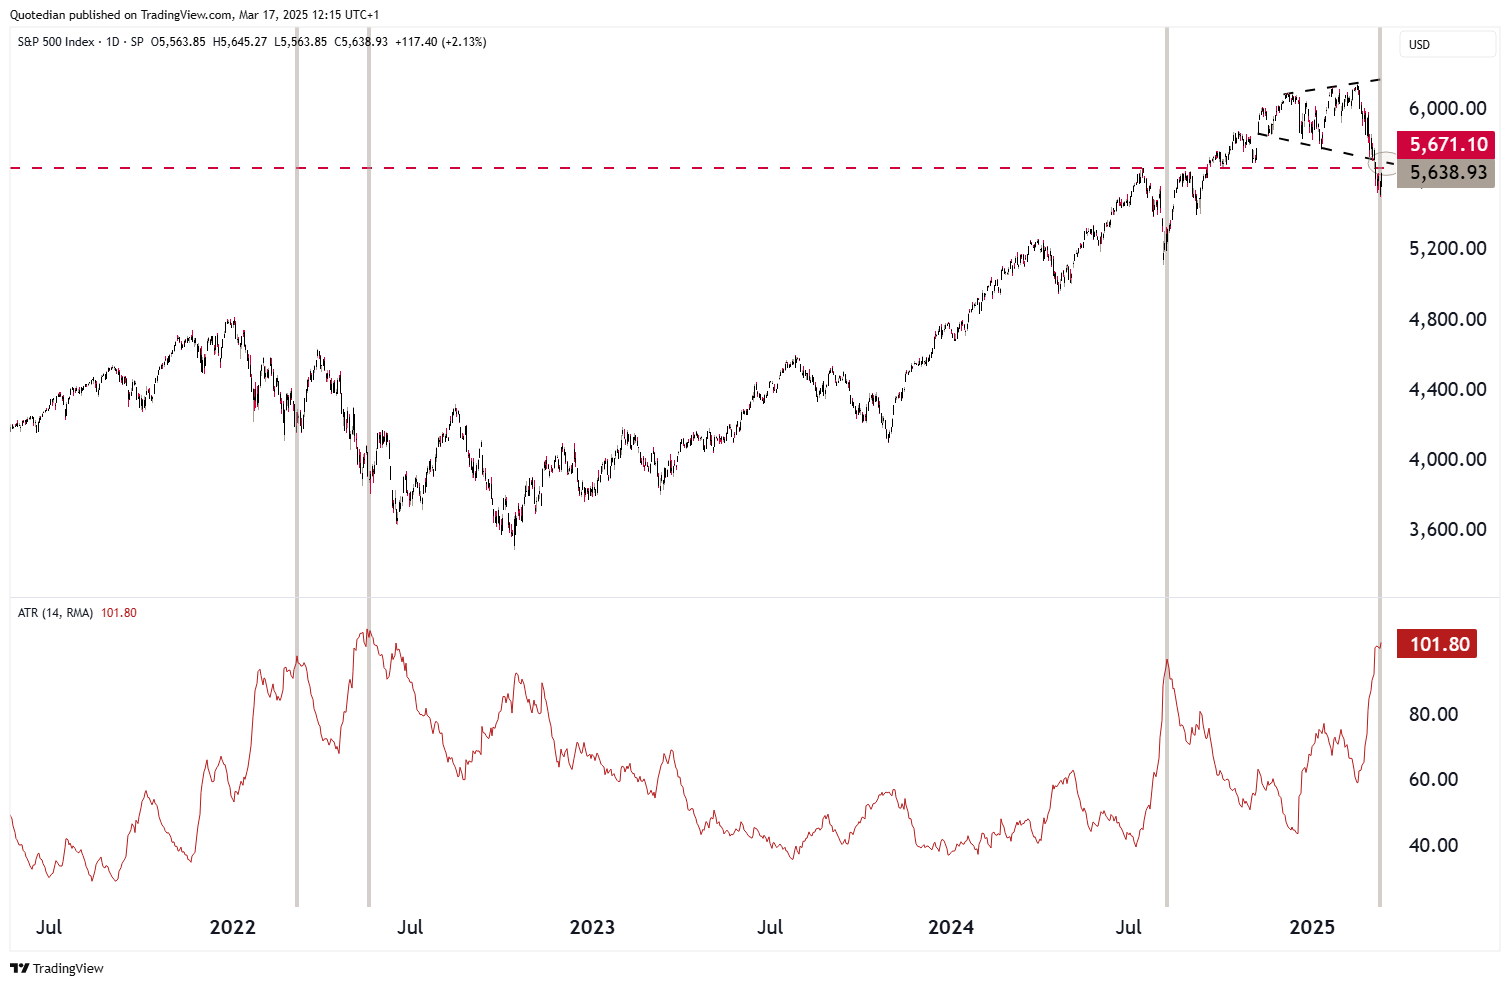
Several momentum indicators are at oversold levels too, suggestion a continued rebound from Friday. Here’s the ATR (average true range) for example, which is at level that offered a good buy signal back in August of last year:

HOWEVER,
zooming out on the same chart reveals that in the 2022 bear market those signals were indeed only good for very short-term rallies:
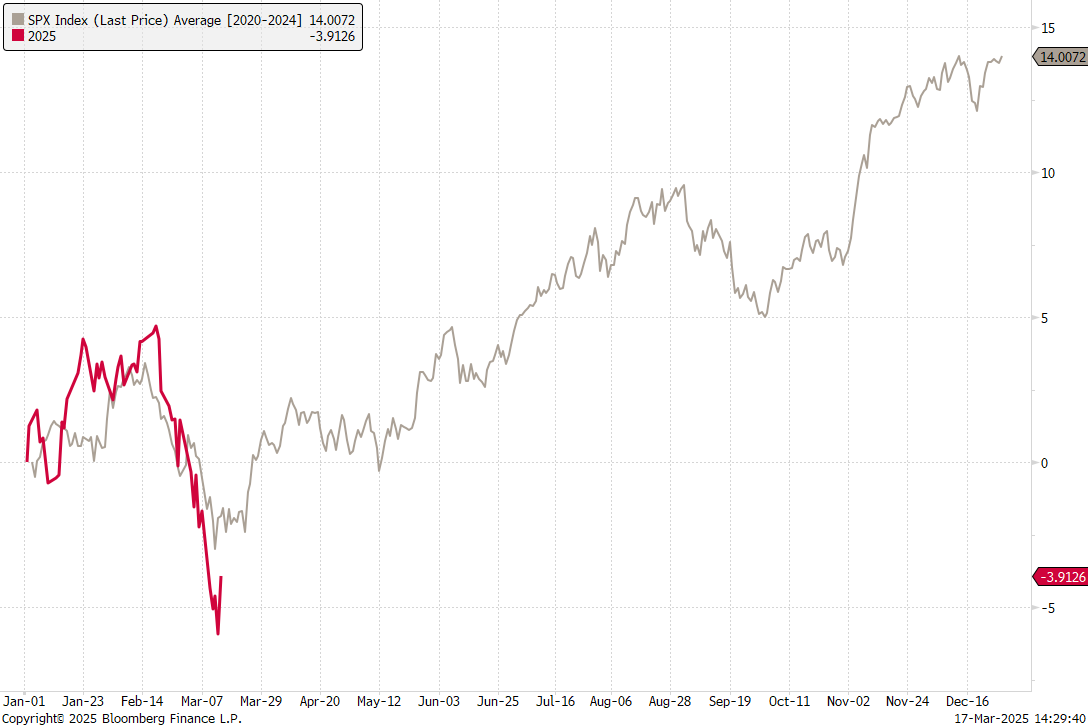
Finally, here’s our updated seasonality graph from last week, which suggest that the S&P 500 MUST HAVE bottomed last week:
Ok, time to look at some other markets.
The Nasdaq 100 is down 13.3% top to last Thursday bottom, which actually only makes it the second biggest drawdown over the past twelve months (for now):

The first natural target zone for a rebound is around the 20,400 handle (3% from Friday’s close), where there is a cluster of resistance via the 200-day MA, support turned resistance and the 38.2% Fibonacci retracement:

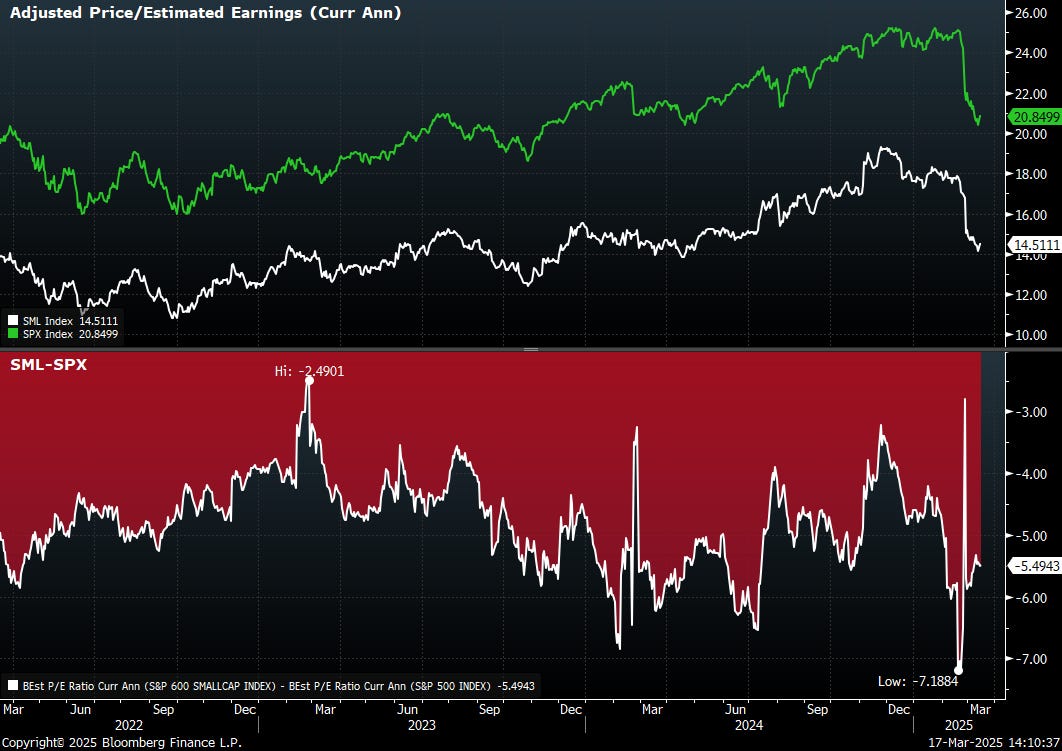
Small cap stocks as measured by the S&P 500 Smallcap index (SML), which we all loved and loaded up on after business friendly Trump won the election, averted a bear market classification by less than a percentage point:

Well, at least the relative undervaluation of small versus large cap stocks did not go away (upper clip estimated PEs / lower clip relative spread between PEs):
Turning to European markets, the broad based STOXX 600 index (SXXP) speaks quite a different, much more bullish picture than its US cousin:

Not only did the index correct less (5% which is considered a pull-back, not a correction), also has it already recovered 50% of the pull-back and the positioning to the 200-day moving average is very different.
Germany’s Dax index has been one of the driving forces in Europe over the past weeks and months and the chart continues to look very constructive:

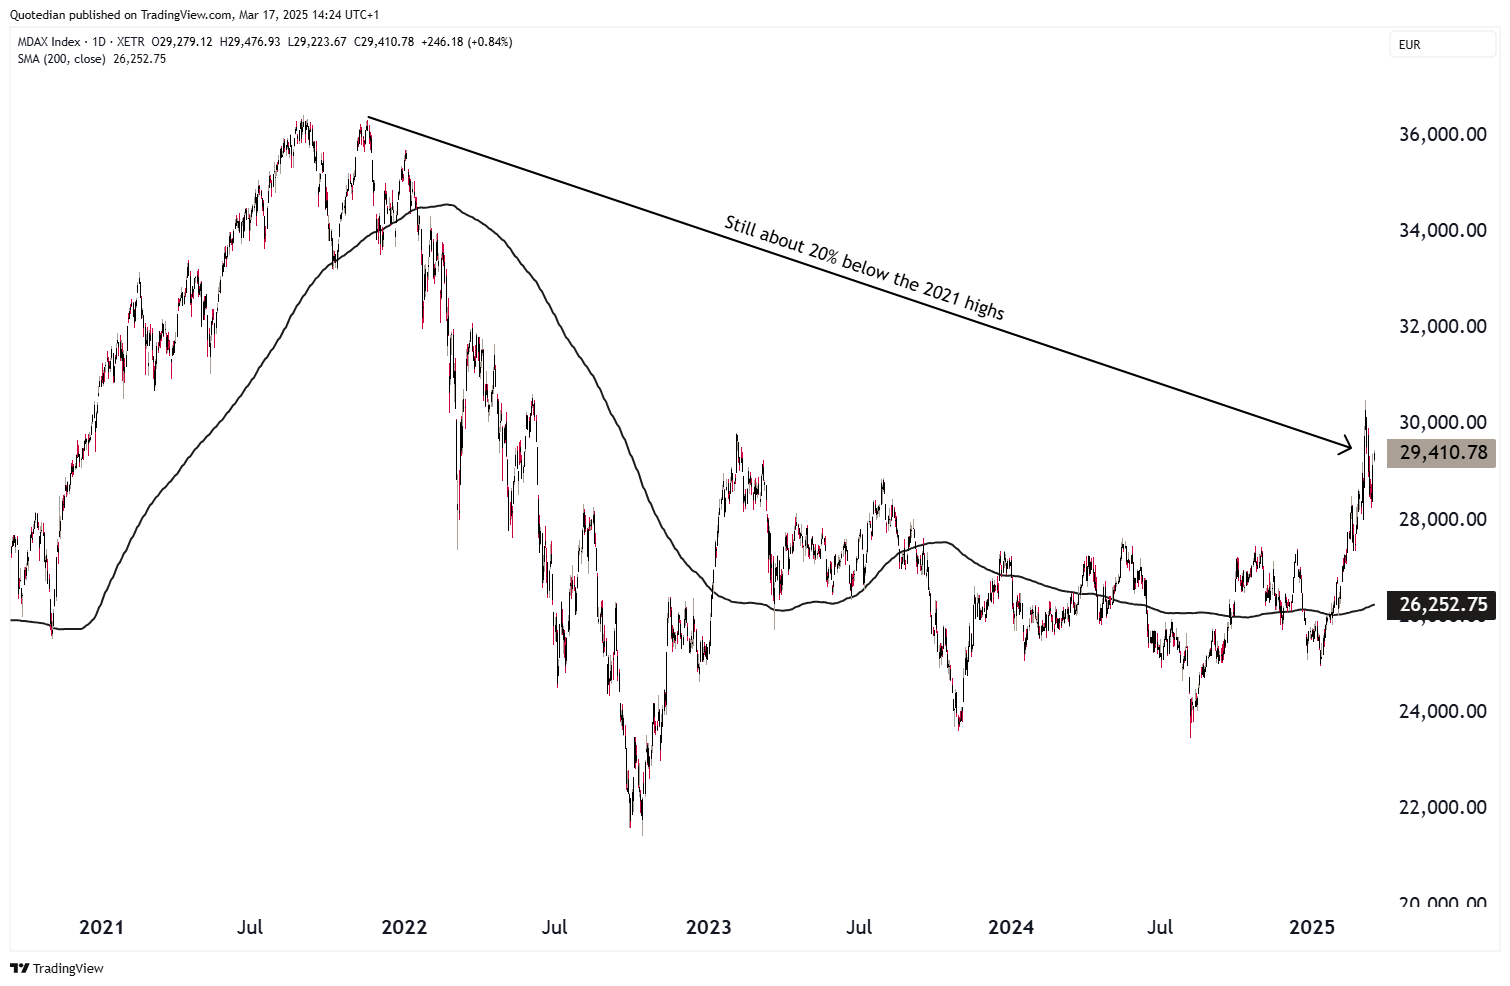
But especially the MDax, an index of mostly domestic-focused, mid-sized German companies has been on a tear since the abolition of the “Schuldenbremse” has been a topic:

Rumours of an agreement between the incoming government and the Greens regarding spending reignite the MDax rally. In historical terms, i.e. zooming out on the same chart above, we note that German stocks are not overbought at all:
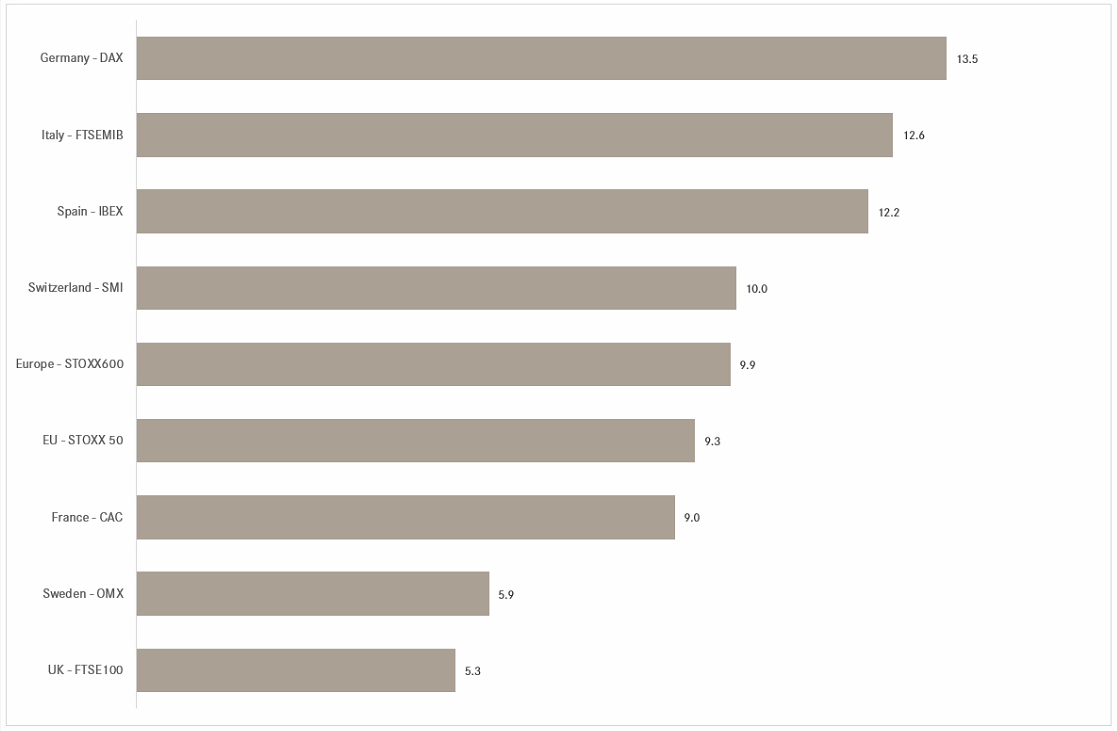
But of course is the DAX not the only ‘thing’ going up in Europe - most major indices on the old continent have seen increases of around 10% over the past three months:
Over in Asia, the focus continues to be on the Chinese equity complex, with Hong Kong’s Hang Seng index continuing to steam ahead:

That’s a massive 60%-plus rally in a just slightly more than one year, though short-term that distance between the current price and the 200-day MA seems like an overstretched rubber band.
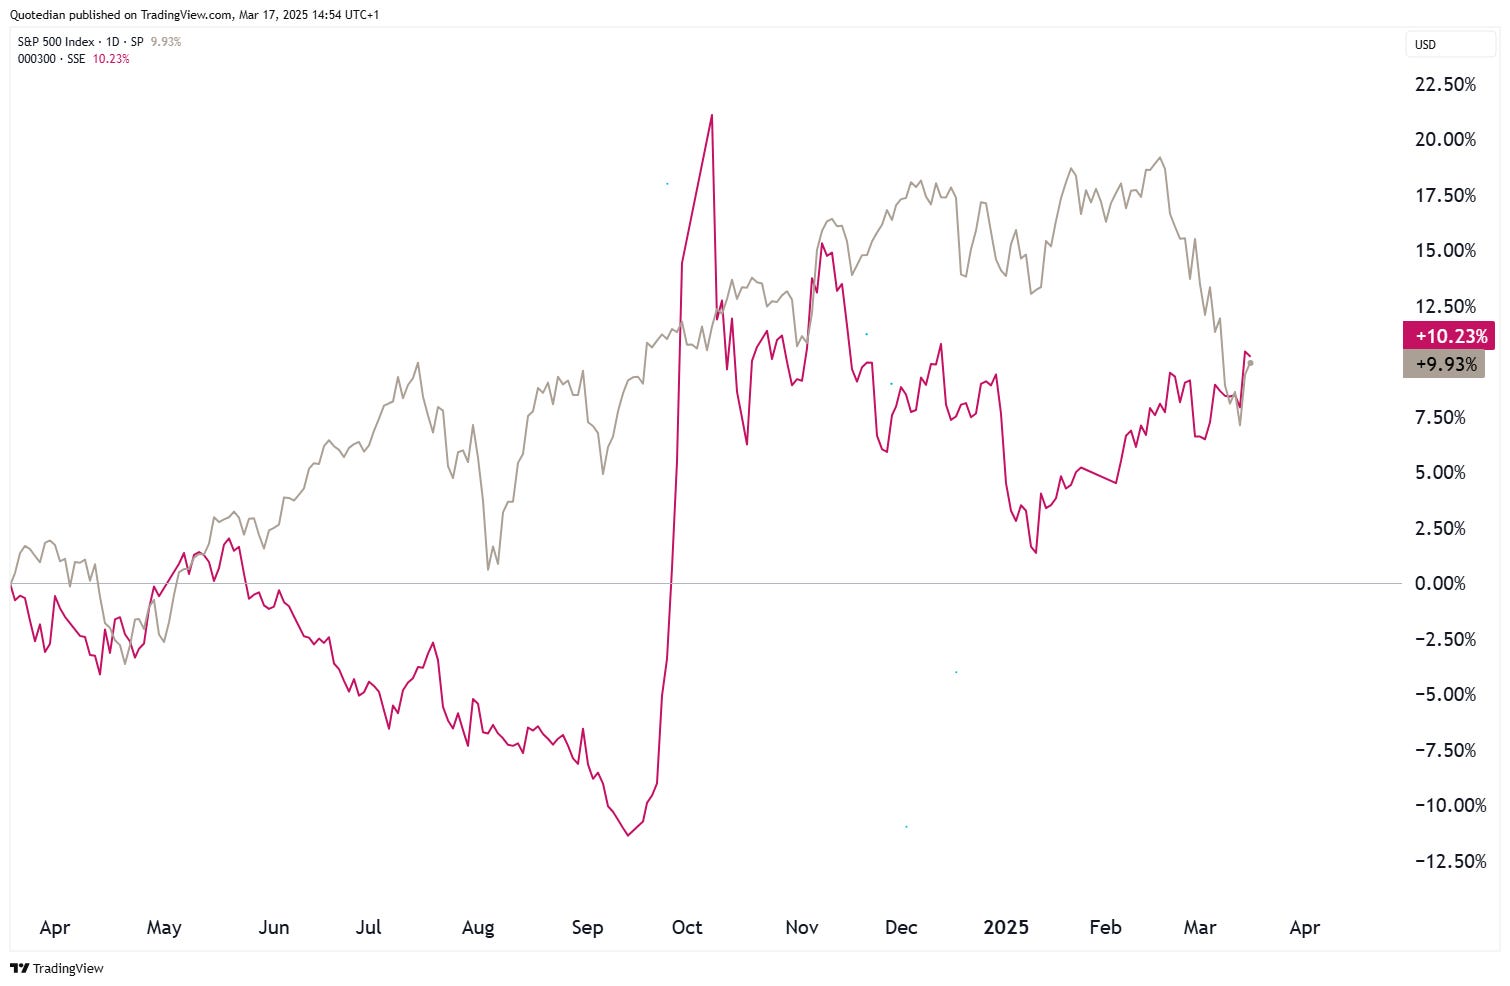
Mainland stocks, as measured by the Shanghai Shenzhen CSI 300 Index, and made up of more domestic focused stocks than the very international HSI, are still lagging somewhat behind:

Nevertheless, they (CSI300 - red) have been the better value proposition than their US counterparts (S&P500 - grey) over the past six,

AND twelve months:
Japan’s Nikkei continues in its now 14-months old sideways consolidation mode. Today’s one percent jump was a very welcome move for the bulls, but more work needs to be done to improve the outlook again:

A move above 37,700 (dashed line) and then breaking above the 200-day moving average at 38,500 would be two major battles won. Watch those levels.
India’s BSE500 has hit, as highlighted las week, our target zone and since then has started to recover:

However, a move above 33,000 (approx. 3%) soon would be necessary to confirm that the cyclical bull is still alive, otherwise risks of a renewed breakdown remain elevated.
To finish the equity section, here are our usual tables of the best performing stocks on both side of the Atlantic and how they have performed over the past week.
Starting with the US list, we note a bit a both - trend continuation for some and an element of mean reversal for others:

Not surprisingly, are the uptrends in Europe firmer:


Unfortunately may Monday has turned in a day full of accidents (read unnecessary meetings) and I have fallen far behind on my writing schedule. Hence in order to get this letter out still in a more or less timely manner, I will literally fly through the remaining sections/asset classes.
Soft economic data coming out of the US has been on the disappointing side for nearly half a year now:

Recently, hard data has been following the soft data southwards.
Interesting here is a chart we also had shown in Friday’s QuiCQ. It shows the performance of a long a basket of stocks that do well in a stagflationary environment and short the stocks that tend to underperform in a stagflationary setting (red line). The chart compares this then to the S&P 500 (grey line):
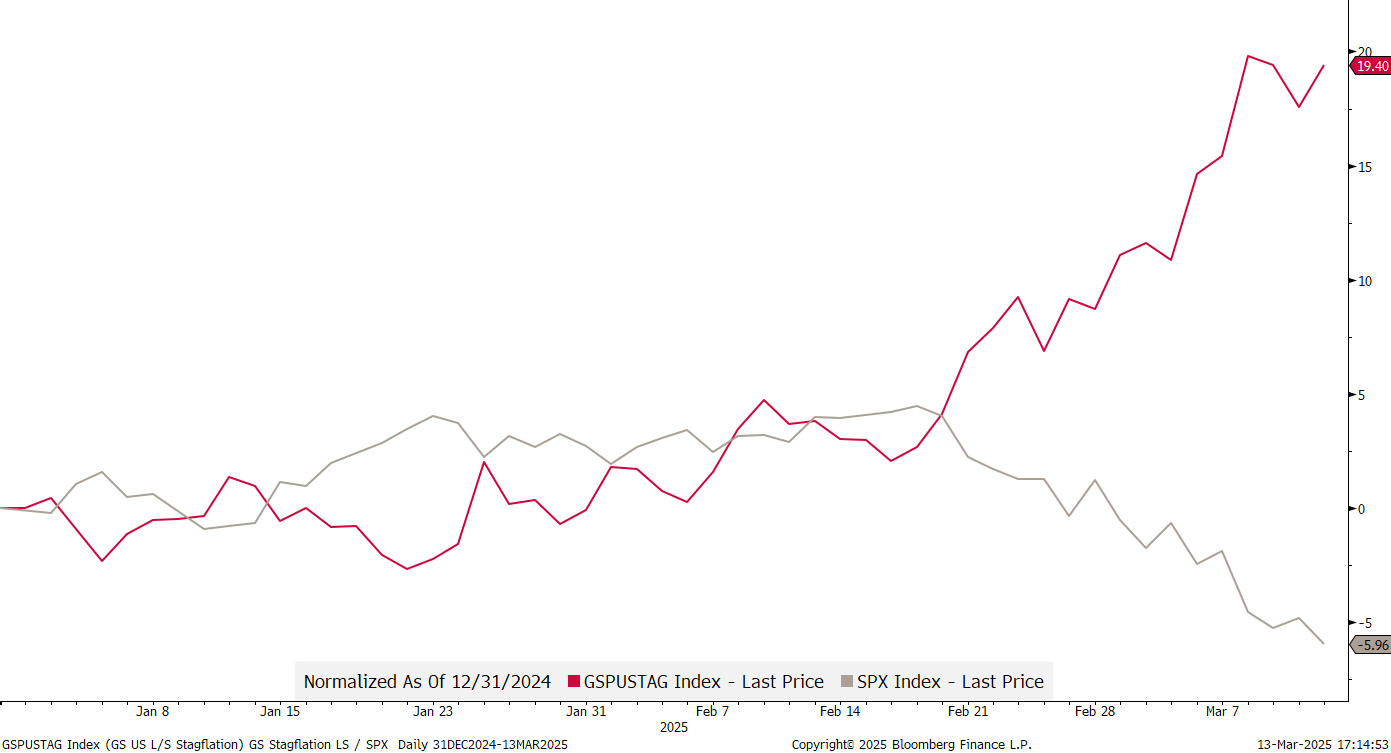
A 25% performance divergence speaks strongly in favour of a the equity market positioning for an inflationary bust:

All the more it will be interesting then to so what the FOMC in the US decides over the coming two days and communicates on Wednesday (European) evening.
The market, via futures, implies no Fed cut, which is also what Powell had communicated last time around:

It will be interesting to see however, how DOVISH this non-cut decision will be communicated …
US 10-year yields are locked in around the 4.30% level at the moment:

Whilst German yields have retreated from their above 2.90% spike of last week:

Credit spreads (US HY below) have finally shown some reaction to the weakness in equity markets,

but again, we are far away from the stressed levels of the past:


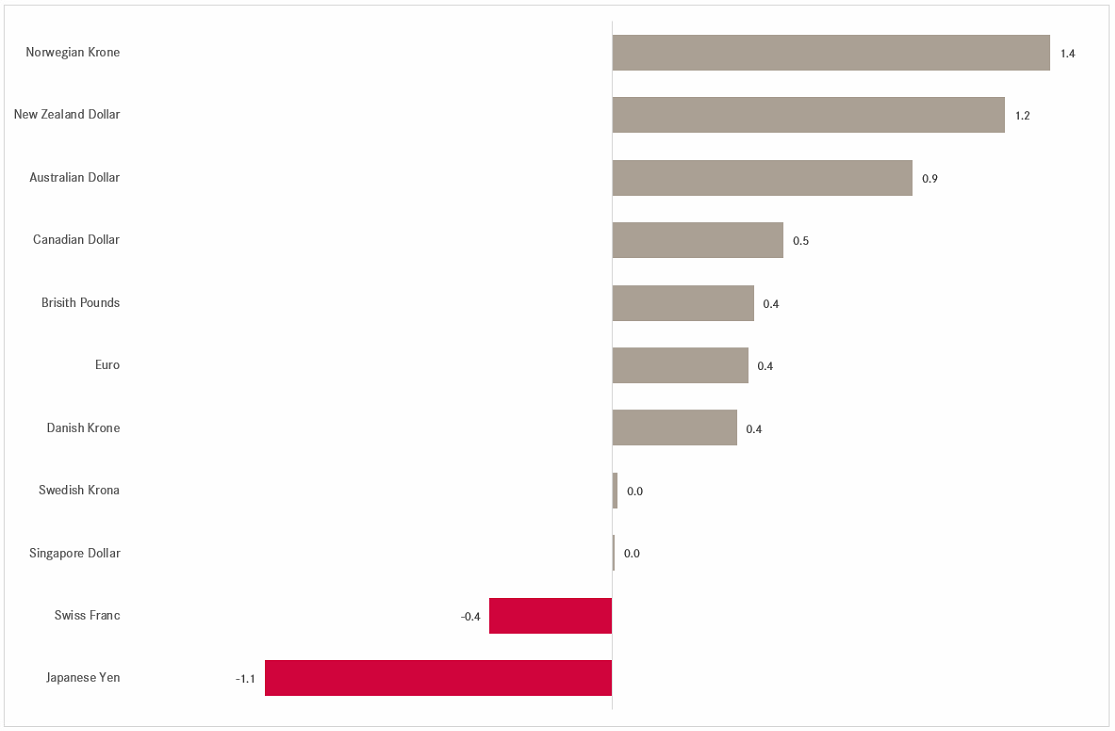
In currency markets, all majors were stronger versus the US Dollar, with except for the two safe-havens (JPY & CHF), which saw a bit of a reversal of their strength of the preceding weeks:
Overall, 2025 has seen the second weakest start for the Greenback (US Dollar Index - DXY) over the past thirty years. Only in 2008, a memorable year, was the USD even weaker at this stage:

And judging from the EUR/USD cross chart, that weakness may continue as it looks likely the currency pair will reach the 1.10-1.12 zone soon:

Cryptocurrencies got a bit of a breather from selling pressure last week, but continue firm within their downward sloping intermediate term trend channel:


Finally, just one chart in the commodity section, but one chart to rule them all.
GOLD!

Trading around the $3,000 handle, it seems pretty clear from the chart above where the price of the yellow metal is heading …
Again, my sincerest apologies for rushing it in the end - please make sure to sign up to the QuiCQ to get your daily investment deliberations fix Tuesday through Friday!
We started this week’s letter by looking at how long President Trump has been in his second term.
Let’s finish then by checking how much he (and we - sigh) have left:


"Alright, that’s it for this week. Same time, same place, next week. And don’t say I didn’t warn you."

In reality, you need no other Disclaimer than the one above, but just in case:
Everything in this document is for educational purposes only (FEPO)
Nothing in this document should be considered investment advice
Investing real money can be costly; don’t do stupid shit
Leave politics at the door—markets don’t care.
Past performance is hopefully no indication of future performance
The views expressed in this document may differ from the views published by Neue Private Bank AG