M.I.A.
The Quotedian - Vol V, Issue 140
“From failed moves come fast moves”
— Market adage
DASHBOARD
AGENDA
CROSS-ASSET DELIBERATIONS
With great concern, we take note of the news hitting the headlines that an entire family has gone missing in action (M.I.A.) this week. The family, lovingly called “the 08/22 parallels” by close friends, has been apparently been swiped from the surface of our planet over the last two days, with no one in the know where they could have gone. In case you spot one of the family members, even though local investment authorities already doubt it, here is a picture from as recent as last week of one of the members (but all 10 to 15 family members recently spotted really strongly resemble each other):
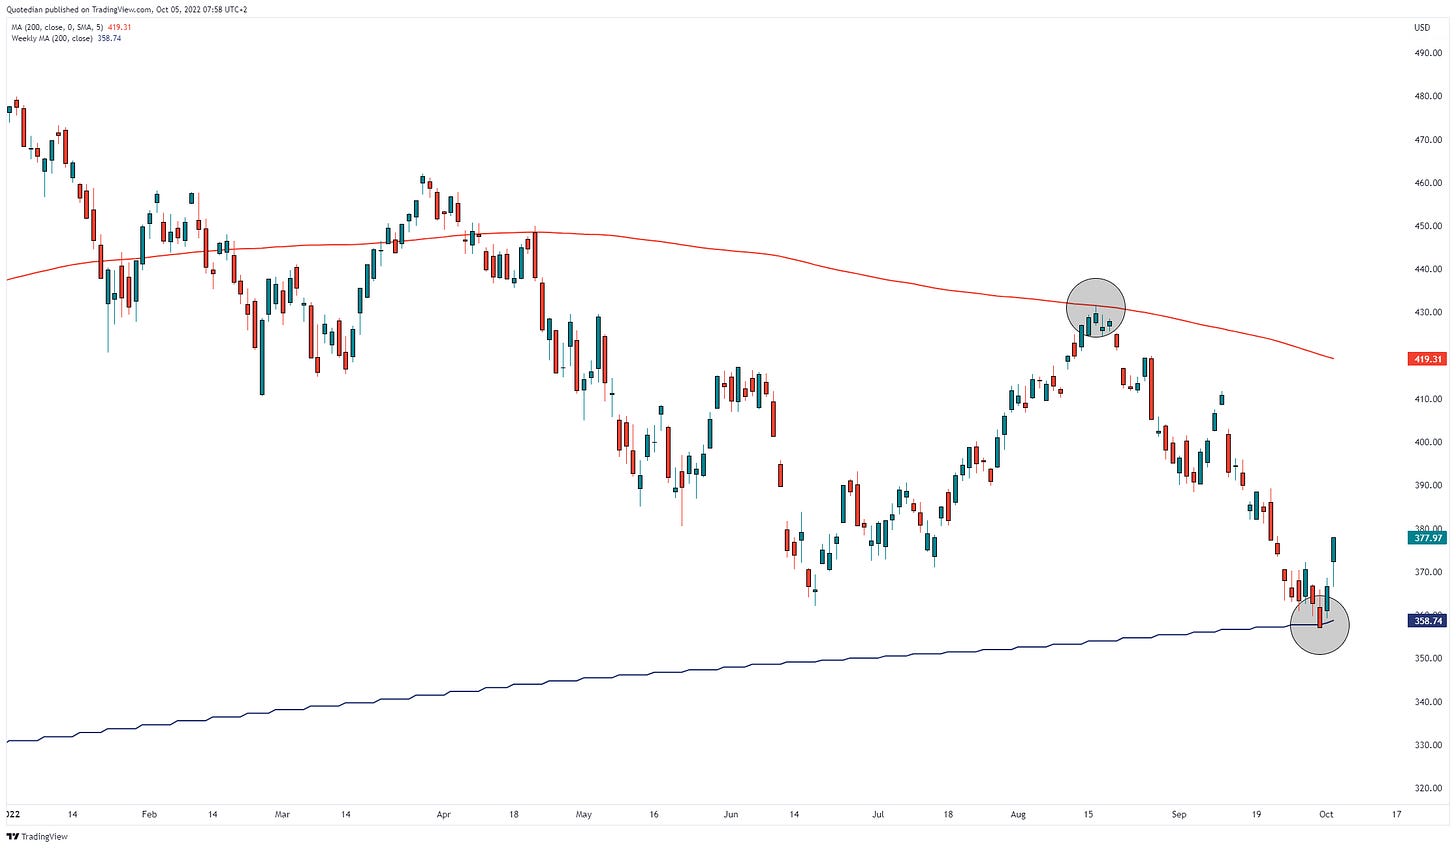
On a more serious note, the main function of Mr Market is too fool (aka screw) as many investors as often as possible. Consider this chart of the S&P 500 since the beginning of the year:
Three false breakouts to the upside (aka bull traps) now followed by a bear trap? Also, refer to today’s QOTD.
At the end of the day, and depending on the type of investor you are, two different factors are important to investment success:
Investors — A plan (i.e. asset allocation)
Traders — Sound risk management (stop losses to let you live and fight another day)
And of course, are both NOT mutually exclusive of each other for neither type of investor.
So, yesterday bought the second day of strong gains for global stock markets, with the STOXX 600 and the S&P 500 stampeding ahead in excess of three percent. Let’s have a quick look at two longer-term charts on the latter.
For one, coincidence or not, the S&P turned lower at its 200-day moving average back in mid-August and now turned higher at its 200-week moving average:
Secondly, with the upturn over the past two days, the S&P 500 boxed itself just about out of the secular bear market danger zone on our inverted traffic signal chart:
From failed moves …
Breadth was even stronger than on the already super-bullish Monday, if at all possible. 93% of stocks advanced on the STOXX 600, whilst that number stood at 98%(!) for the S&P 500. I think that should qualify for one of those bullish ‘Breadth Thrust’ signals and give us some more upside over the coming weeks.
Sector performance not only speaks for itself due to the broadly spread colour green but also because the lagging sectors are the traditionally more defensive sectors:
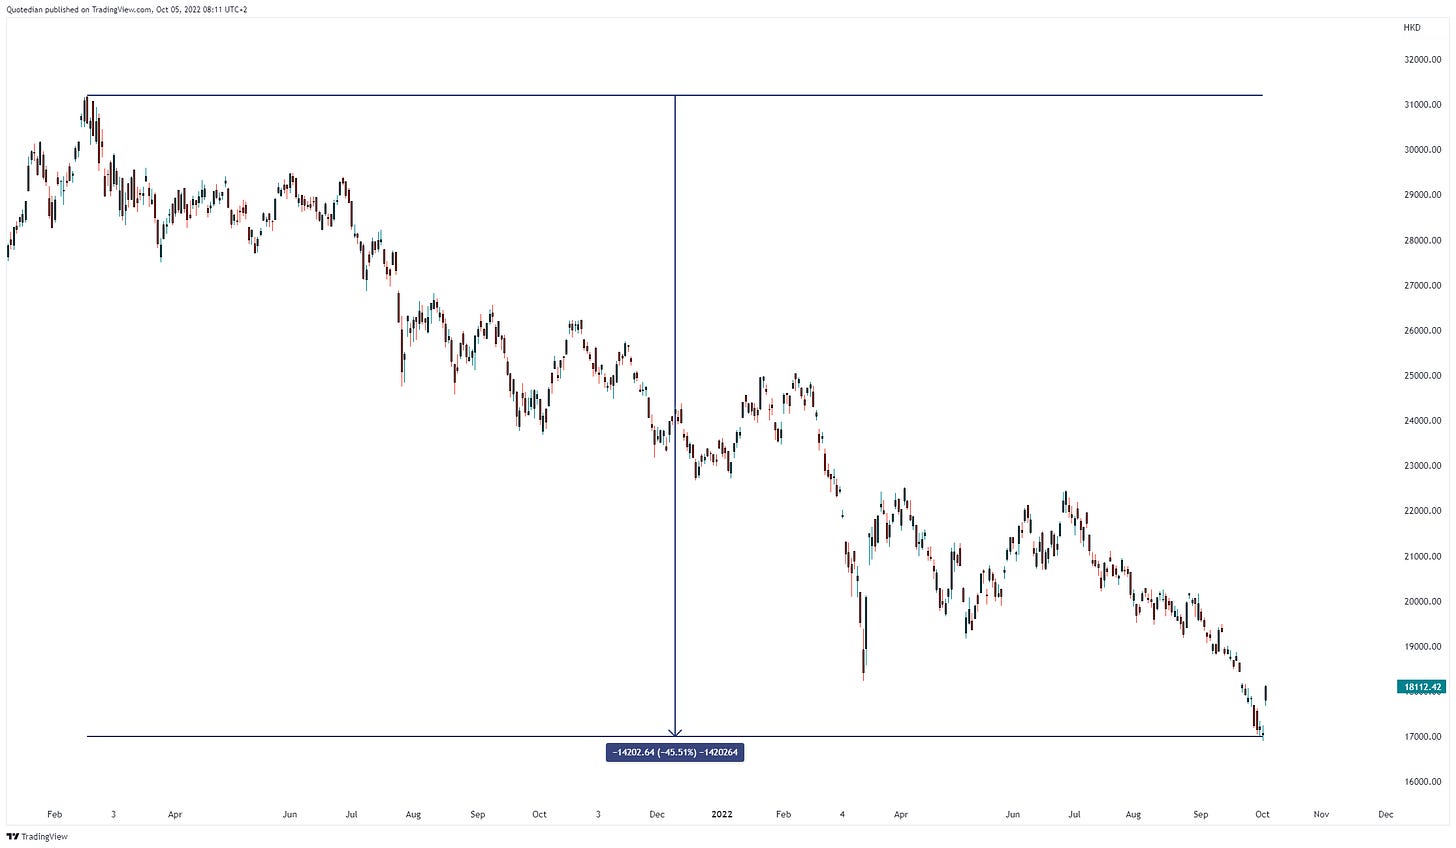
Asian markets continue with the bull run this morning, with the wider region gaining about one percentage point. Hong Kong stocks stand out with a 5%-plus rally after the market was closed there for a few sessions. But we also need to remember that the Hang Seng (HSI) was down 45% top to bottom before today’s relieve rally:
Moving into bonds (kind of), yesterday brought us the latest reading for Eurozone PPI:
That’s some scary shit and takes out a lot of the “feel good” injected in the equity section above. Europe has an energy problem, which will continue to affect industries and consumers alike. Consider this:
Potentially a headline text template we may need to get used to.
And then add in the strain on consumers from all kind of angles (not only from missing apple sauce, which is sad enough in itself):
Let’s quickly move on!
Yesterday I wrote: “The German Bund also looks like it could retest at least 1.80%, which is previous resistance now turned support”.
No sooner said than done.
Otherwise, it was a fairly quiet day on the interest rate risk front. Probably worth mentioning for completeness is that New Zealand’s central bank hiked their key monetary tool as expected by half a percentage point.
On the credit risk side of bond things, credit spreads tightening noticeably in yesterday’s session, probably best illustrated via the largest corporate high yield ETF out there (HYG):
Switching to currencies, if you remember I wrote on Thursday in Hotel California that a turn in the US Dollar could precede a turn in risky assets (e.g. equities) and … so far, so good! If that pattern should continue to hold we have a some good news and potentially a problem ahead:
Good news is that the Dollar turn lower continues and the potentially bad news is that the EUR/USD has reached the upper end of its trend channel, which so formidably held over the entire year… Maybe if it could just break above …
I still have an interesting observation to share on FX markets, but given the advance time it is and all the material you have to digest in today’s Quotedian already, I will keep it for tomorrow, most likely in the form of the COTD. Stay tuned ... 😈
Some encouraging signs (for risk-on) on the commodity side, where copper seems to have some more upside ahead:
Oil is also trying to find some bottom, which may partially based on rumours that OPEC+ is to strongly cut output (2 mln barrels per day), partially on the announcement that US will stop depleting its Strategic Petroleum Reserves. The latter is a headline a think I saw crossing my screen yesterday, but cannot find it again right now. Any suggestions?
In any case, what should be really bullish for oil is not the stop of depletion of the SPR, but once they decide it could be a good idea to rebuild inventory (at its lowest since the early 1980ies) for a TRUE emergency, not for an election:
Time to hit the Send button - have a great Wednesday!
André
CHART OF THE DAY
One chart possibly adding to some tactical bullishness is today’s COTD, showing how the number of new 52-week lows has not only been diminishing over the past few sessions (green arrow) before the rally of the past two days started, but also less new 52-week lows have been reported than back in June. Double positive divergence so to say:
But just before you get too bullish, here’s a secular bear reminder:
Thanks for reading The Quotedian! Subscribe for free to receive new posts and support my work
.
DISCLAIMER
Everything in this document is for educational purposes only (FEPO)
Nothing in this document should be considered investment advice
Past performance is hopefully no indication of future performance


