

Runaway Train
Vol VIII, Issue 35 | Powered by NPB Neue Privat Bank AG

“There are three kinds of lies: Lies, Damned Lies, and Statistics”
— Mark Twain
Enjoying The Quotedian but not yet signed up for The QuiCQ? What are you waiting for?!!

Last week we asked in The Quotedian (click here) whether recent Bear Sightings were a warning side of an Ursus Magnus approaching, or just your friendly neighbourhood bear

saying good-night before going into hibernation.

Well, turns out it was probably the latter, as equities and other spotlight assets have recovered quickly from a little slump and more and more resemble a Runaway Train.
Which is by the way also the title of a great 1993 song by alternative rock band Soul Asylum and is embedded here to accompany you through this 15-minute read:
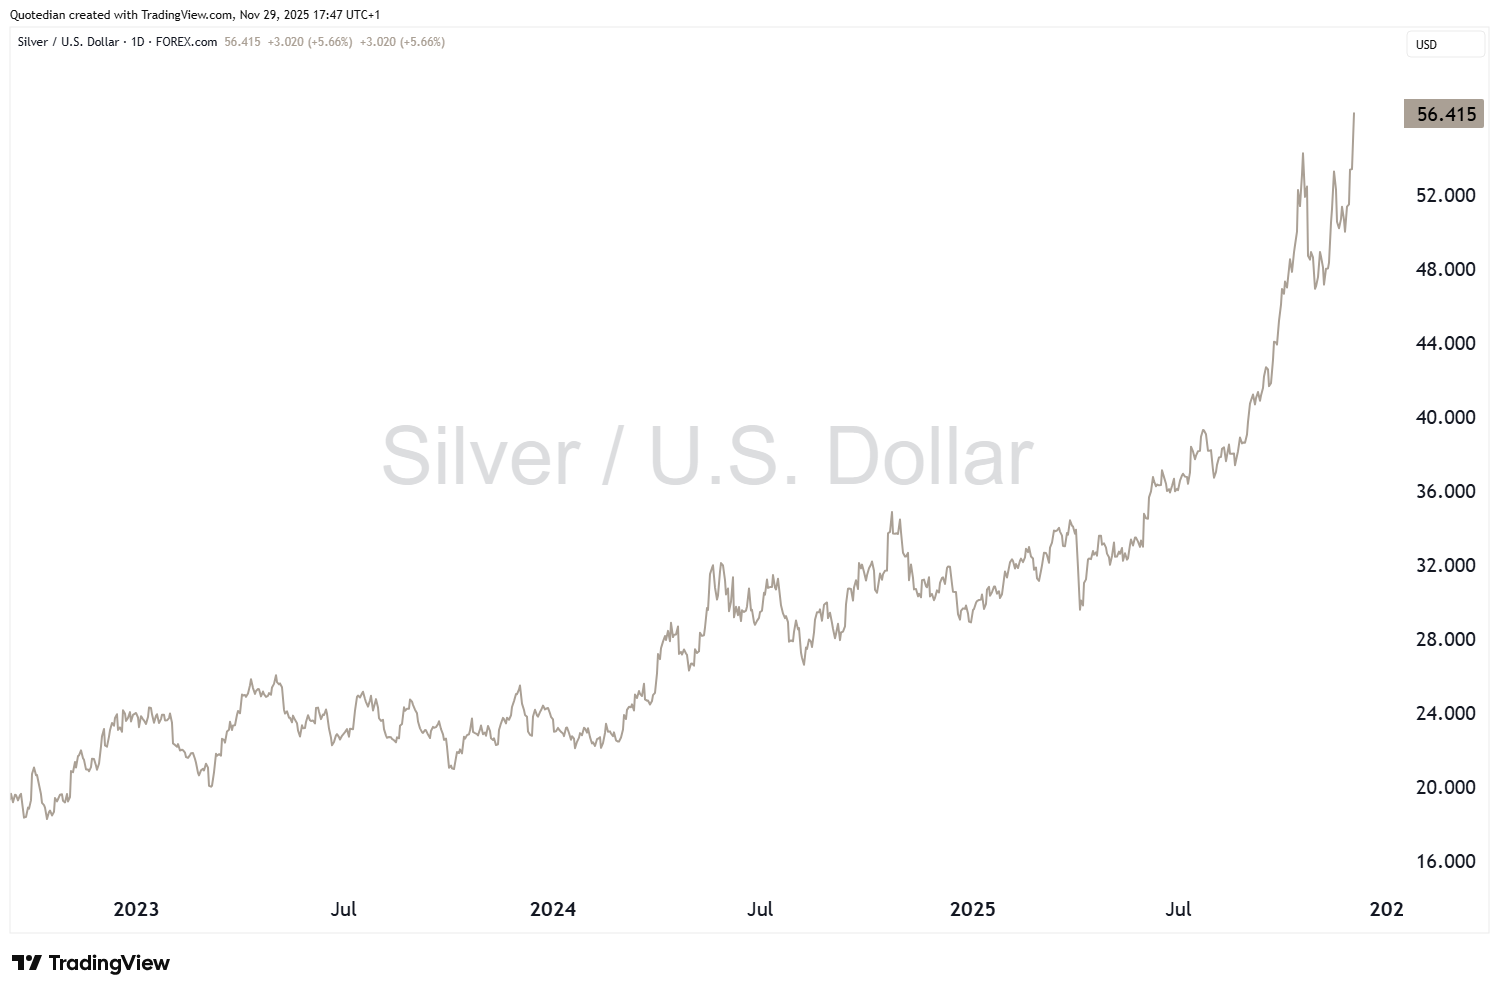
But as mentioned, in this case we are with Runaway Train not referring to missing children, but rather to some assets steaming higher and higher. Point in case - Silver:
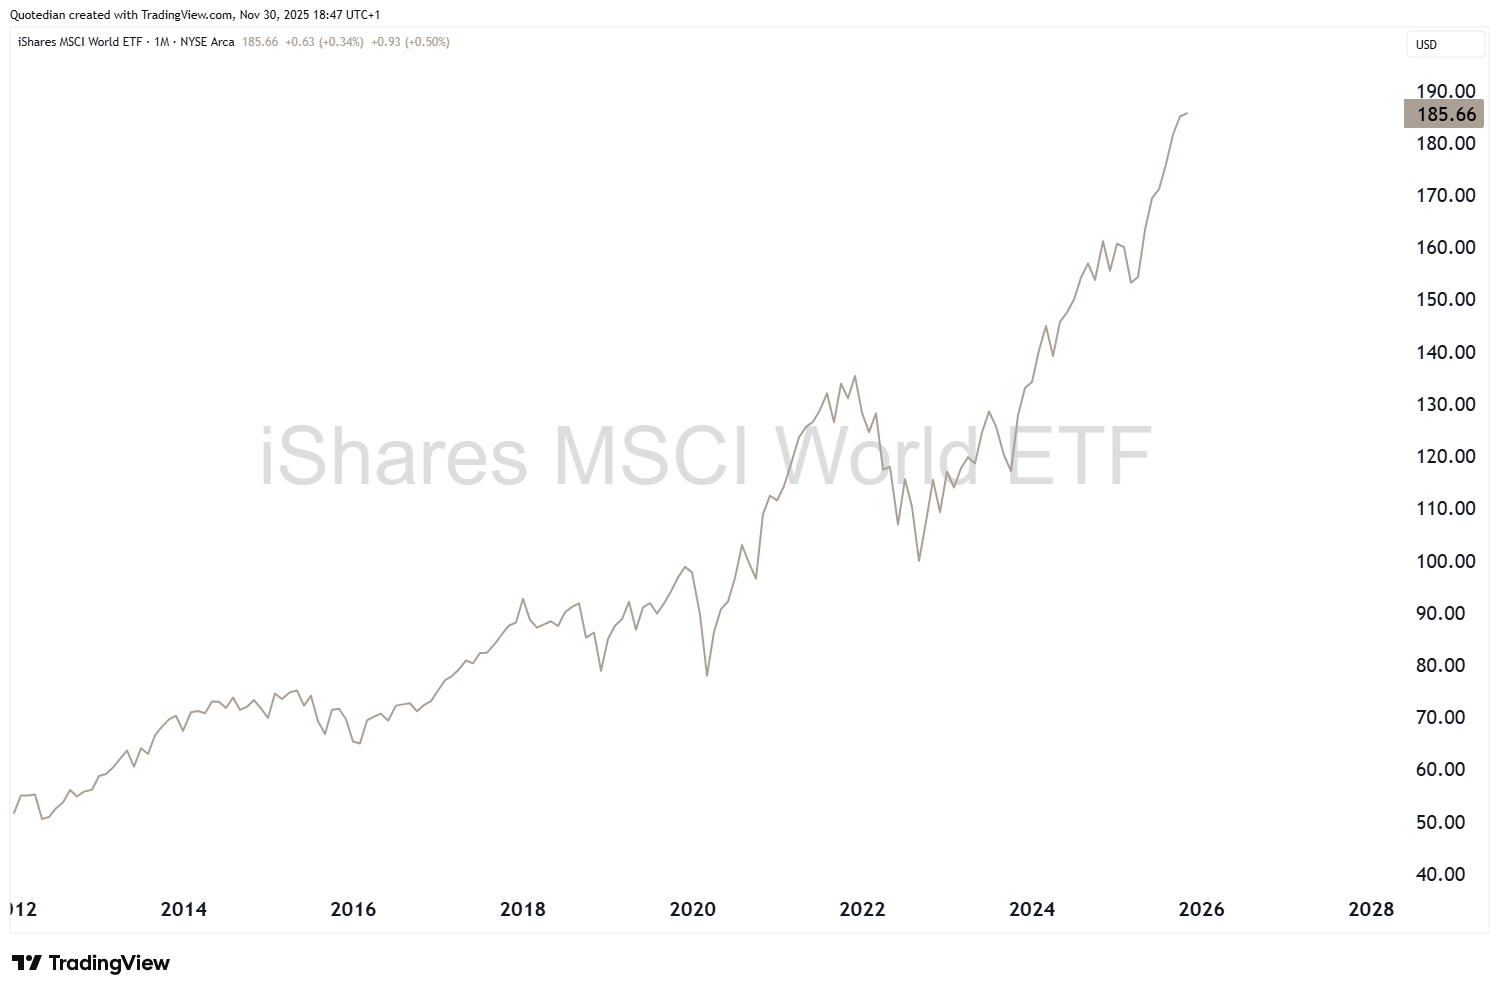
Or Global stocks:
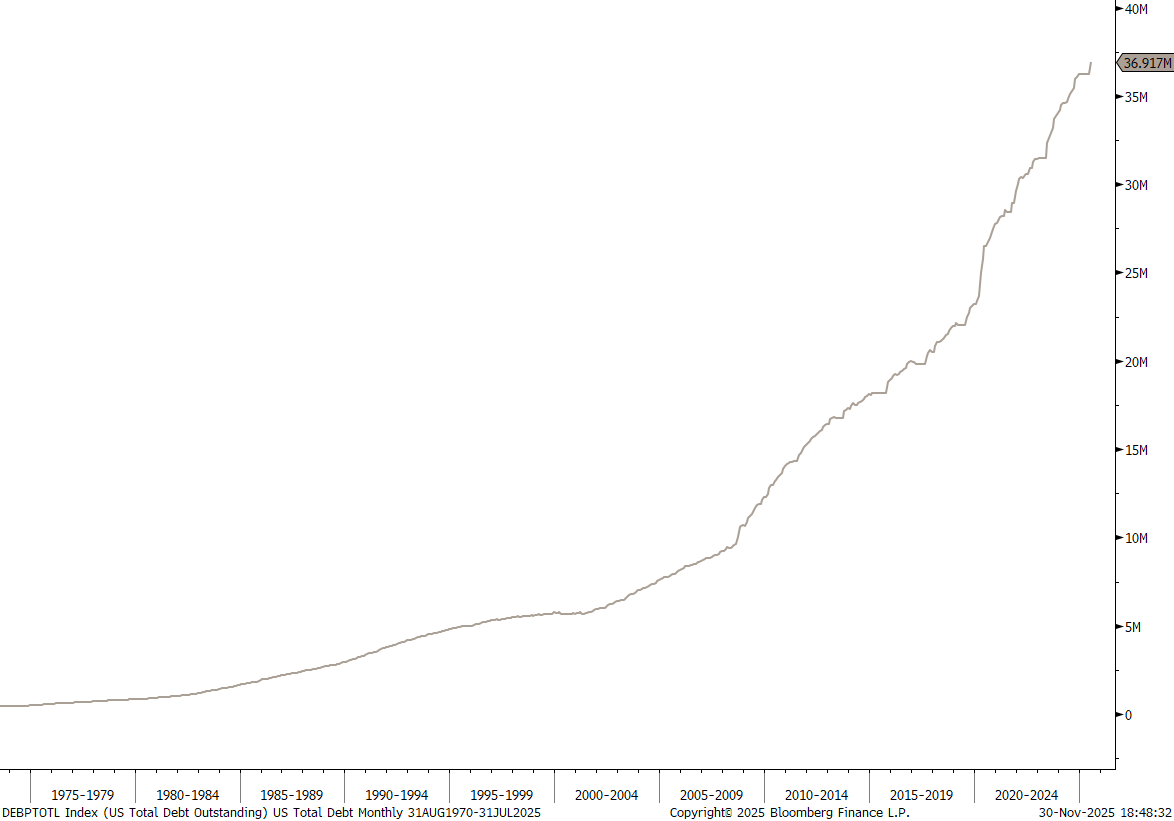
Or US Total Debt:
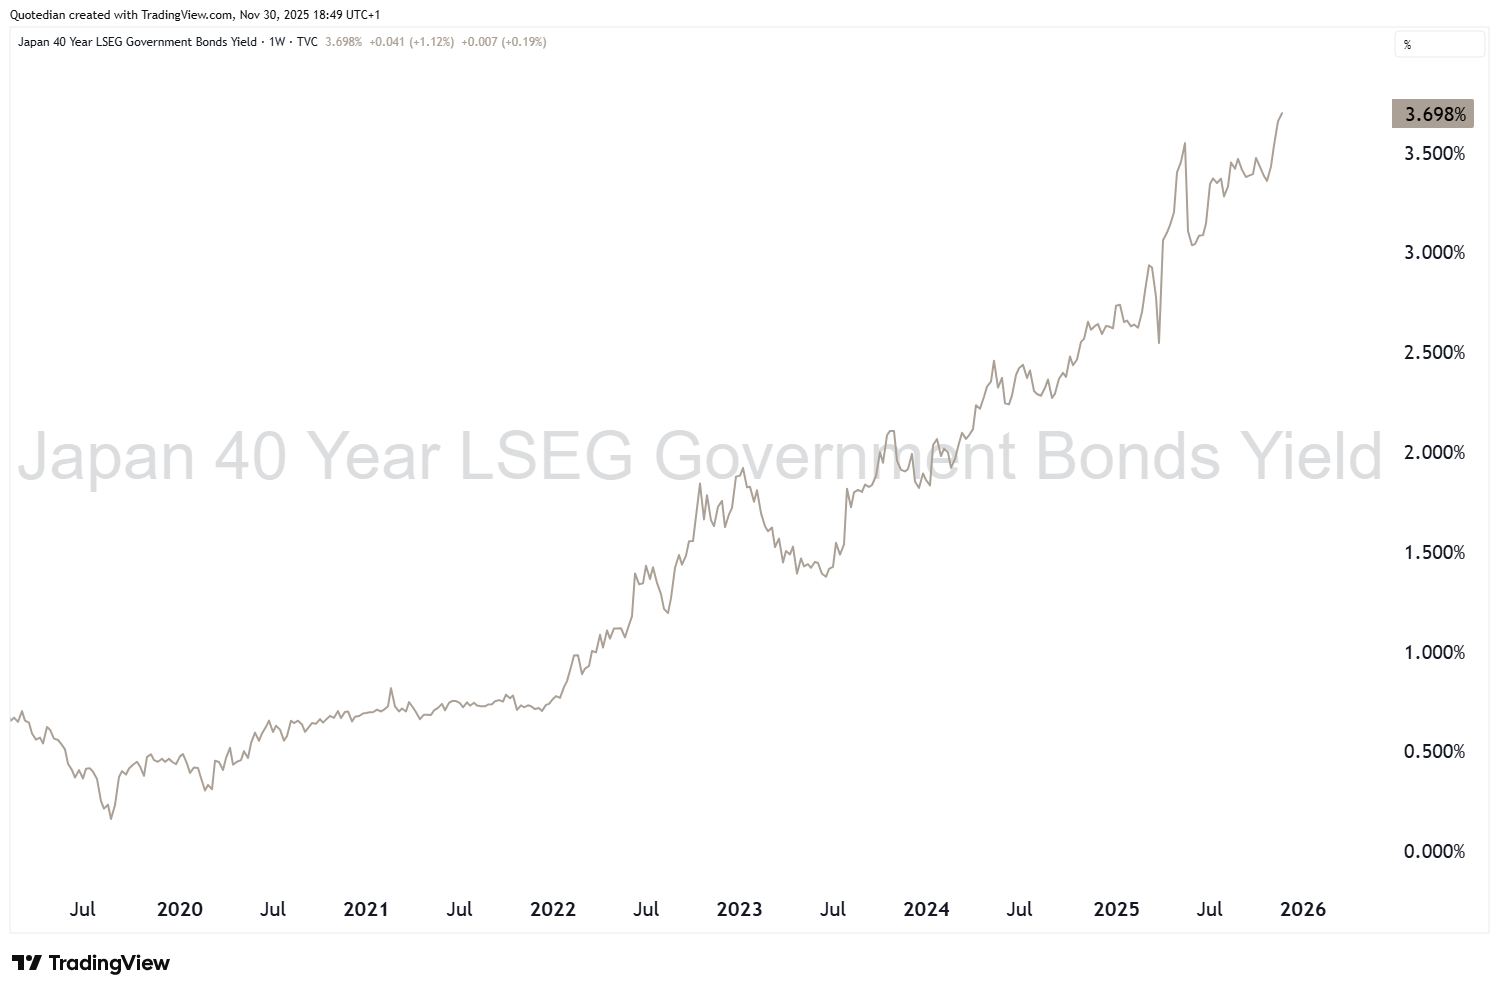
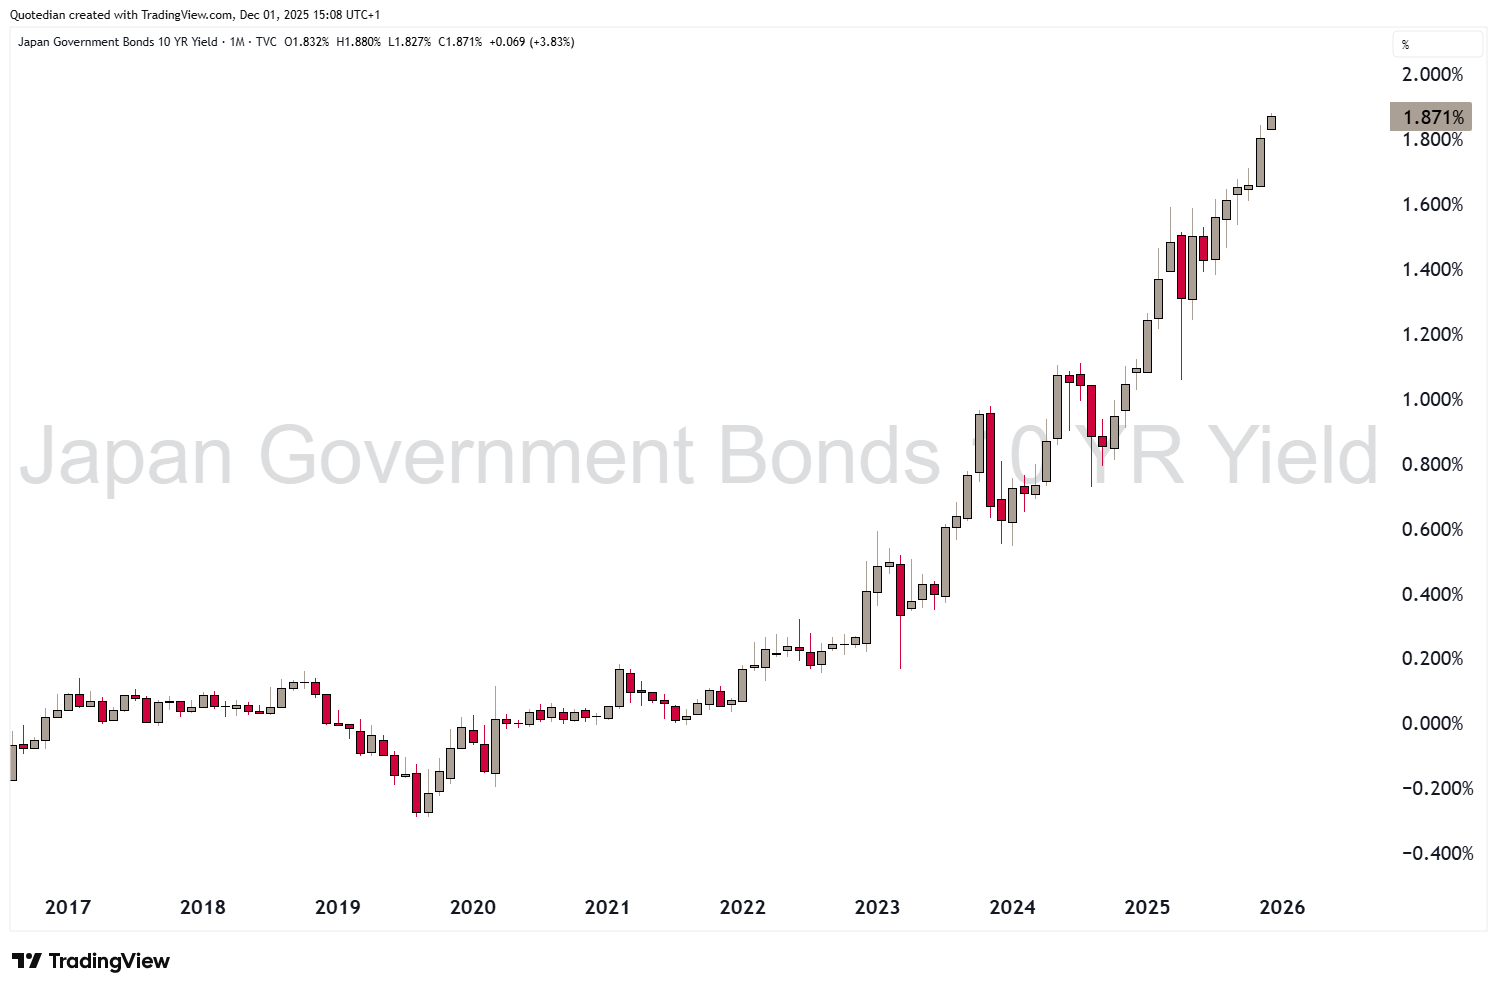
Or Japanese long-term JGB yields:
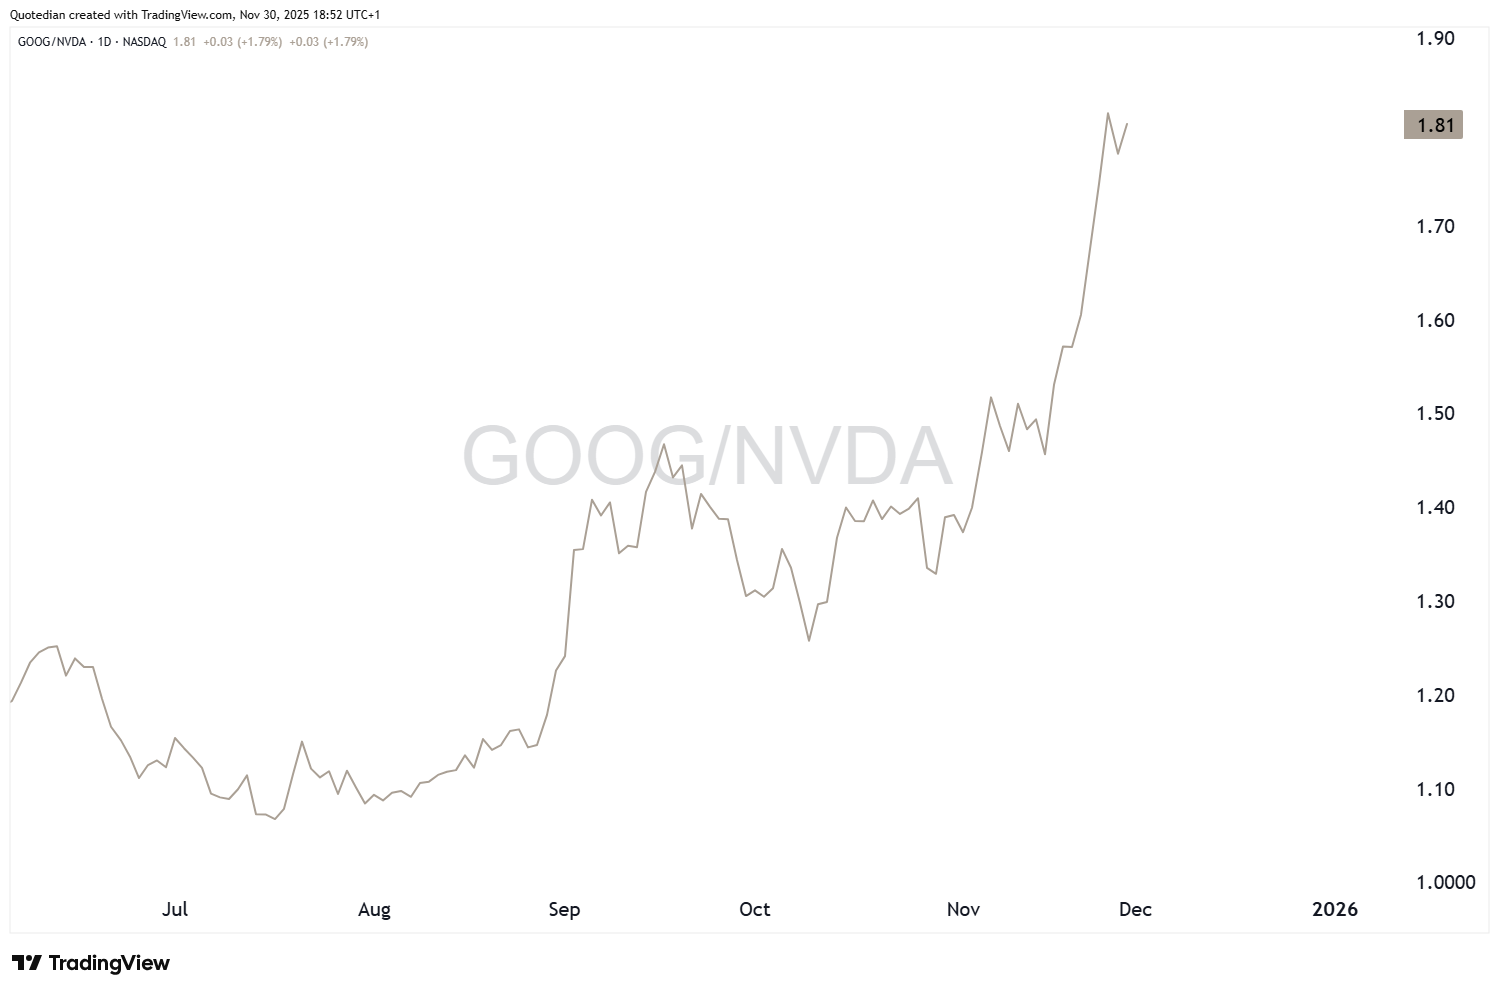
Or even the Google-to-Nvidia ratio:
Let’s look at all these Runaway Trains and more, but as this is the month-end edition of your all-time favourite financial newsletters, focus will also be on our usual statistical performance update and zoom out on the charts to get a monthly look at what is going on across the different asset classes.
And off we go …

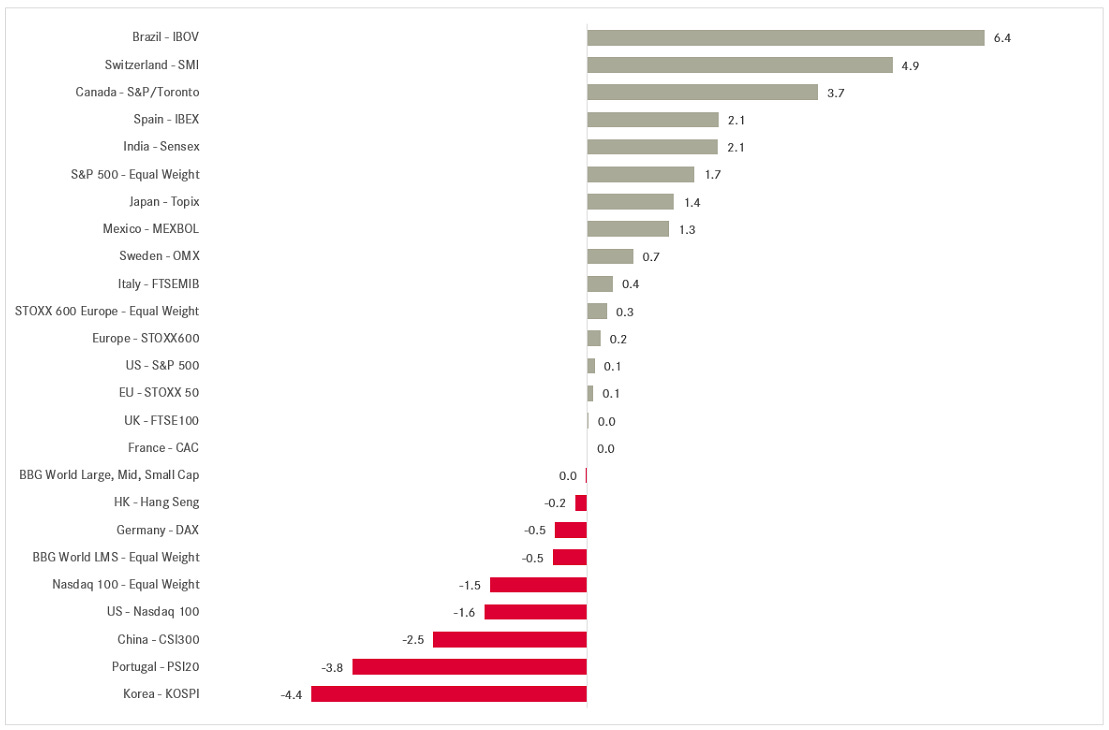
November started difficult volatile for most equity markets, but as the performance table below shows, with a HAPPY END for most:
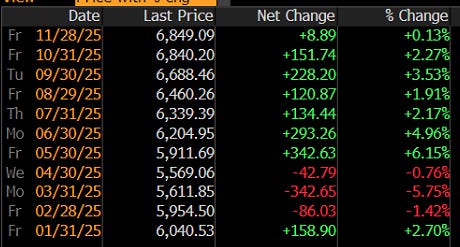
The mighty S&P 500 surged by just about enough to eke out a 30 basis point rise on the month, leaving a similar long shadowed candle (aka hammer) as in April:
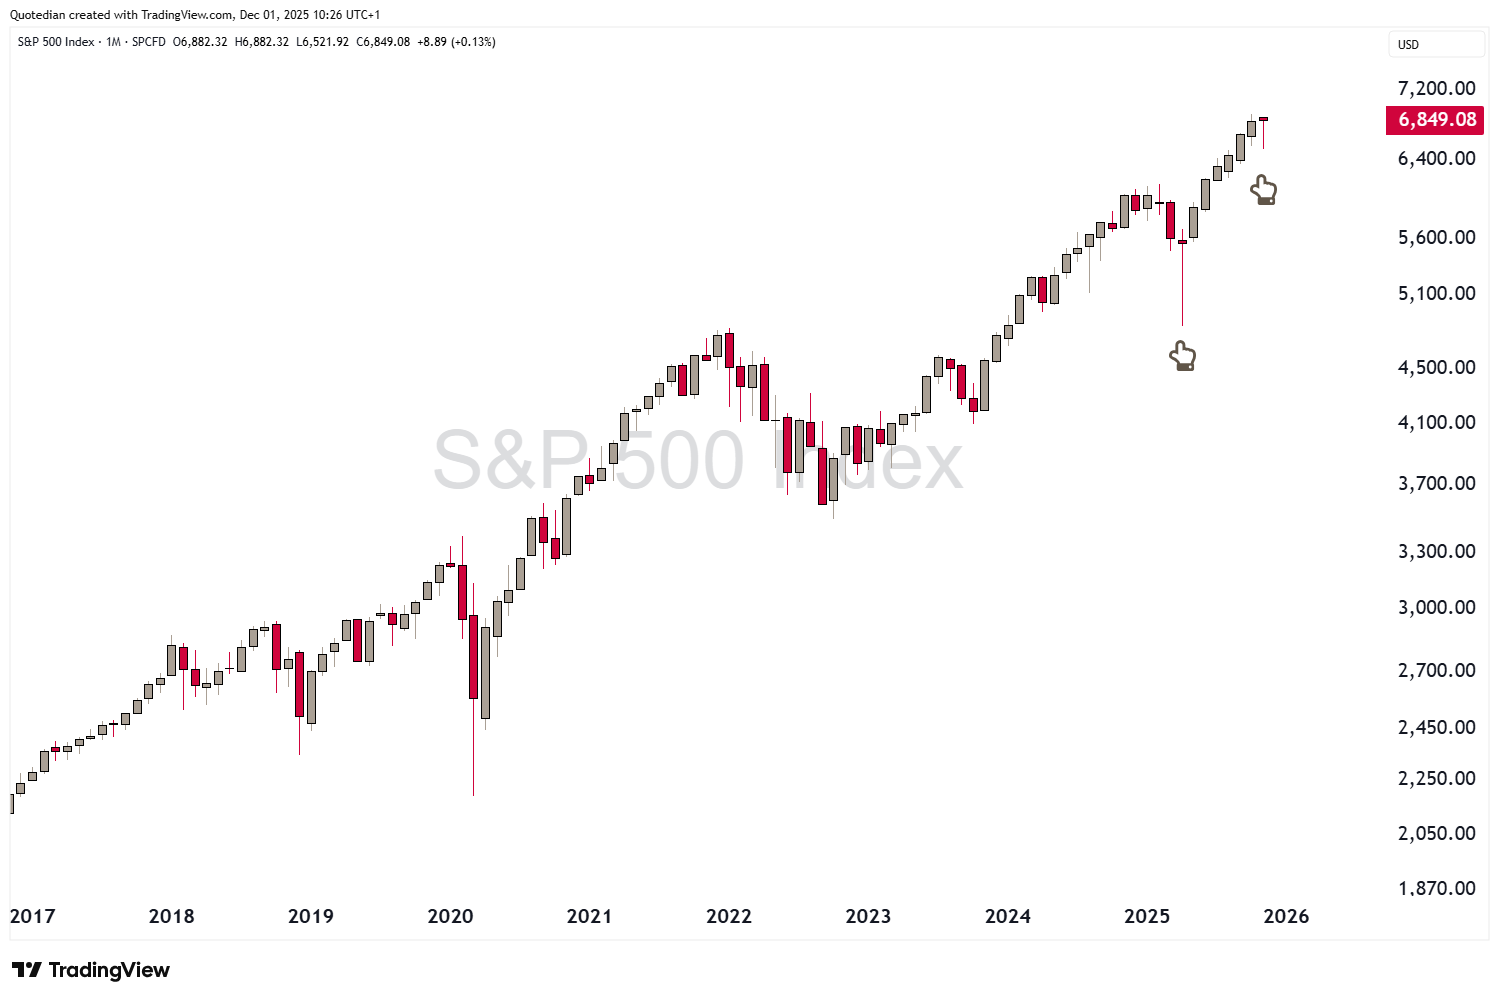
This makes it now 8 out of 11 up months for the S&P and the seventh consecutive one since the Trump Tariff Tantrum (TTT) calmed down:
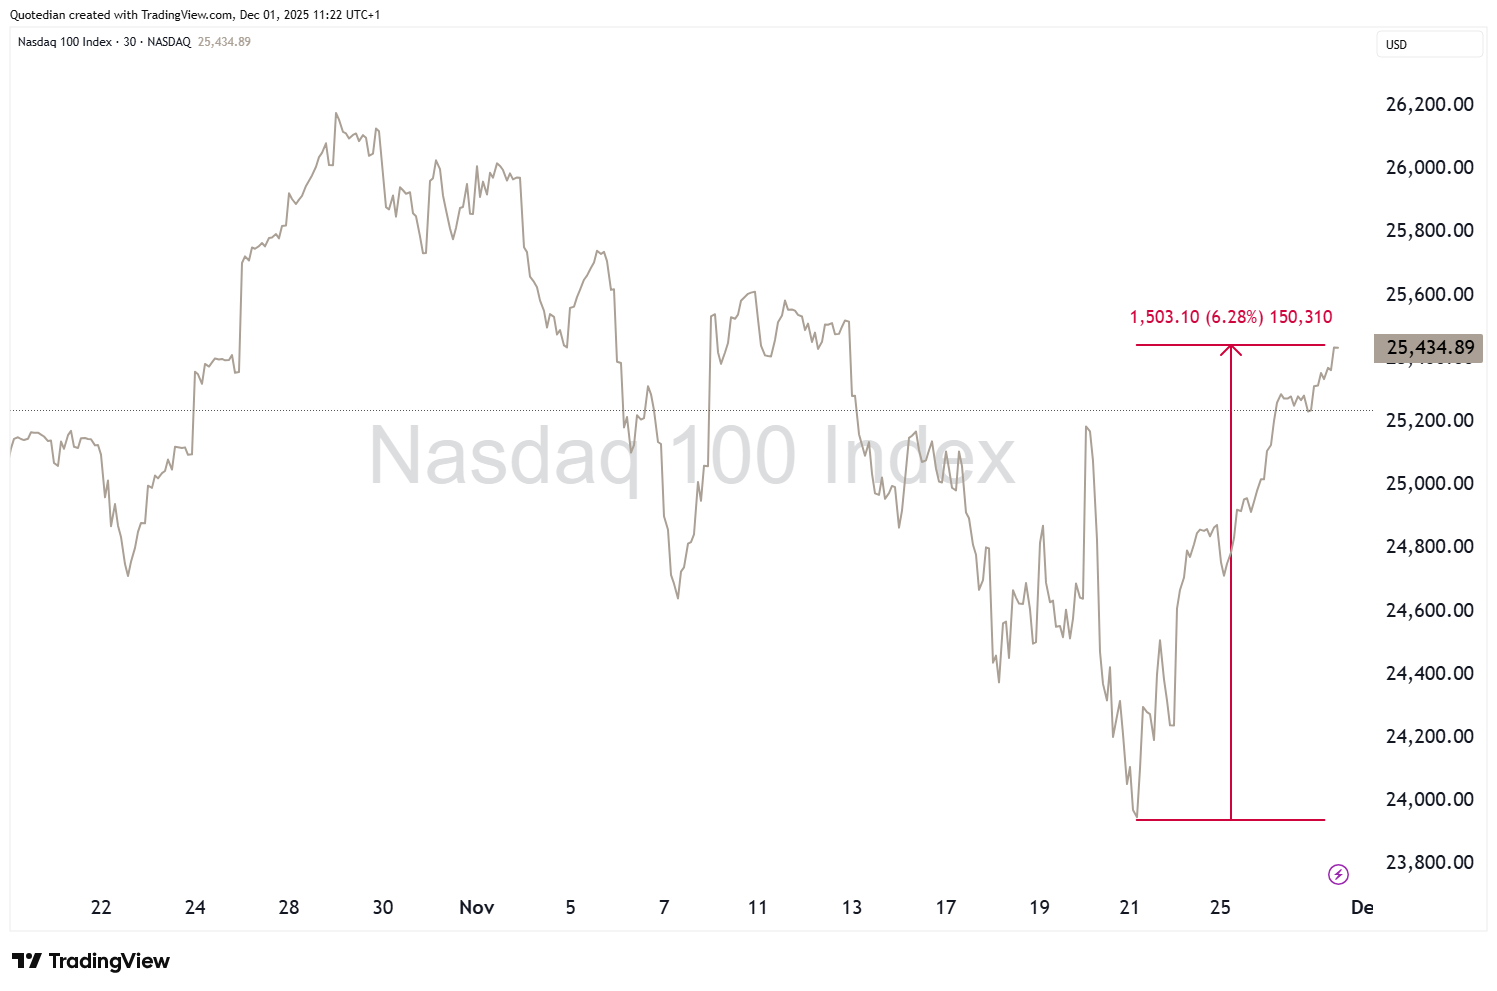
The Nasdaq closed the month about half and a percent lower,
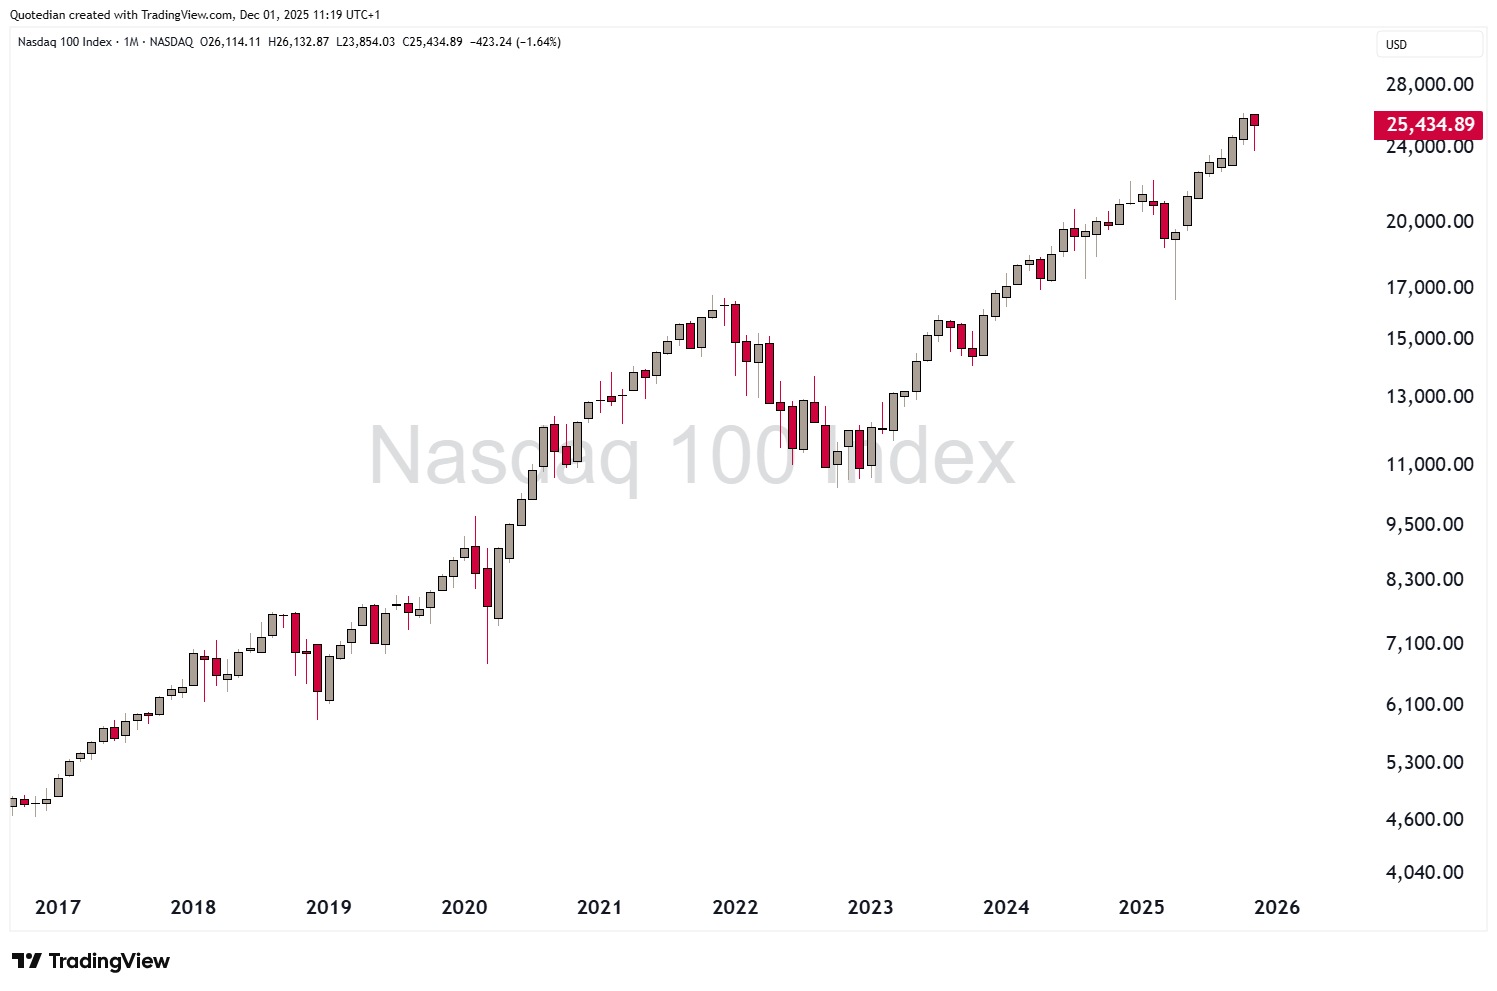
despite a massive late-month rally attempt (+6%):
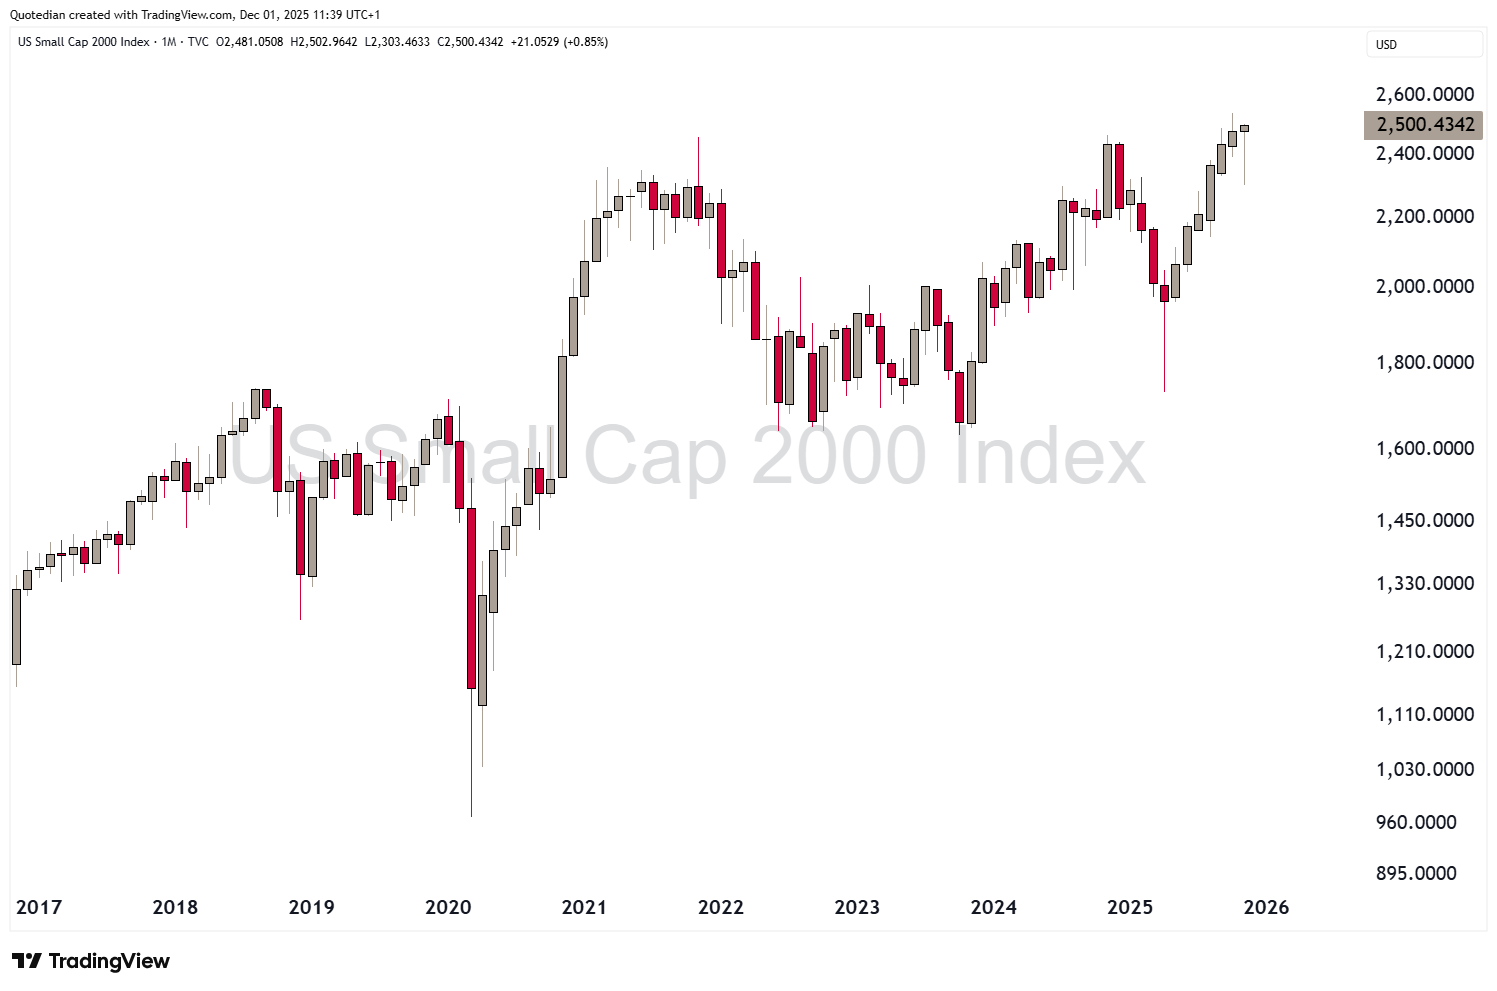
Small cap stocks had an even stronger, nearly 10%-rally from the November 21 lows,
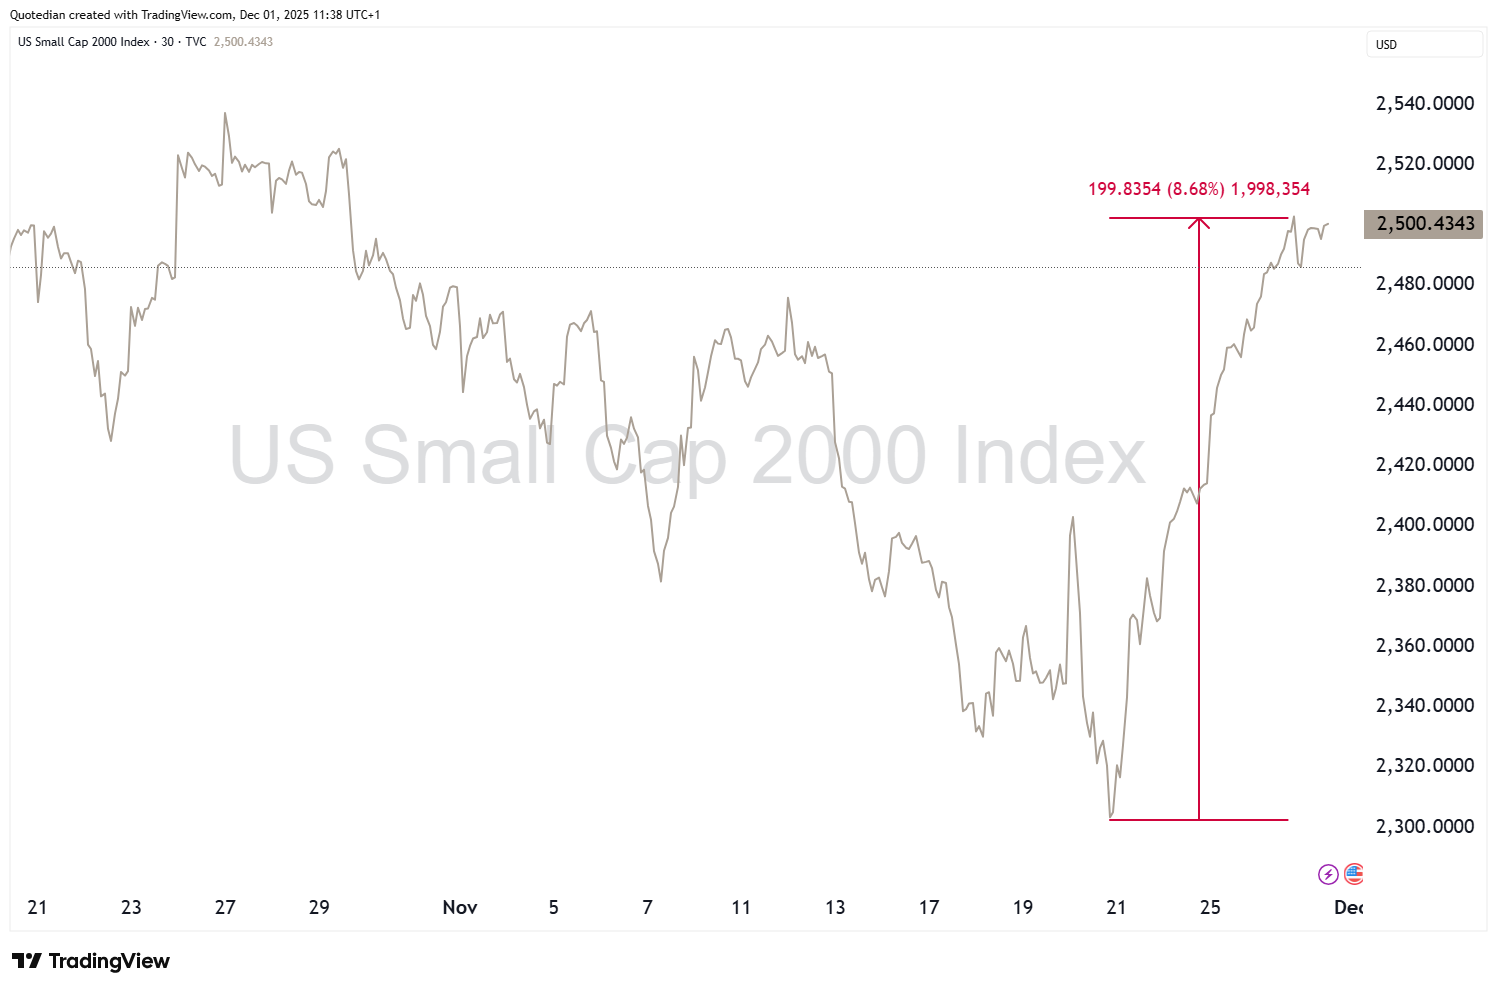
to close the month up nearly one percent at more importantly, at a new all-time high:
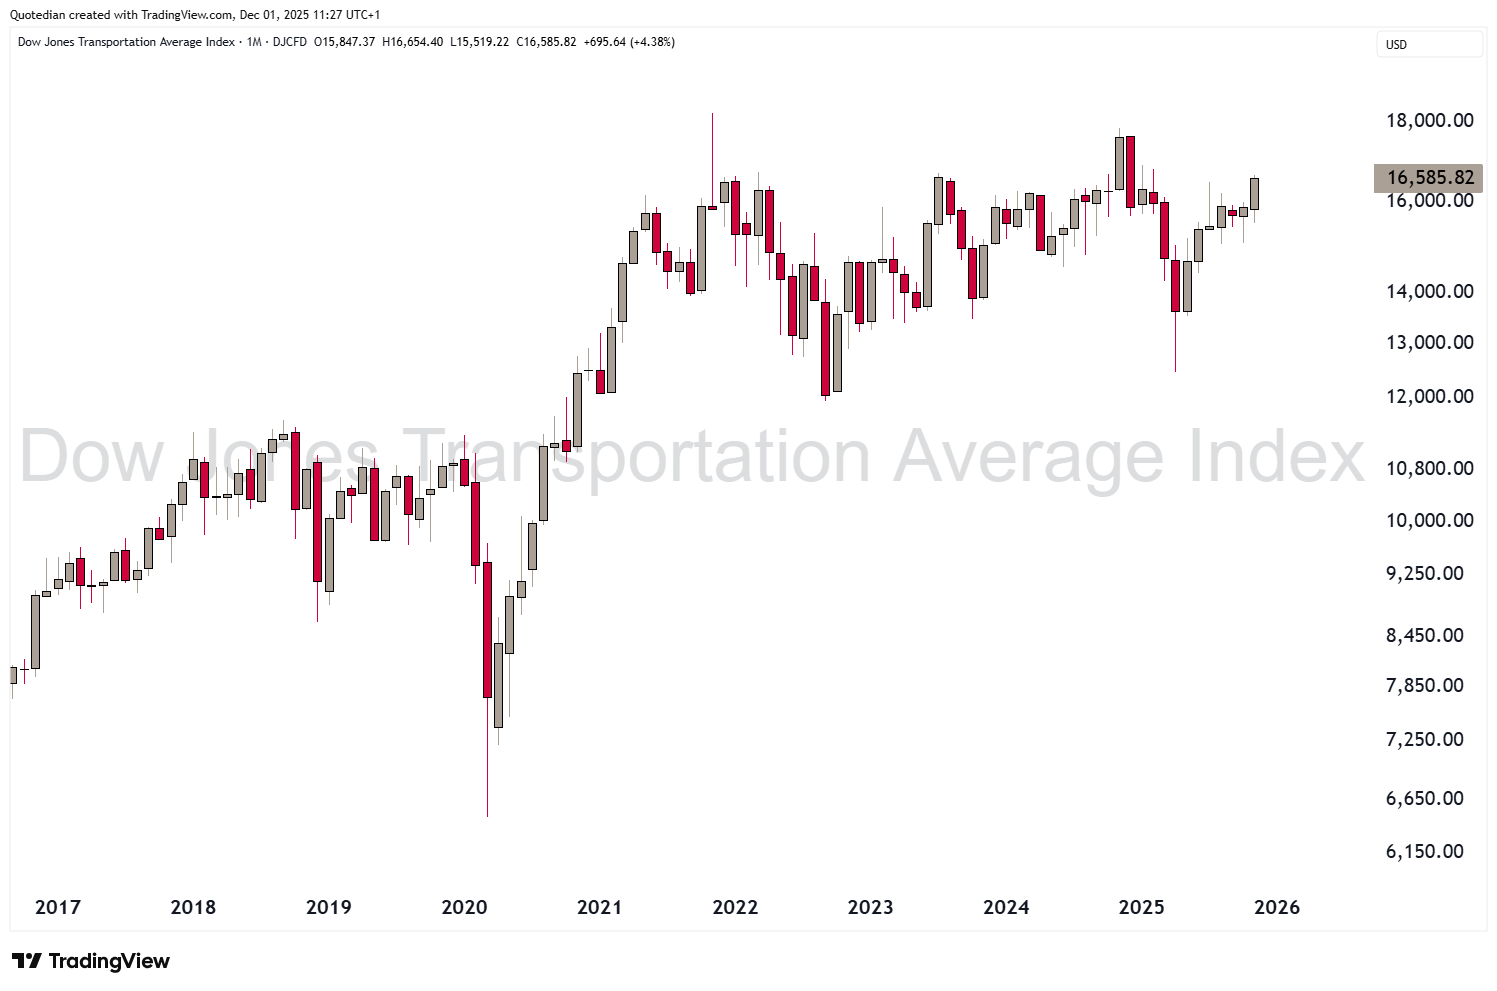
The Dow Jones Industrial index (not shown) also eked out a tiny (+0.3%) gain on the month, but maybe more importantly the Dow Jones Transport index reached a new cycle high and is only six percent away from a new all-time high, all but confirming a Dow Theory Buy-Signal:
In Europe, Spanish shares (IBEX) have been on a Runaway Train since the October lows in 2023, summing up gains in excess of 125%:
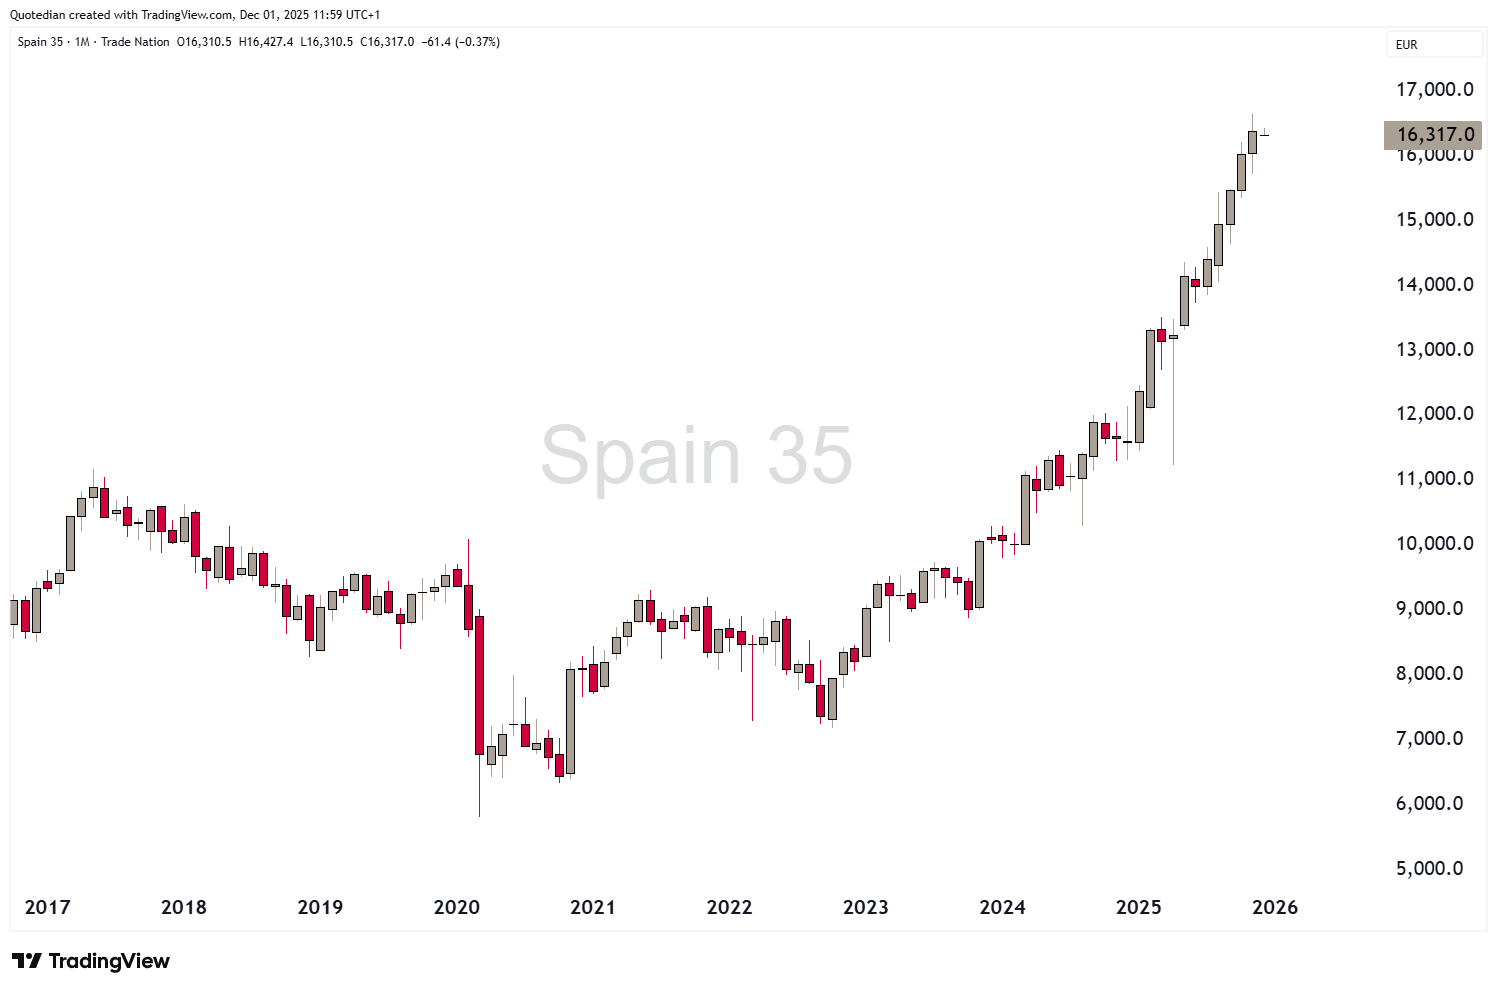
That chart is starting to looking parabolic on a non-log scale!
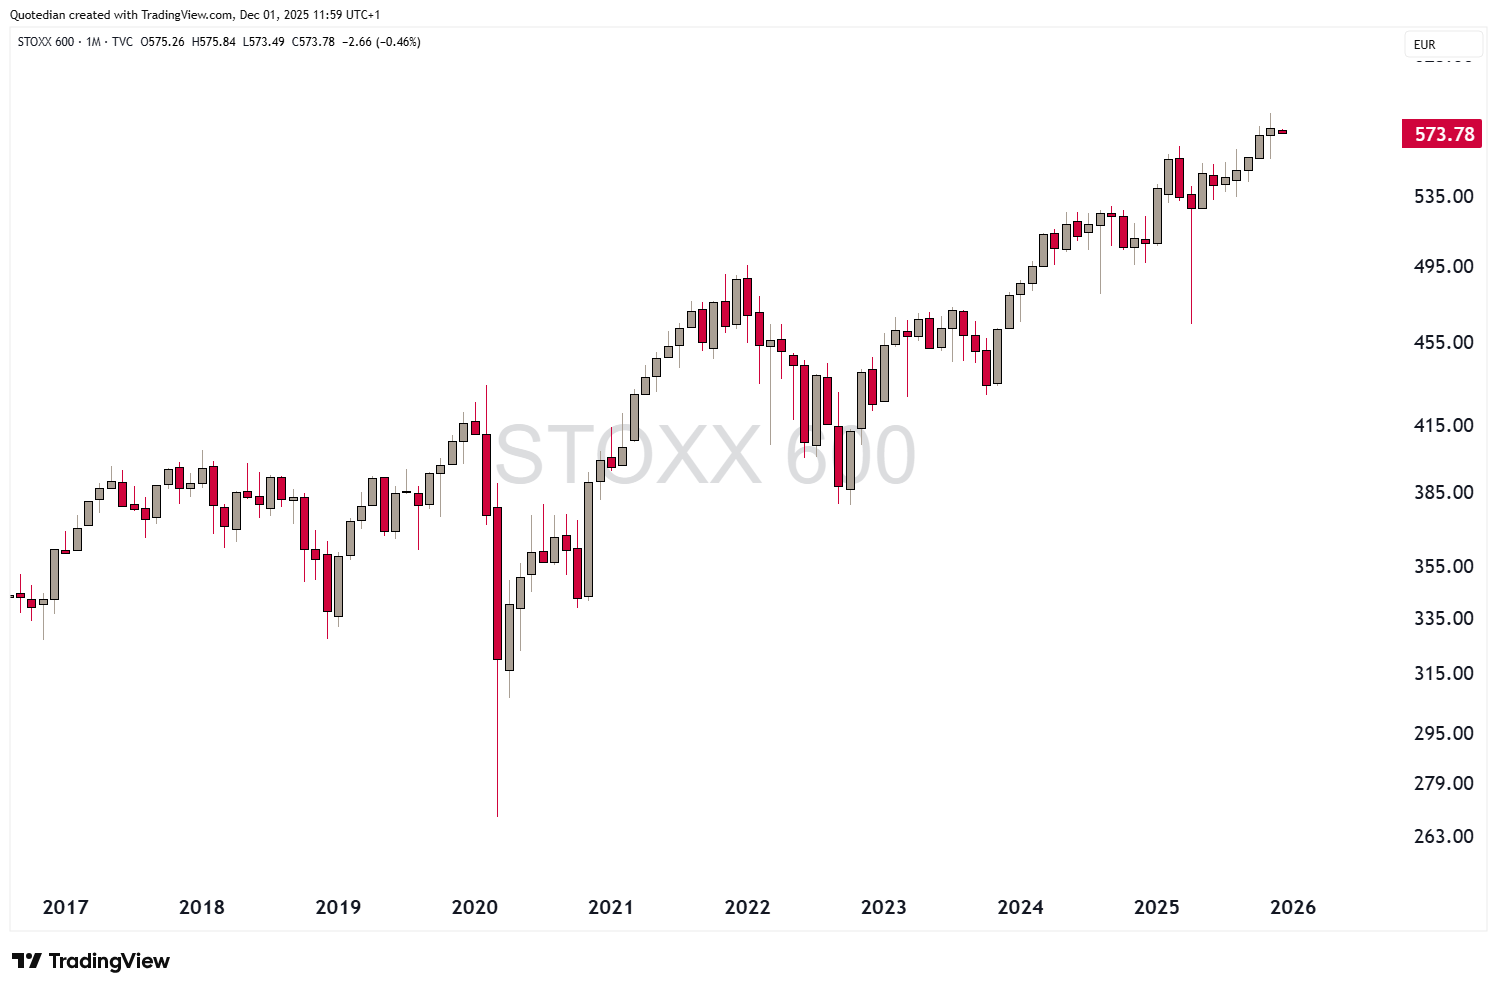
But the broader European markets (STOXX 600) has not been too shabby either, clocking in a new all-time high in November:
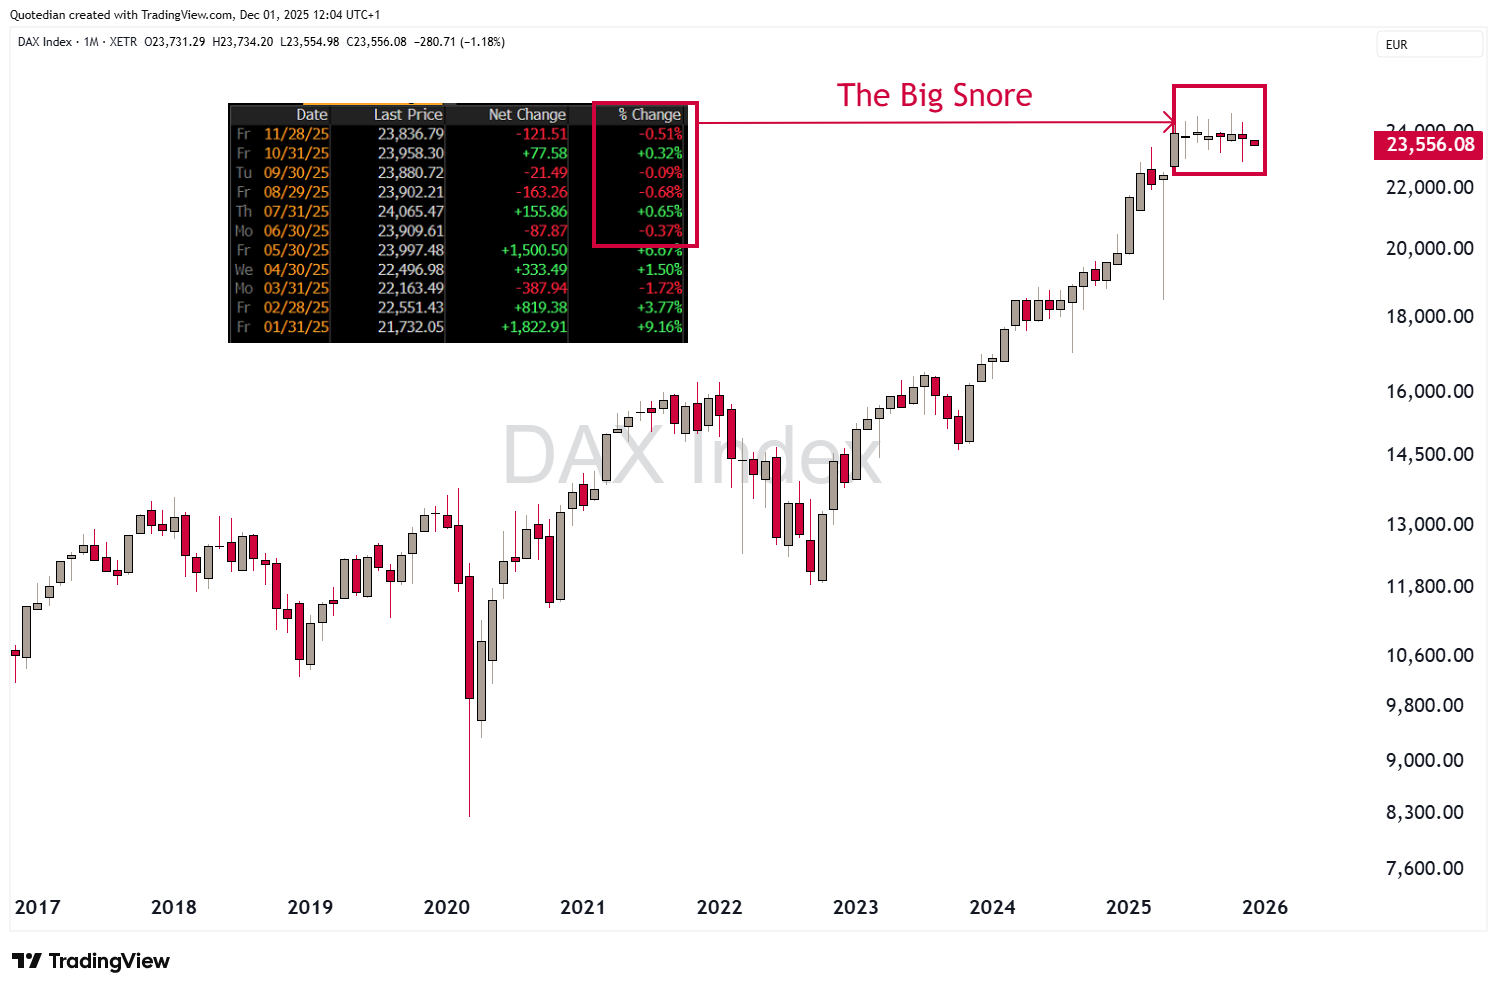
And this despite the DAX having been a non-contributer for seven consecutive months now:
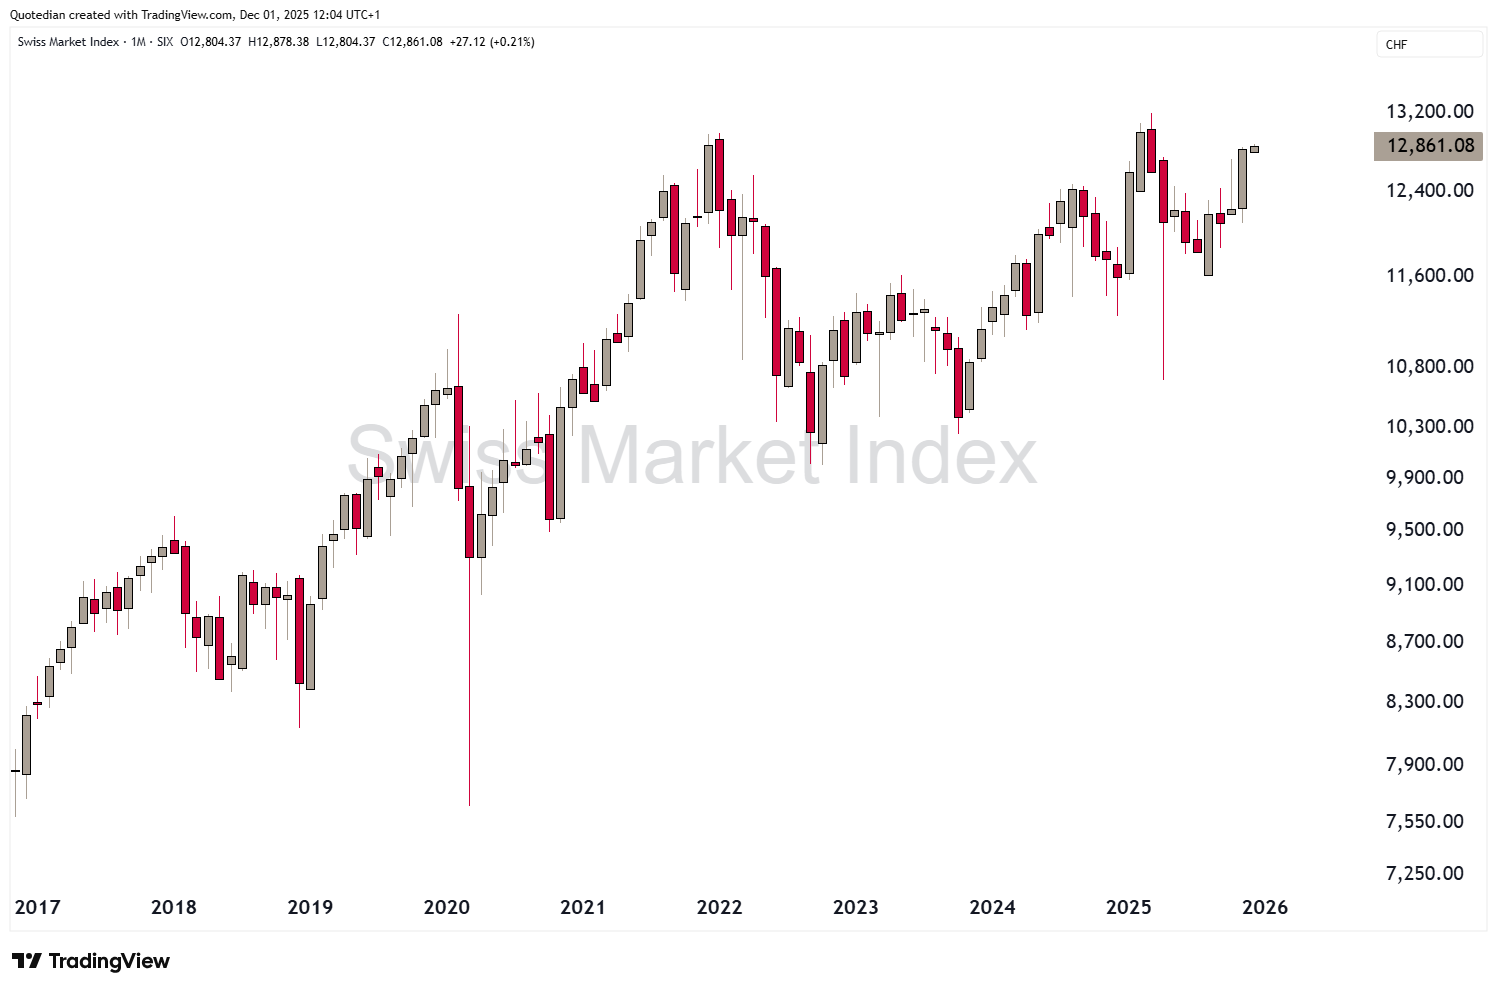
Switzerland’s SMI on the other hand is waking up from a massive, long, multi-month siesta:
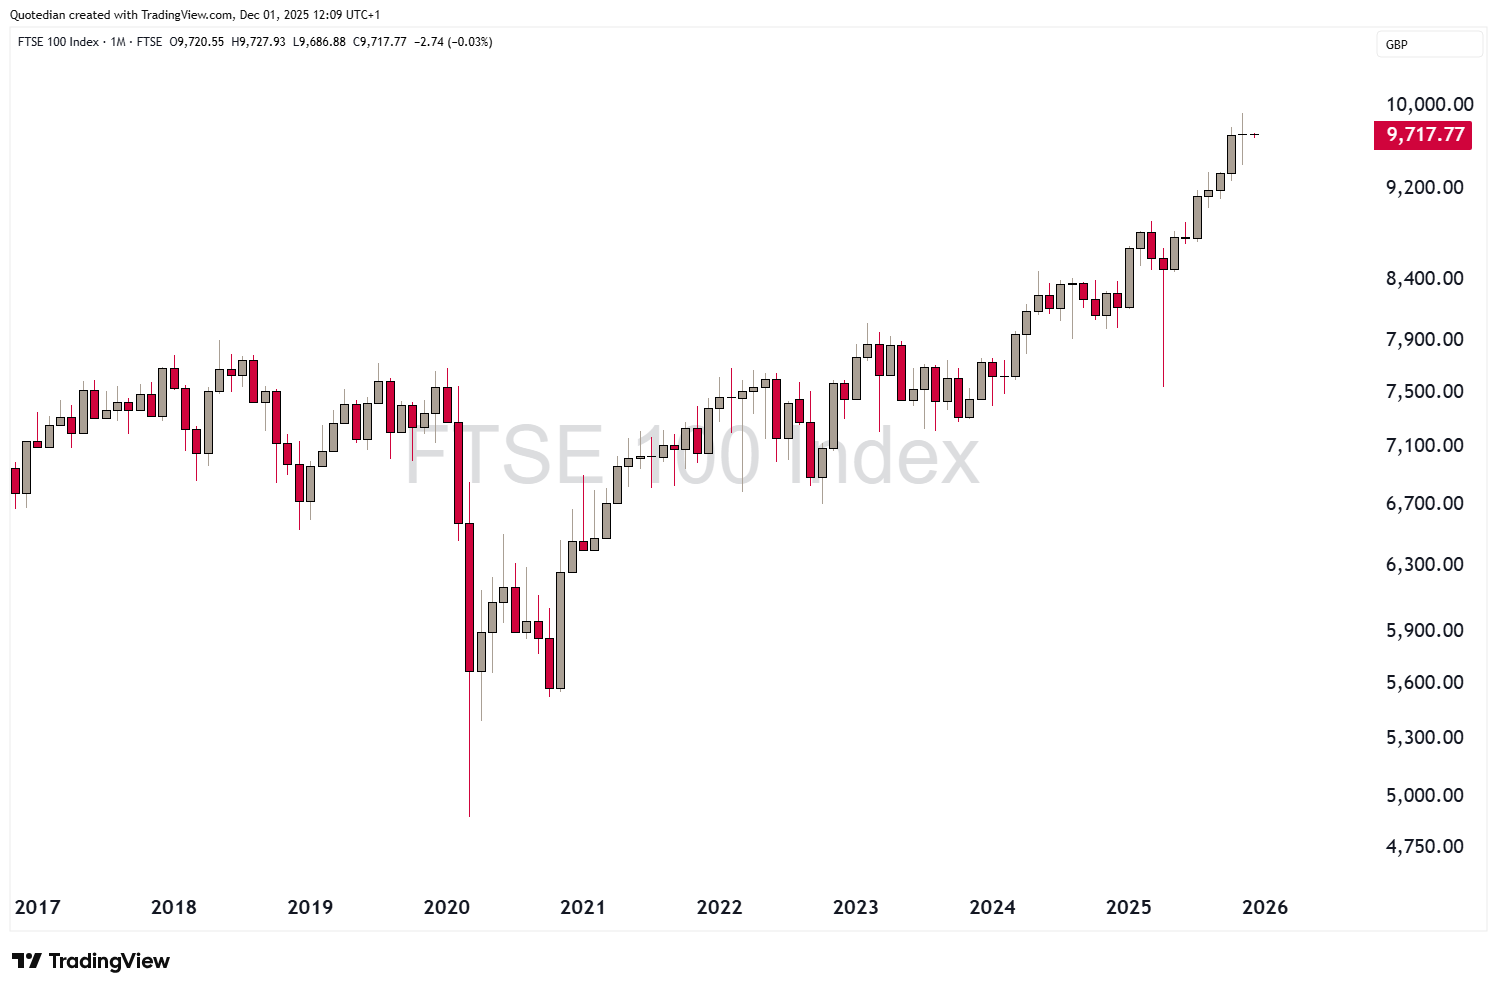
And finally, the Footsie-100 in the UK is less than three percent away from climbing its first 10K, and missed reaching that top by less than a percentage point in November:

In Asian markets, Japanese stocks were one of the worst performing regions, with the Nikkei down four percent on the month:

Given the preceding seven months, seventy percent rally from the April lows, I think investors can be forgiven for locking in some of their profits.
South Korean stocks, with the main KOSPI index, massively exposed to the AI-trade via chip-makers Samsung Electronics & SK Hynix, which together make up more than 30% of the index weight, suffered during the month’s thematic reversal:
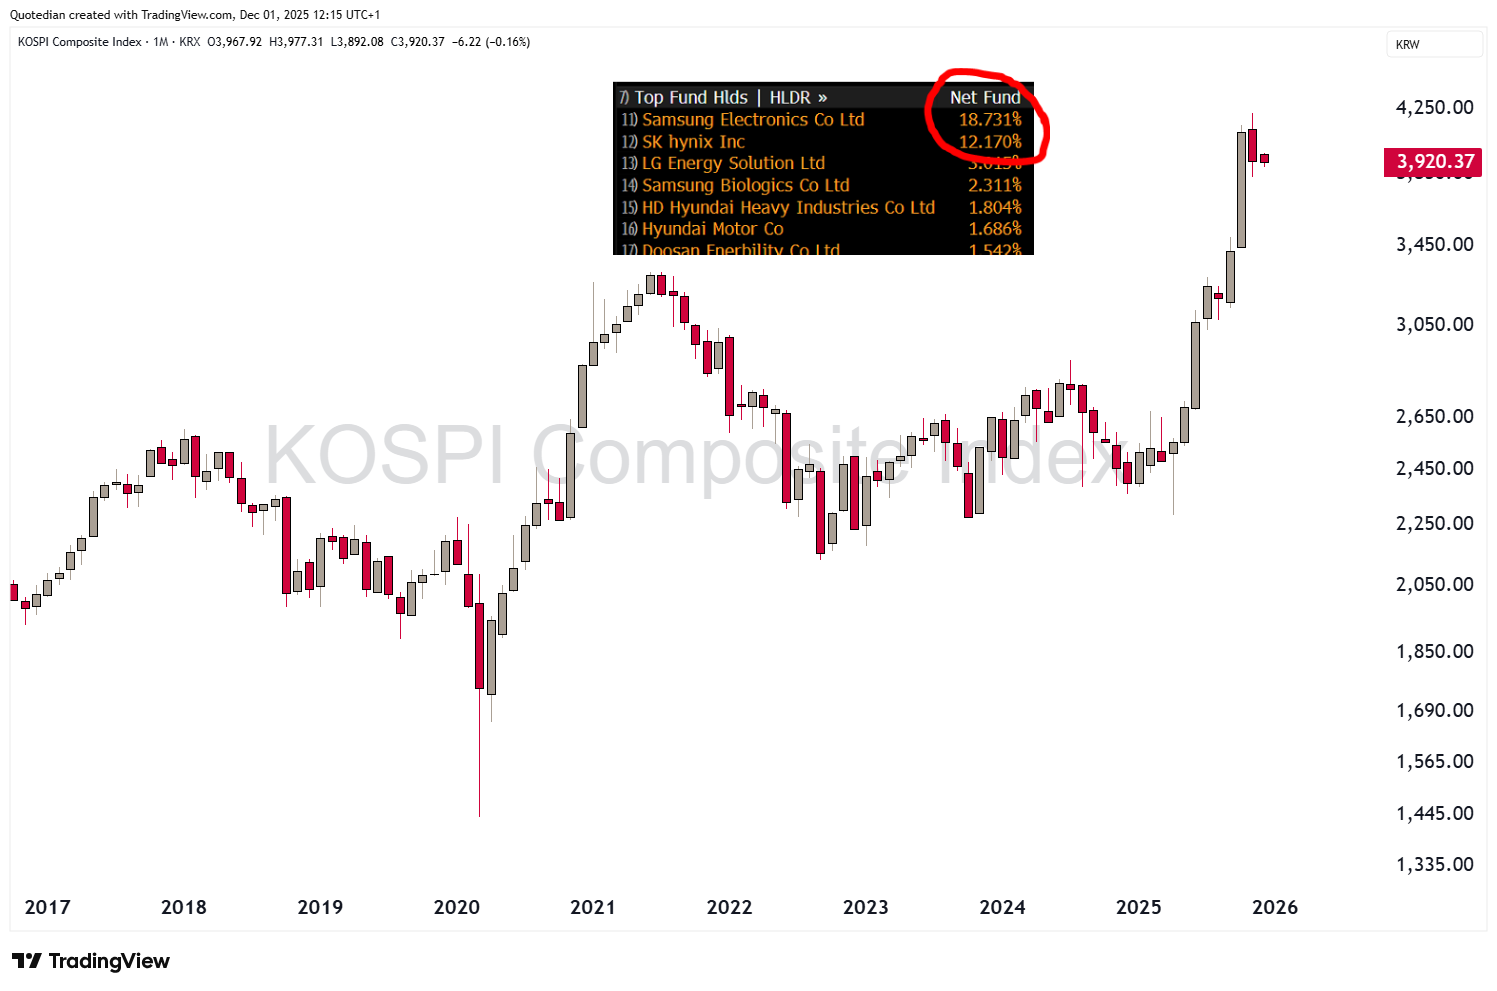
Keep in mind that this index too had advanced 80% during the previous seven months.
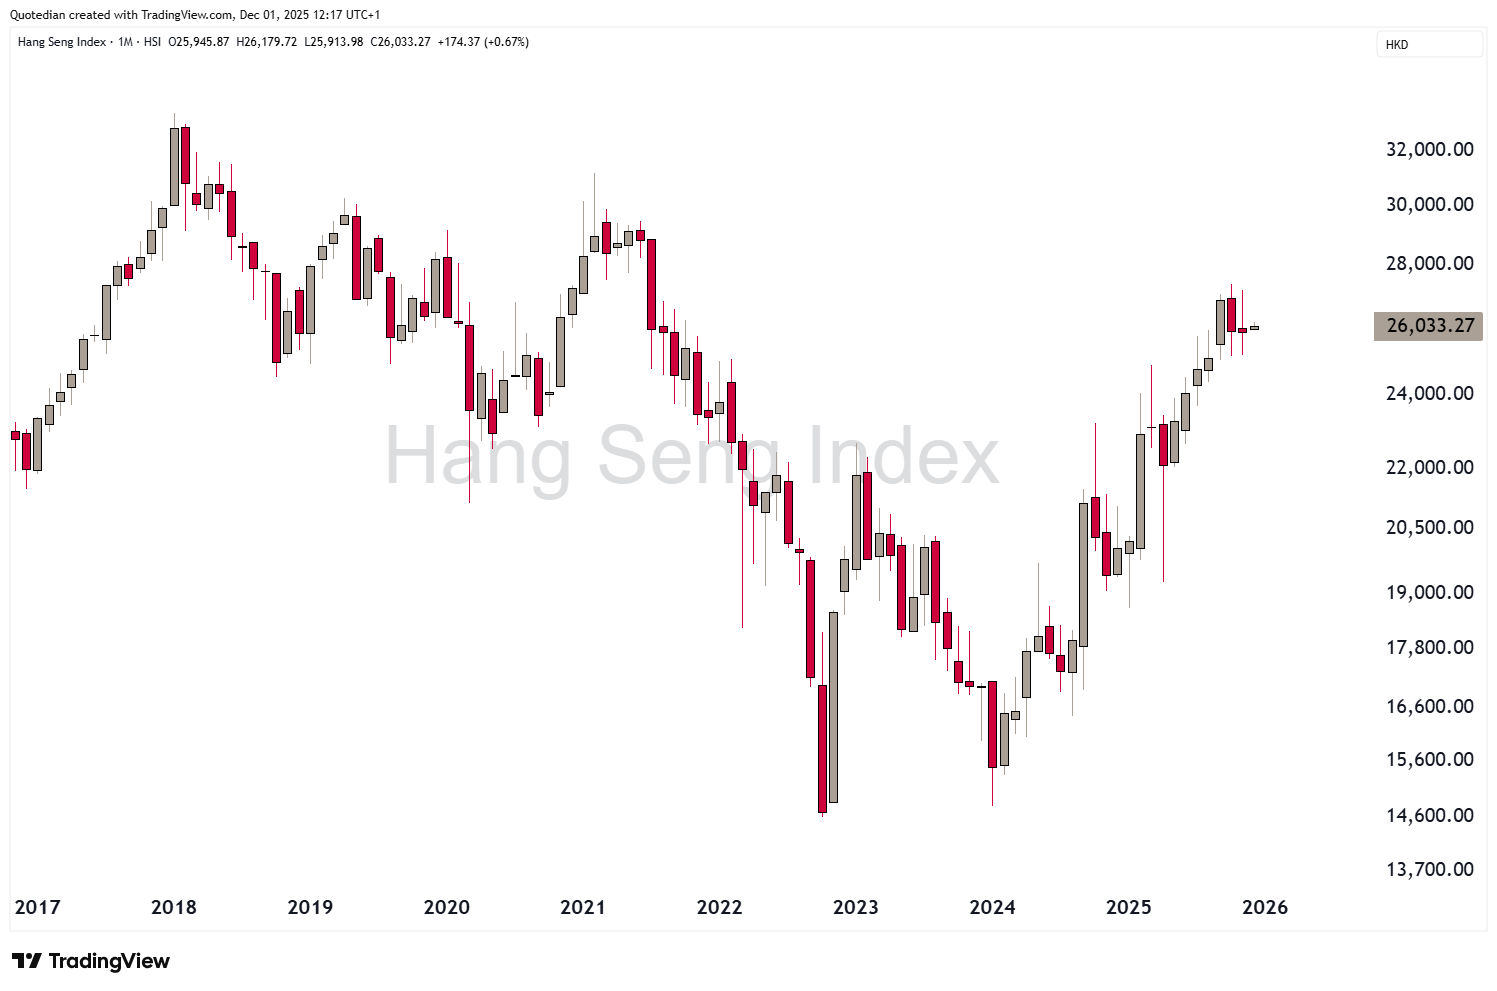
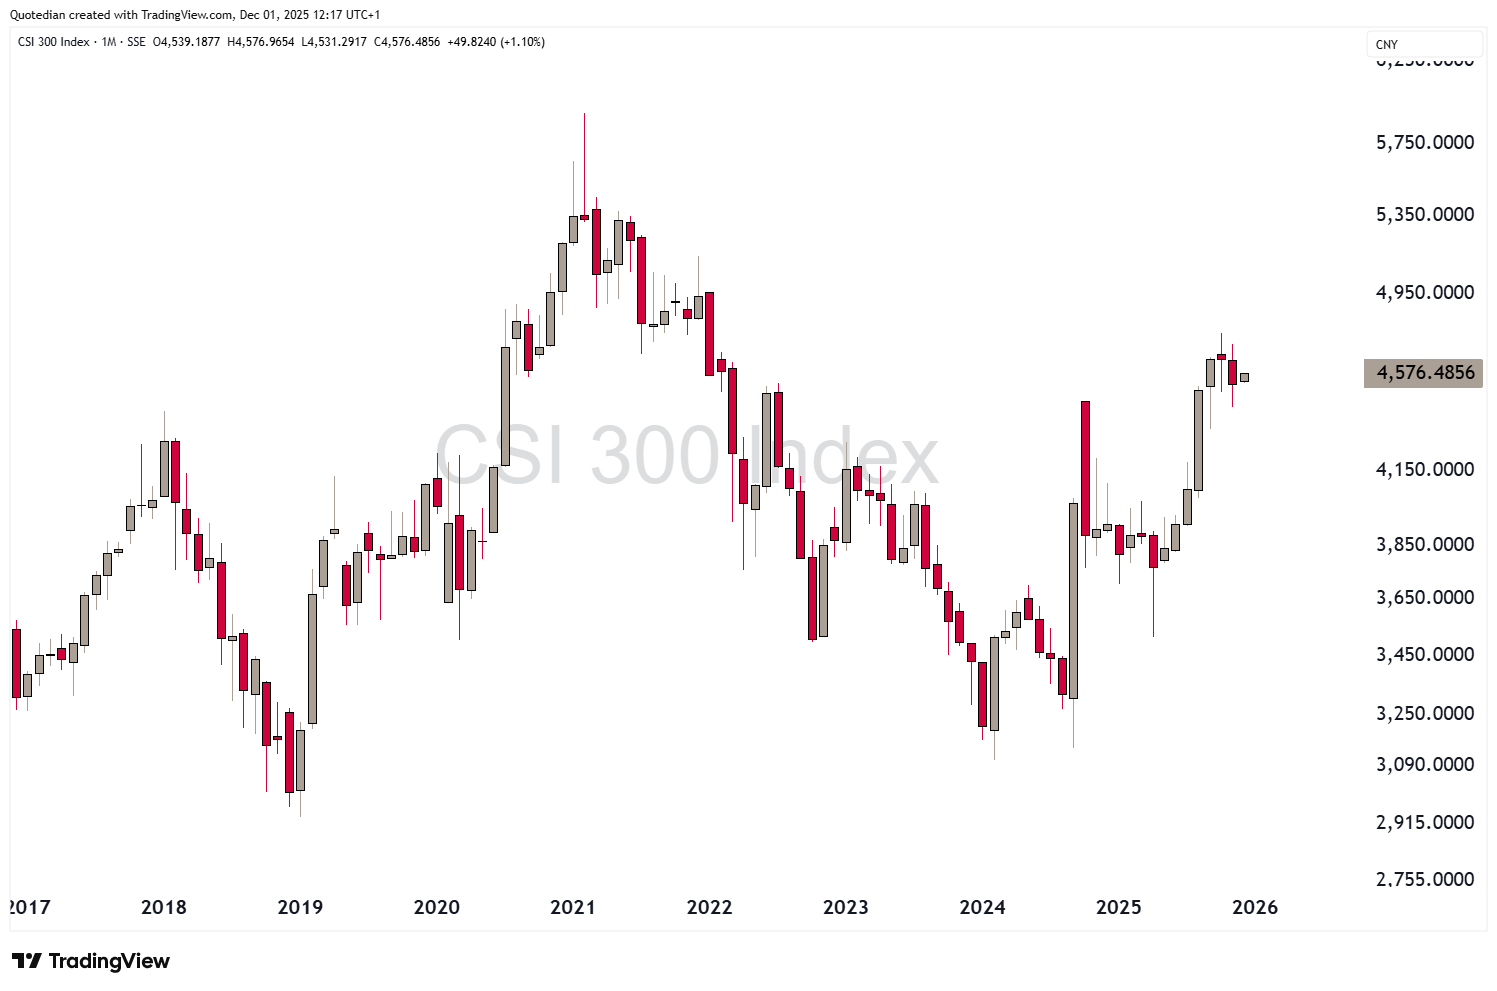
Chinese stocks have been consolidating sideways, as much in Hong Kong
as also on the Chinese Mainland:
Indian stocks (BSE500) are fighting their way back to new all-time highs after over a year of non-performance
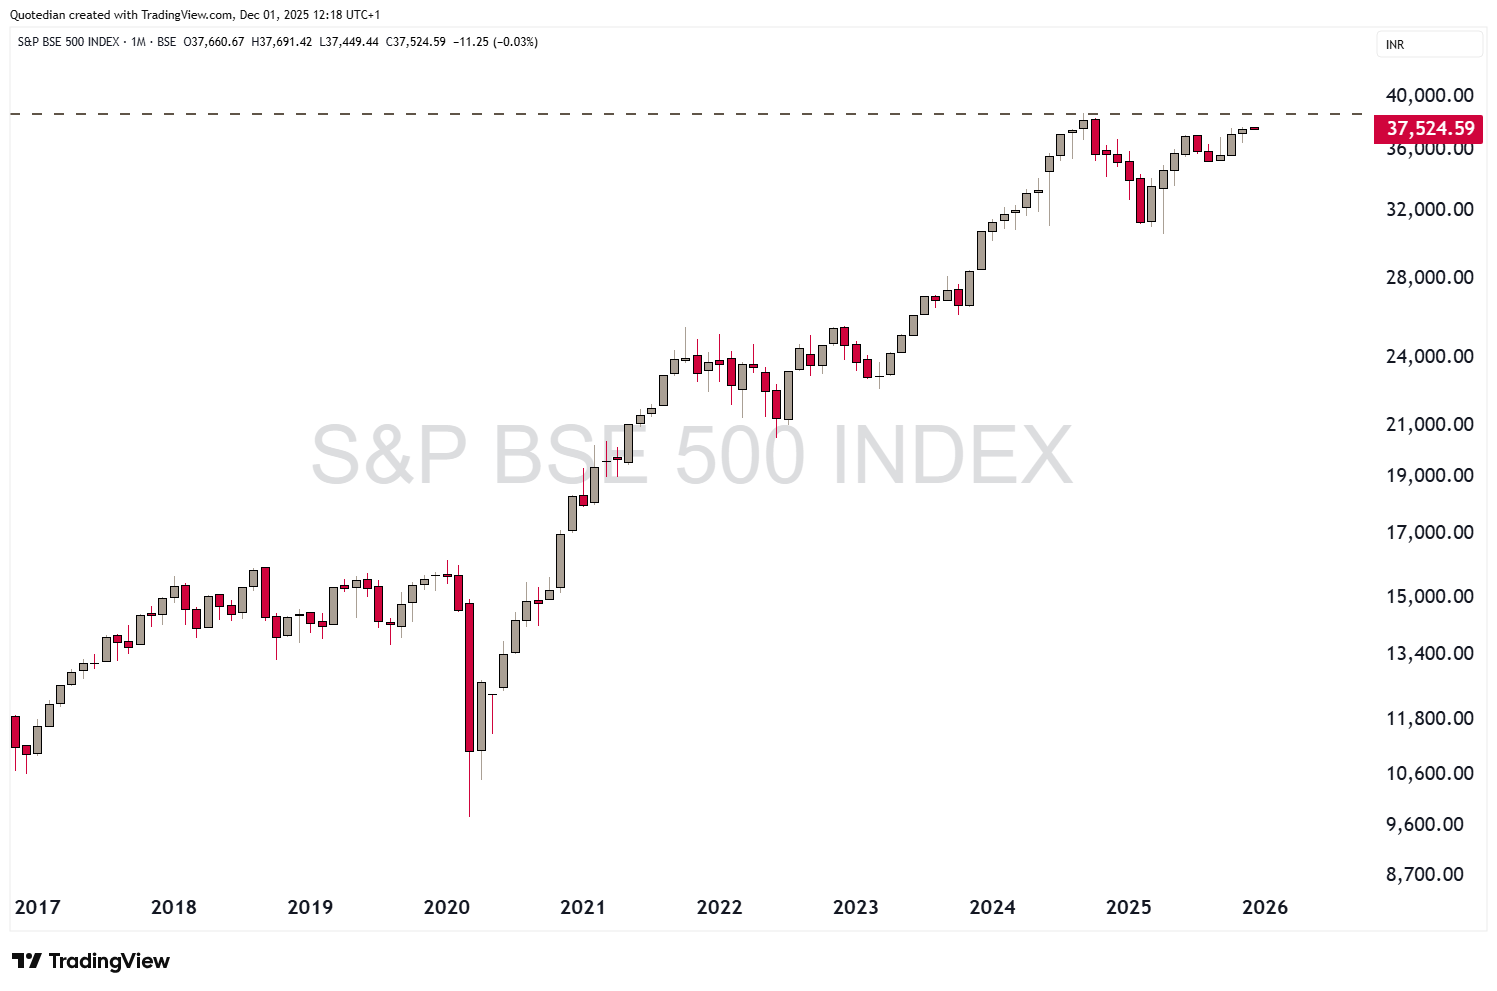
and relative underperformance:
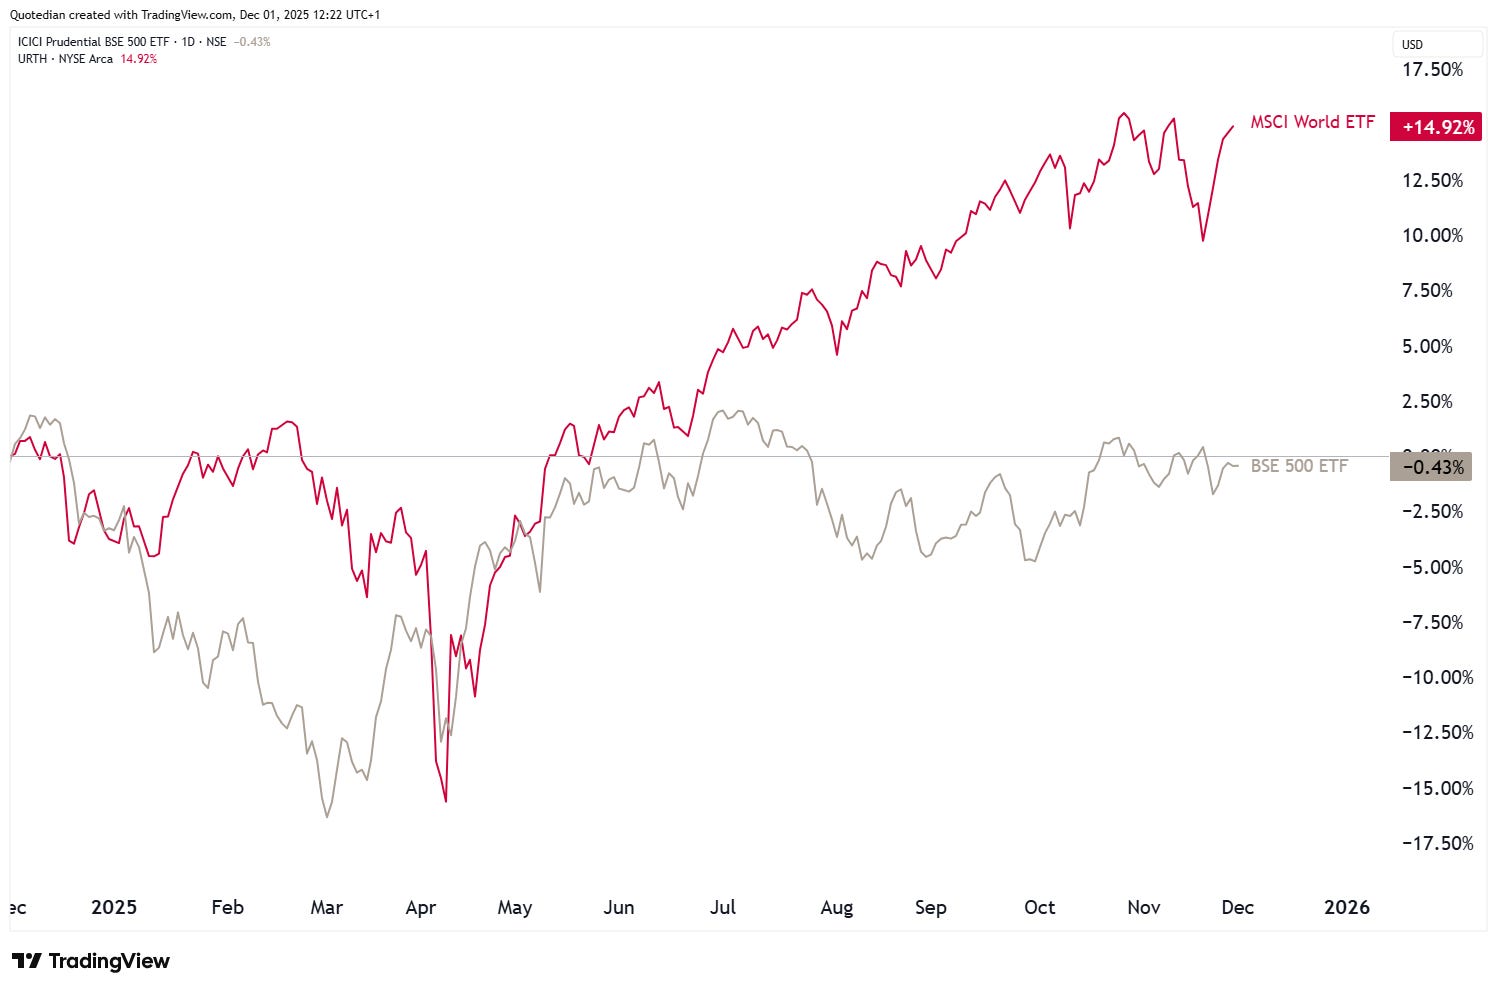
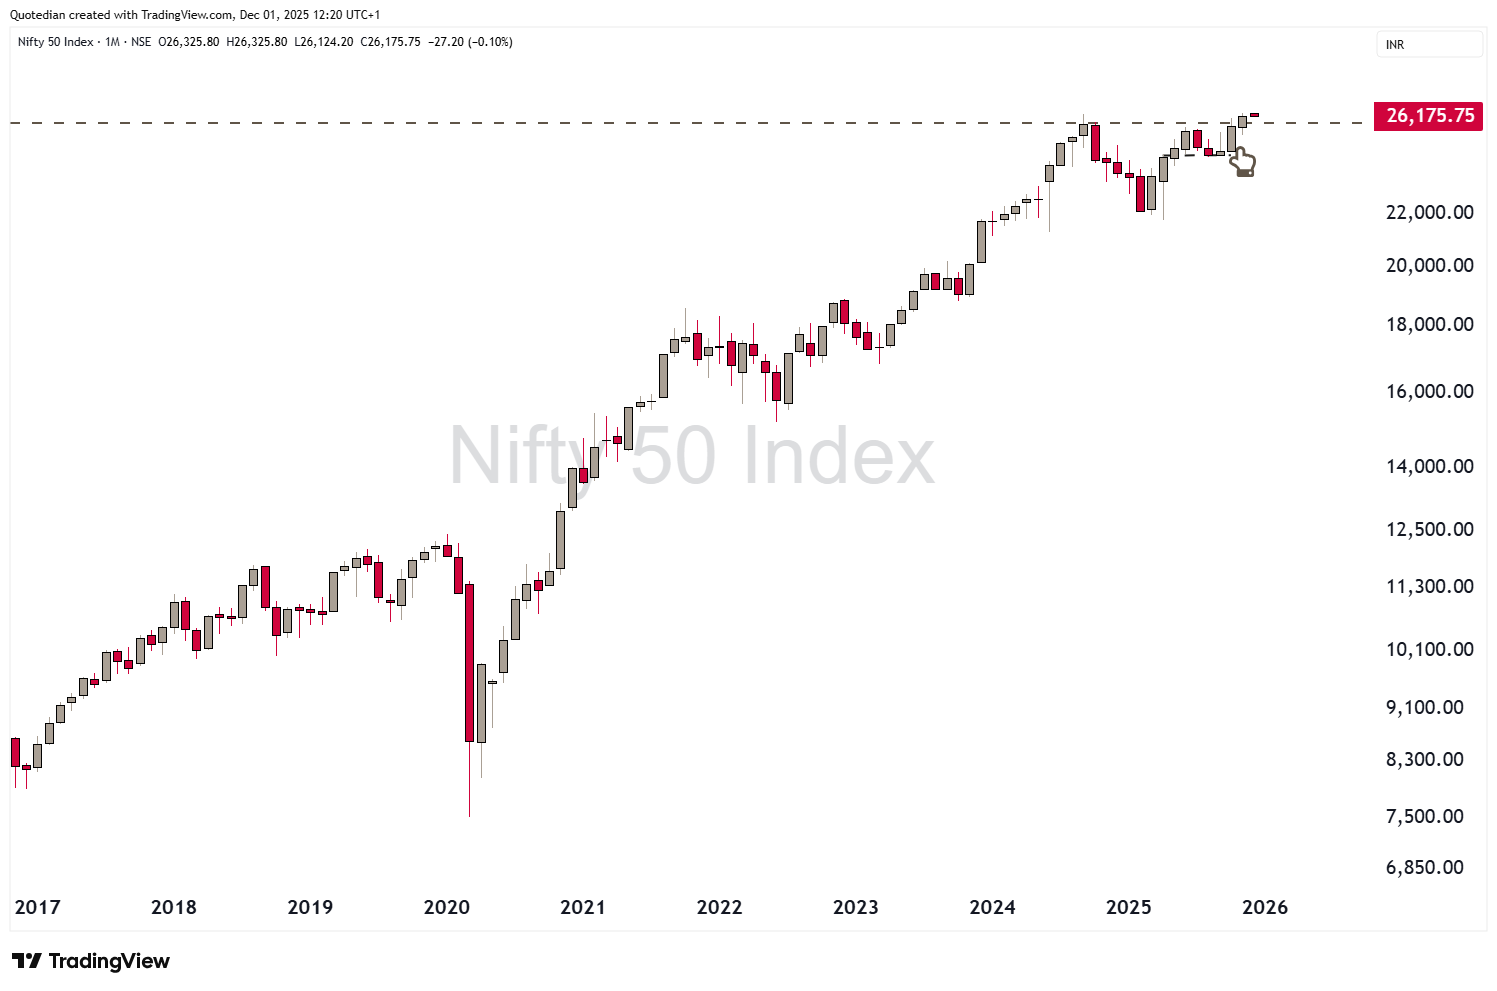
However, no doubt this index will reach that new ATH achievement in due course, as the narrow Nifty 50 index has already breached that mark in November:
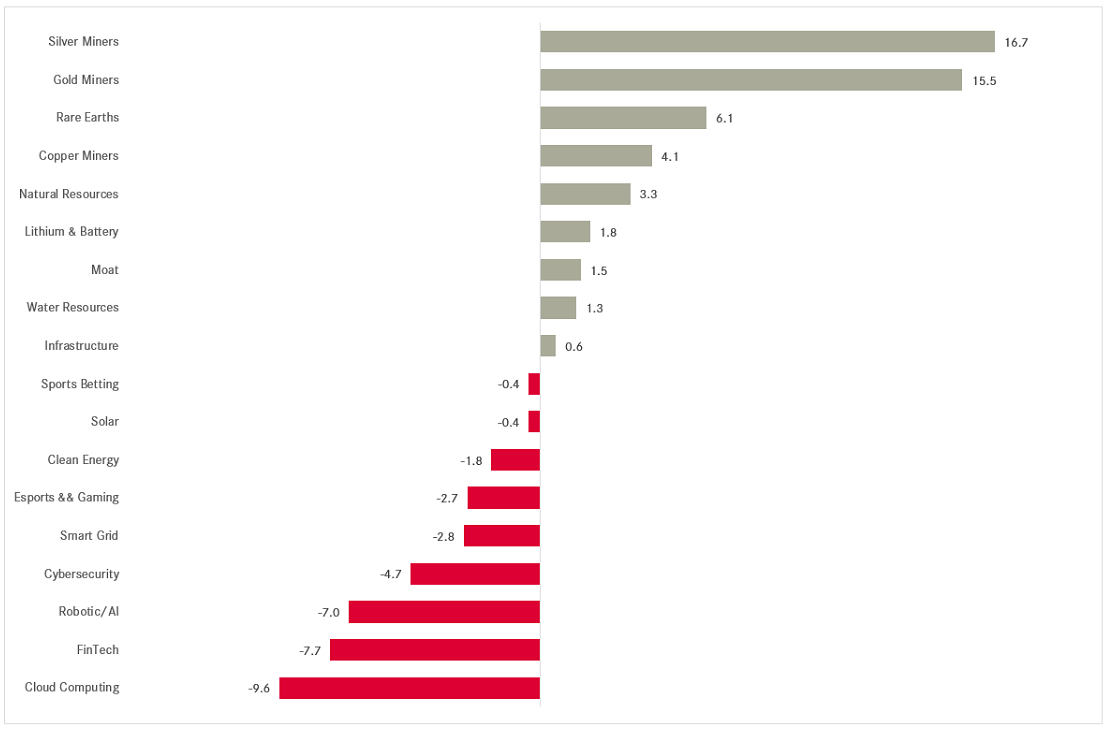
Now, it’s time to look at sector performance for November on a global level:
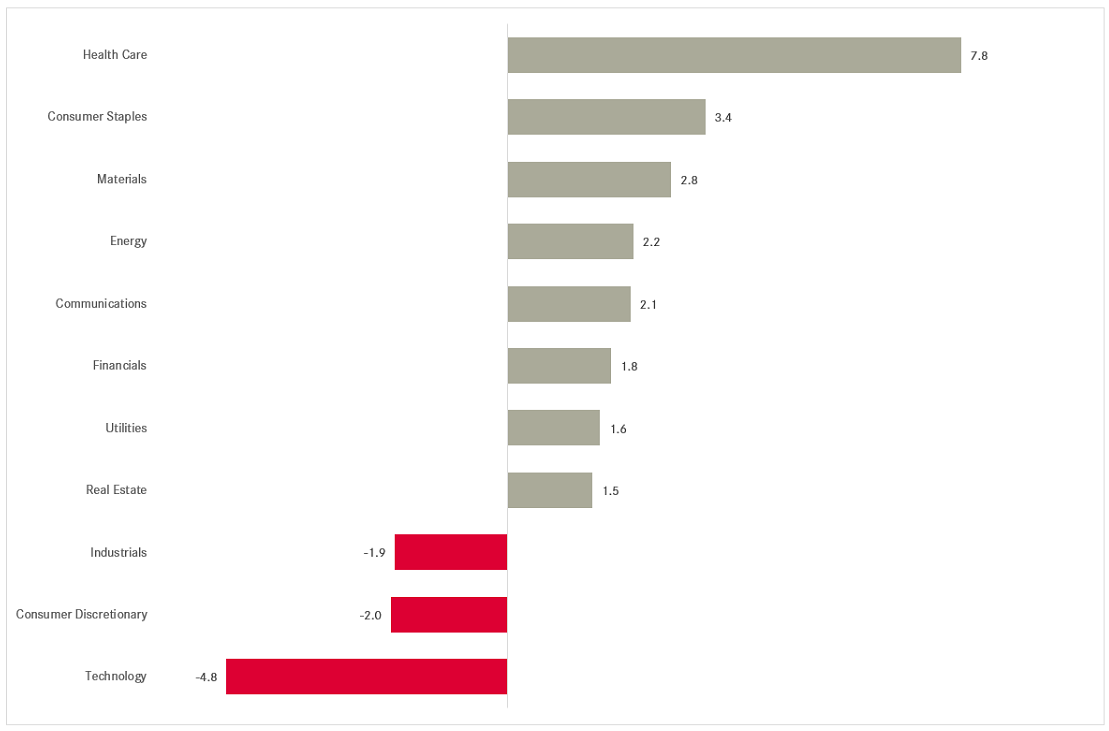
Quite the comeback for health care stocks here, and we have a closer look at a moment. But first, we need to pay attention to a possible rotation happening in markets. More defensive (health care, consumer staples) and late cycle (energy) stocks have started to outperform, whilst previous leaders (tech, consumer discretionary) are now laggards.
This rotation has been more obvious in the US,
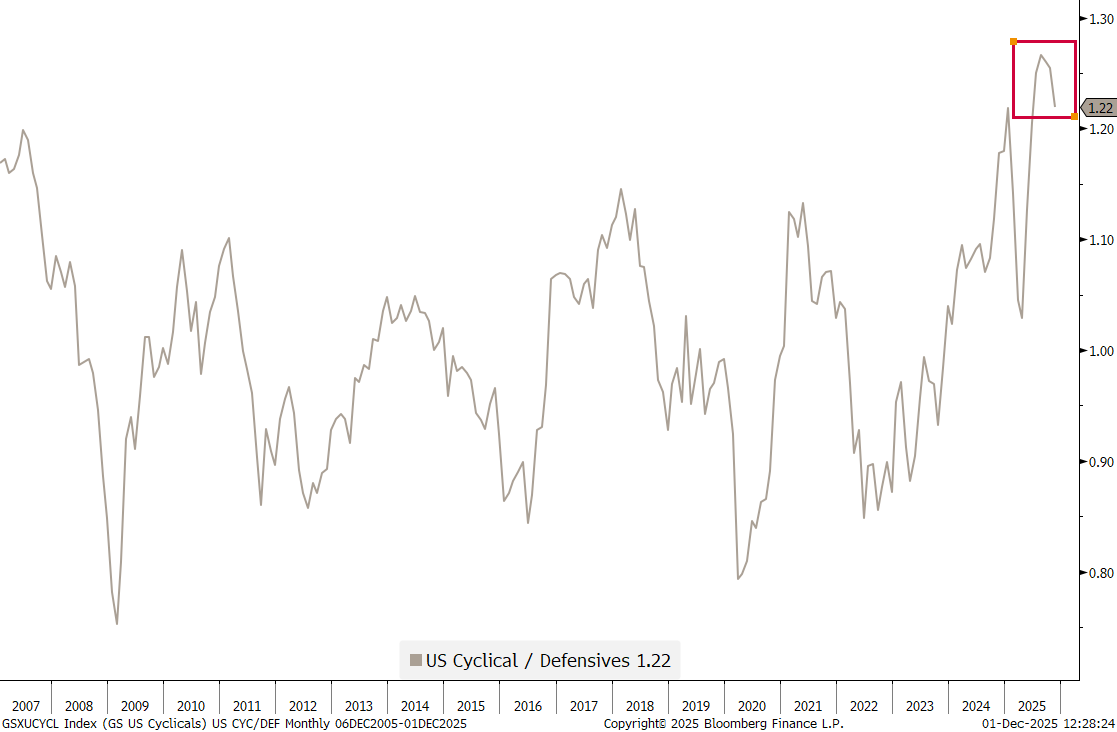
than in Europe:
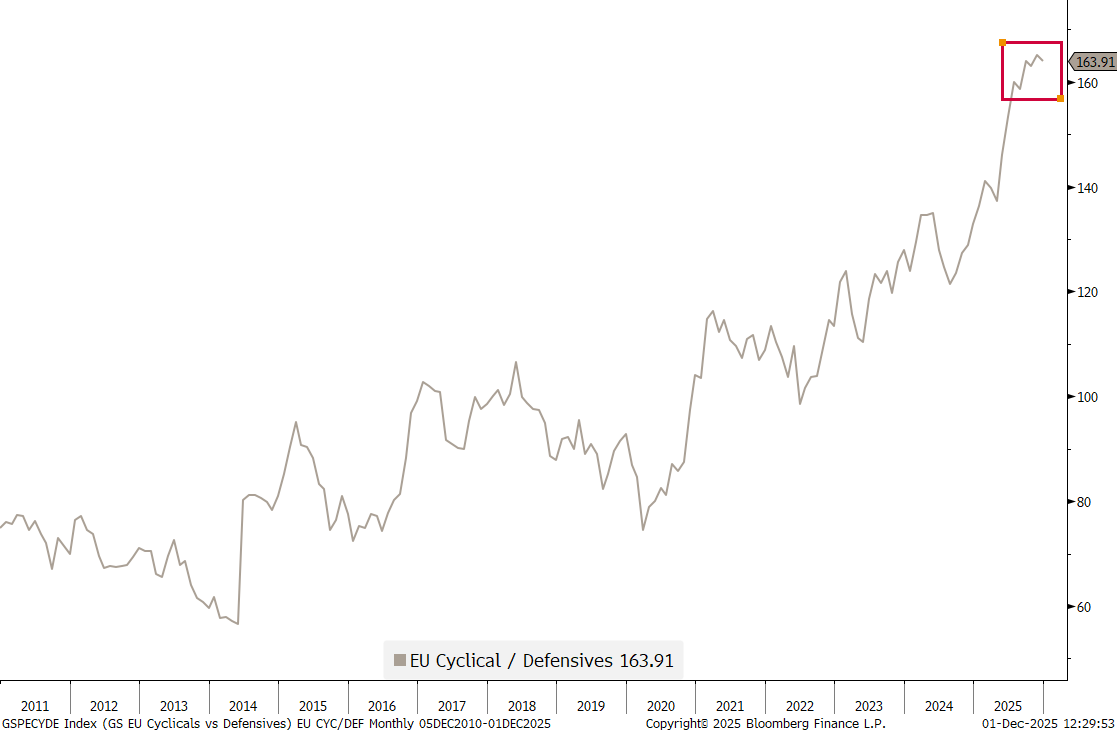
One month does not change a trend, but as I said, keep a close eye on this.

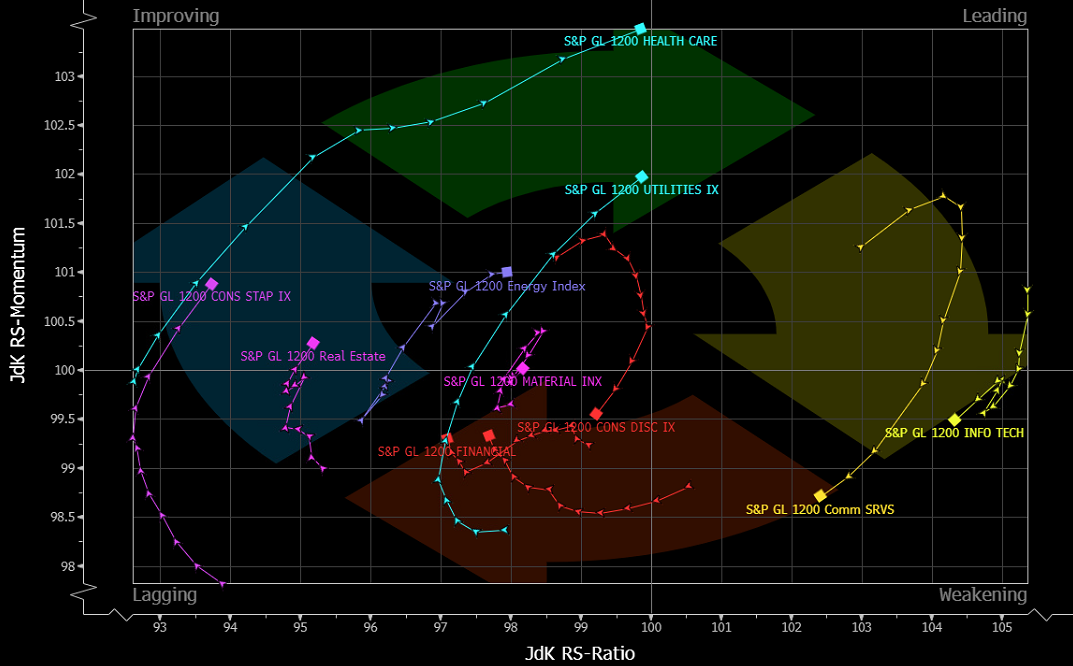
Here’s one way to visualize this cycle shift:
Now, a performance table for special themes and sectors of interest:
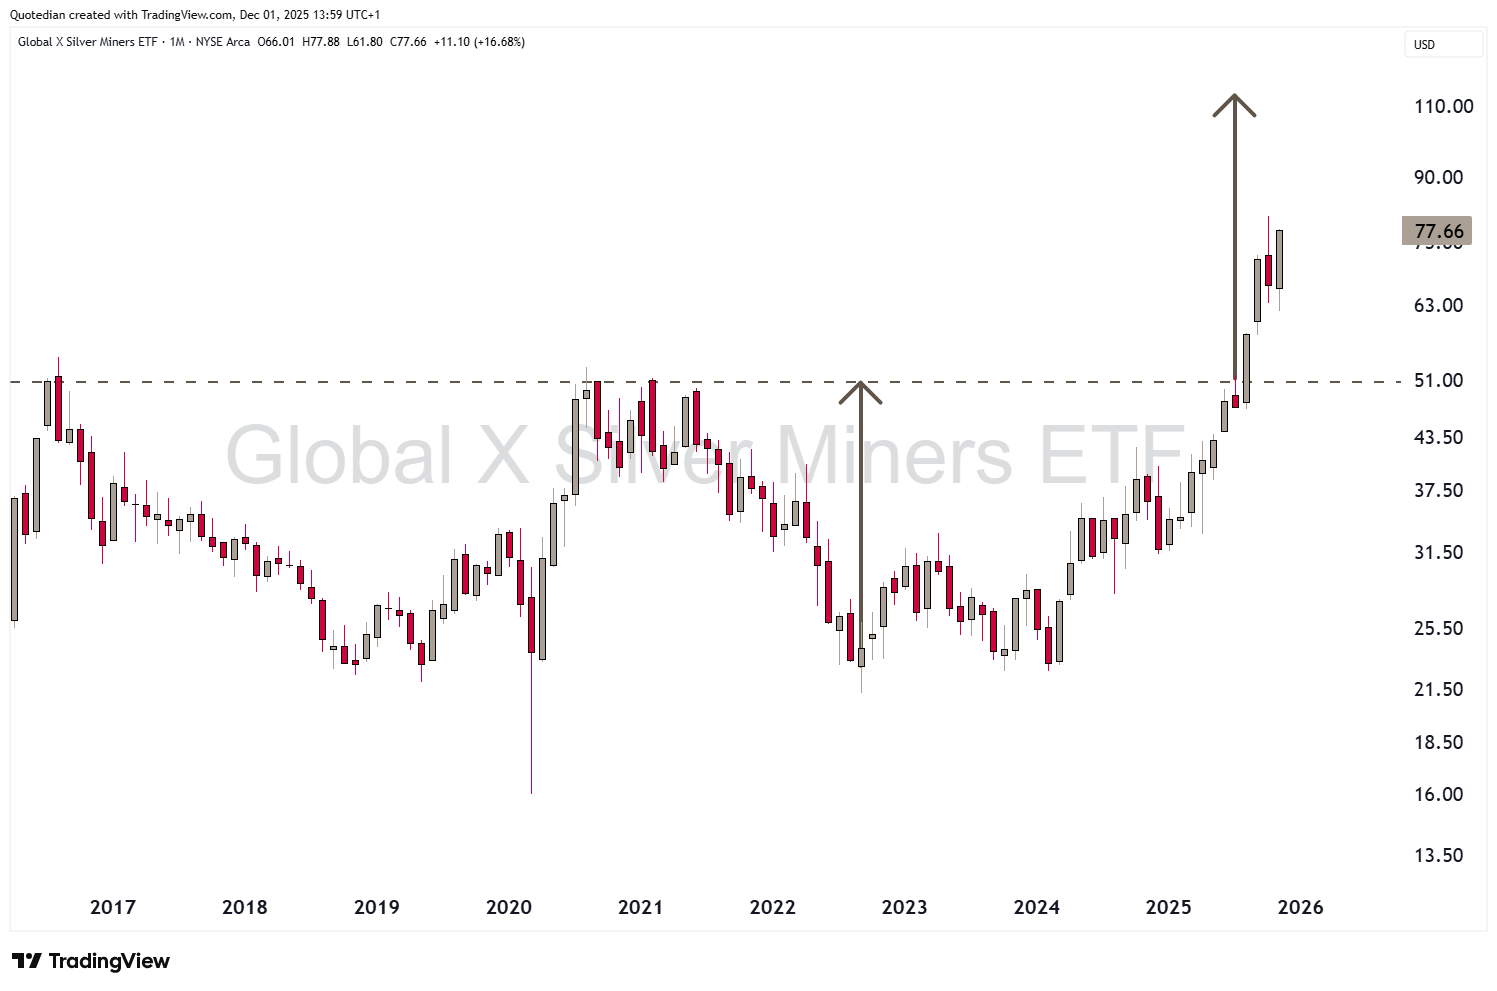
Remember that Quotedian called “Silver Lining” (click here) a few weeks ago? Plenty of upside ahead for precious metals and their miners according to the writer of that piece …
For Silver miners, one of the more conservative ‘further upside’ measurements would suggest at least 50% more:
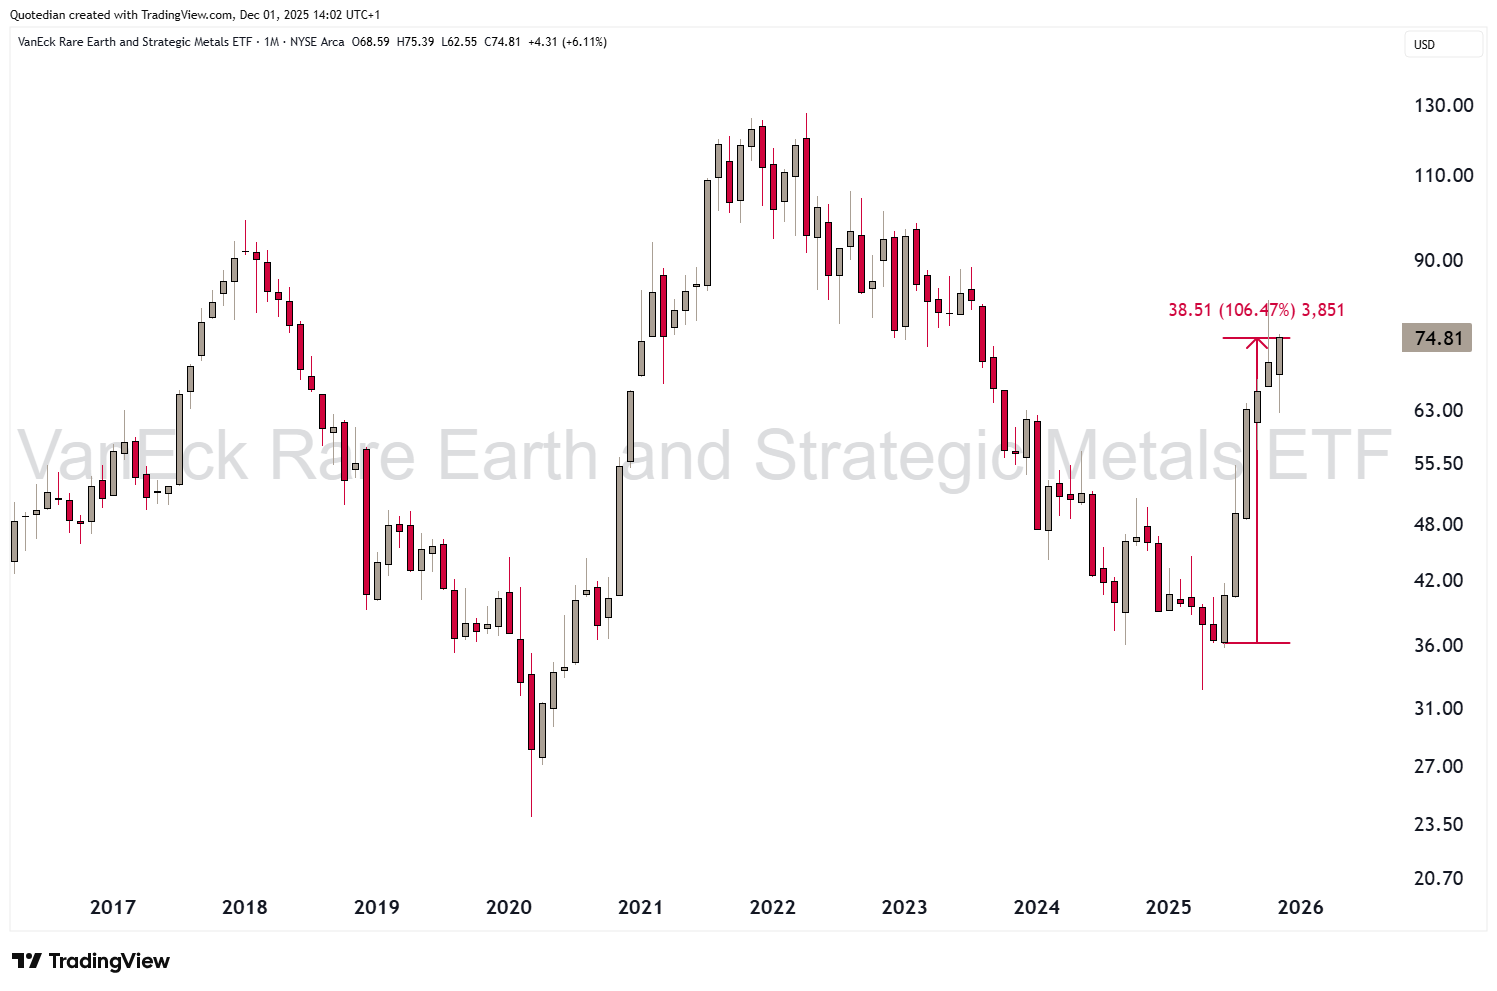
Rare earth stocks have doubled since June when proxied via the VAnEck Rare Earth and Strategic Metals ETF:
And if you like the theme, why not invest along with the US Government, which holds a stake in MP Materials now amongst others:
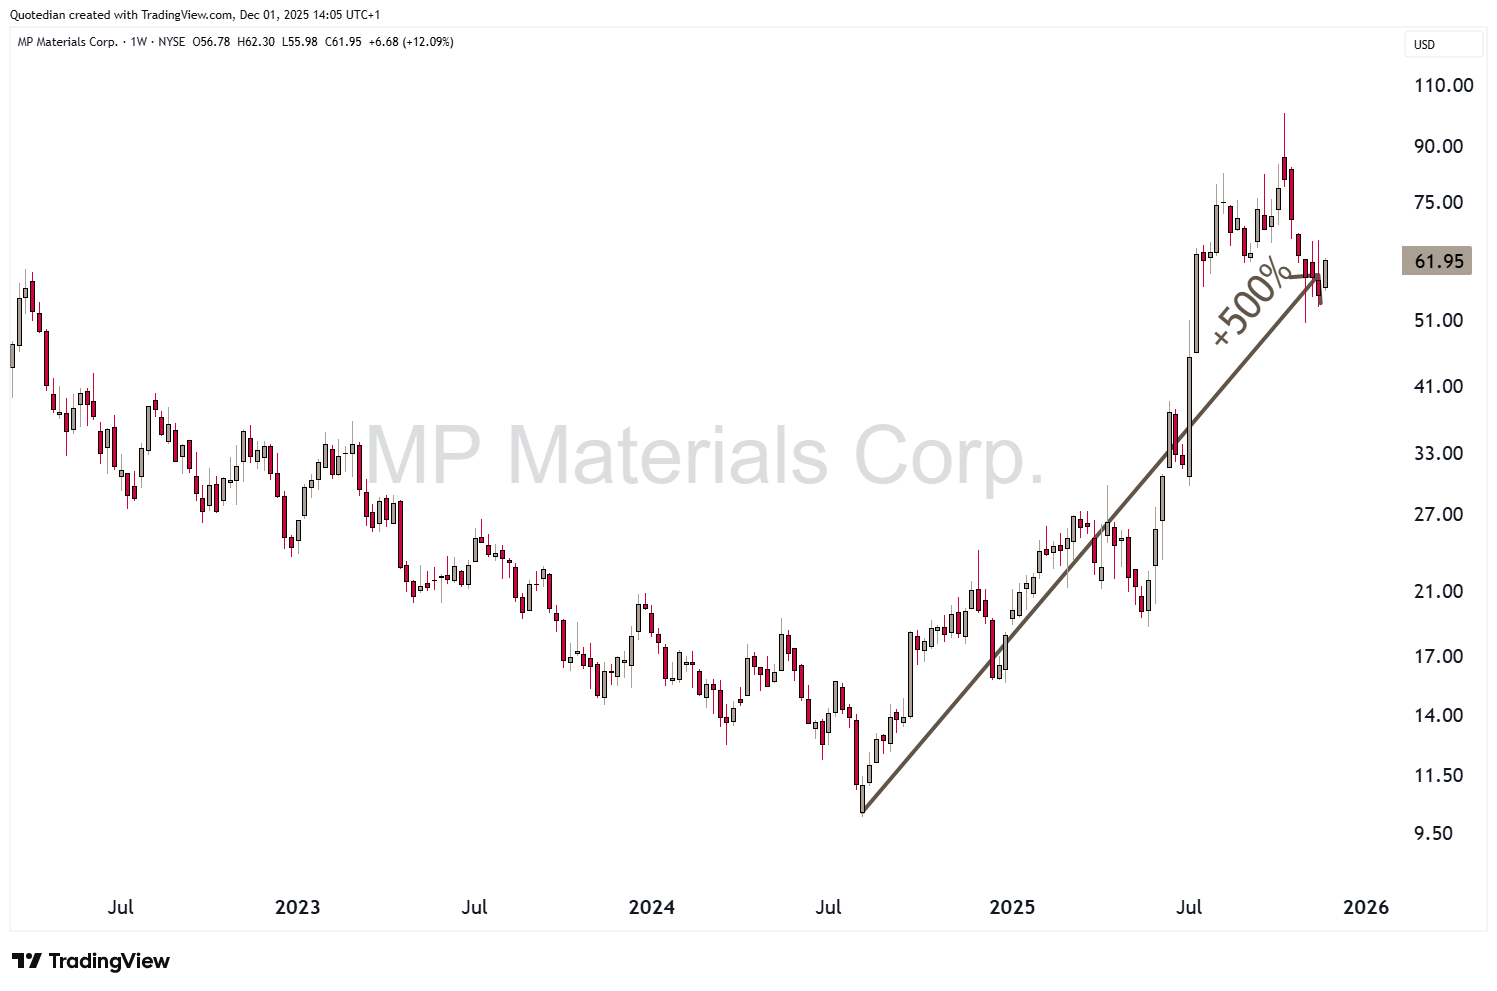
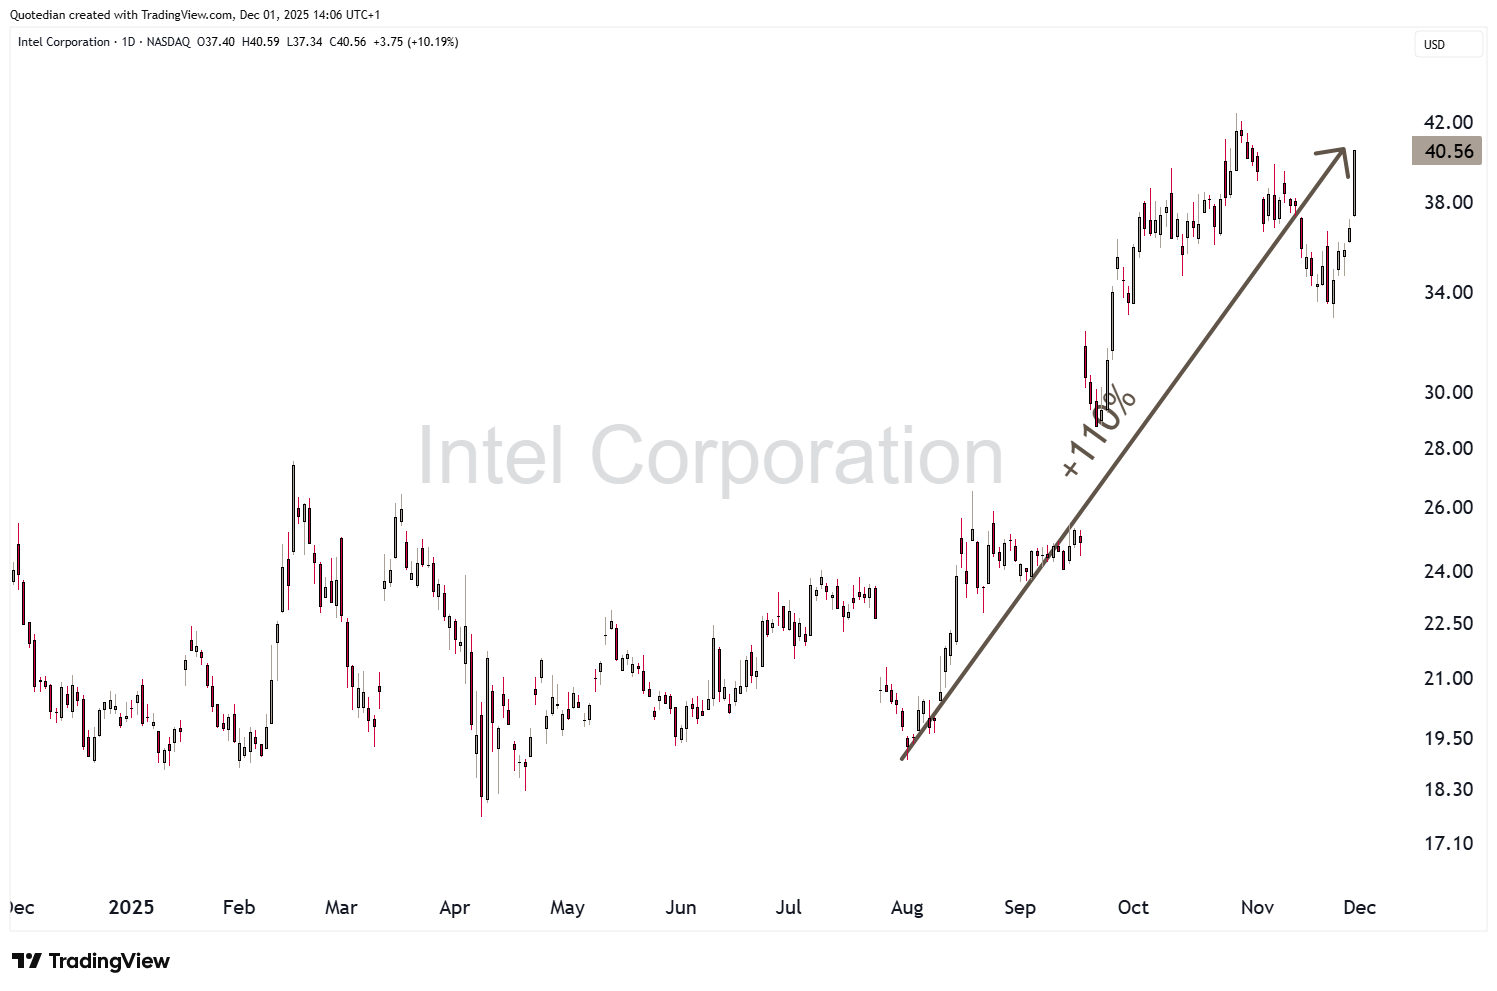
After all, it also worked, and is still working, to co-invest with the US administration in the case of Intel:
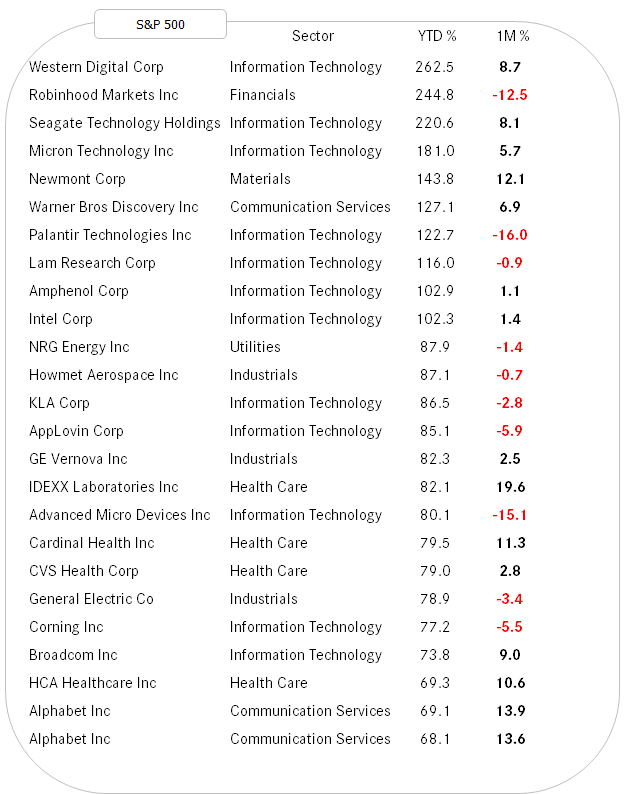
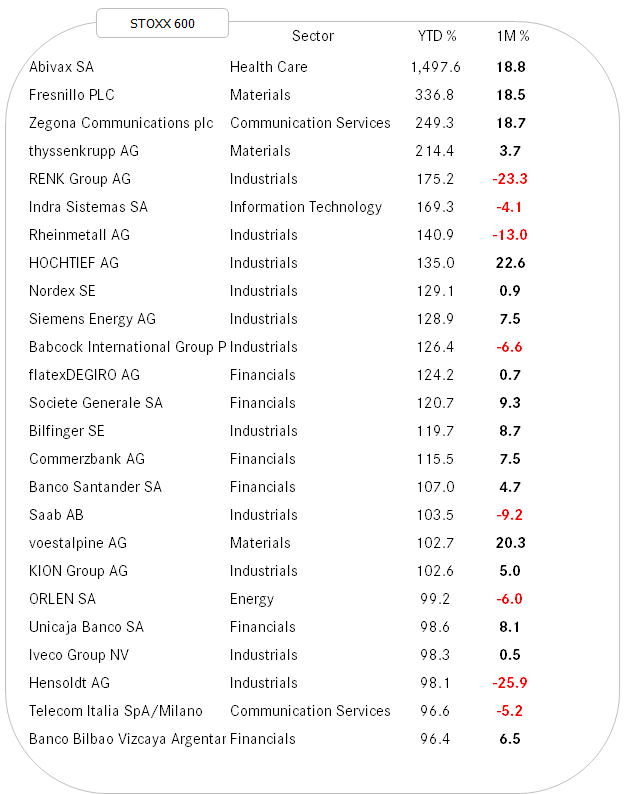
And as we are talking individual stocks now, let’s look at at our tables of the best performing stocks on a year-to-date basis in the US (S&P 500) and in Europe (STOXX 600) and how they have done over the past month.
Starting with the US, we detect a mixture of mean reversions (e.g. HOOD, AMD, PLTR) and trend continuation (WDC, NEM, IDXX)
In Europe, November was much more about trend continuation, though the defense sector saw some profit taking as the sabre rattling regarding an Ukraine peace deal (I know, kind of an oxymoron) started getting louder:
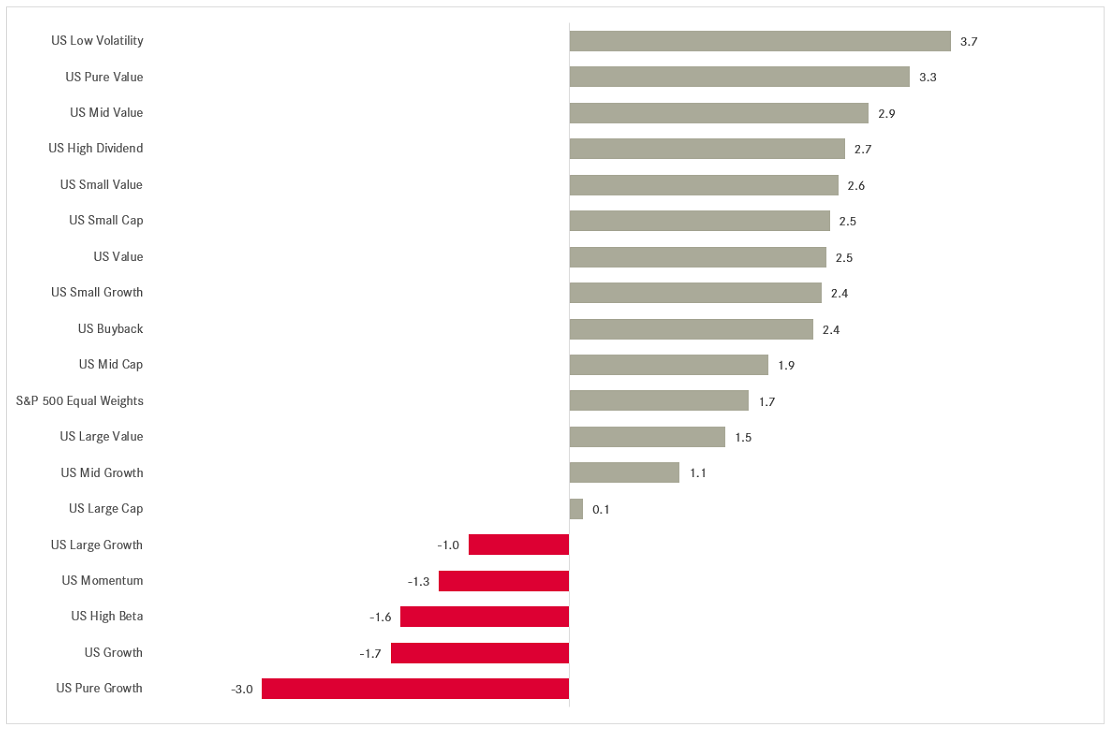
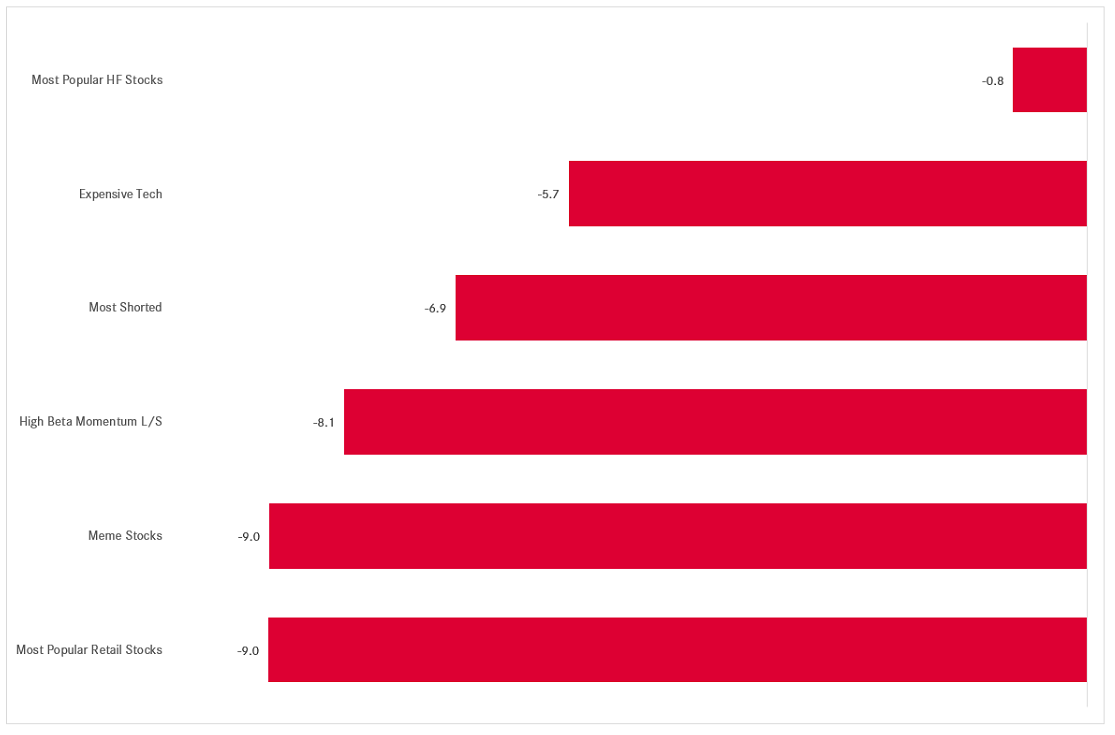
Finally, here’s (US) factor performance in November:
And here is the monthly performance of some “special” factors to finish of the equity section:

A quick glance and the fixed-income table reveals that overall November was, if not a great, at least a decently good month for bonds:
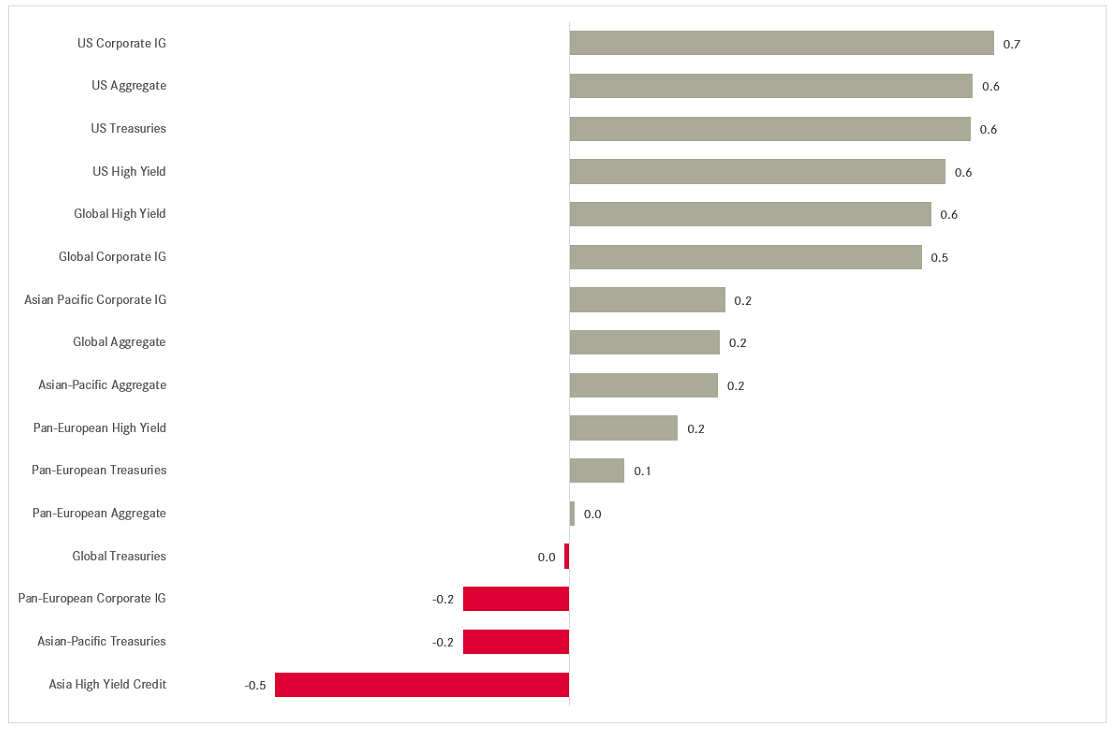
Let’s take a slightly different approach this month to look at the two most important bond market factors: interest rate risk and credit risk. Instead of looking at yield and credit spread charts, let’s have a look at some of the most popular bond ETFs.
Hence, to consider interest rate risk, we have a glance at the monthly chart of the iShares 20+ Year Treasury Bond ETF, to realize that yields have must not moved a lot in November:
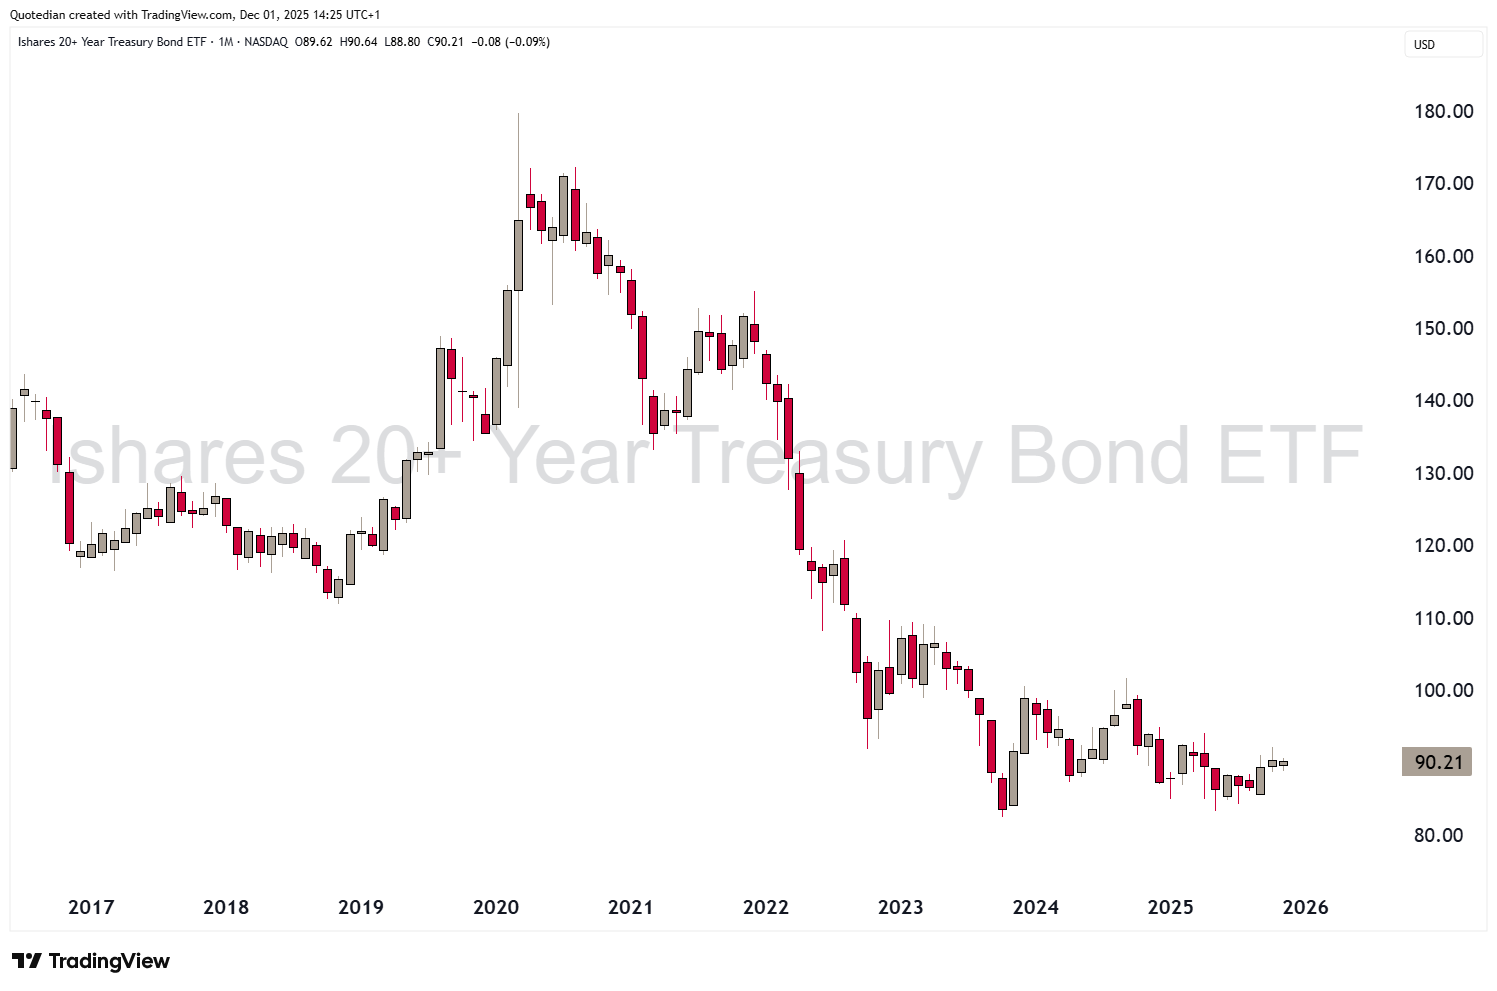
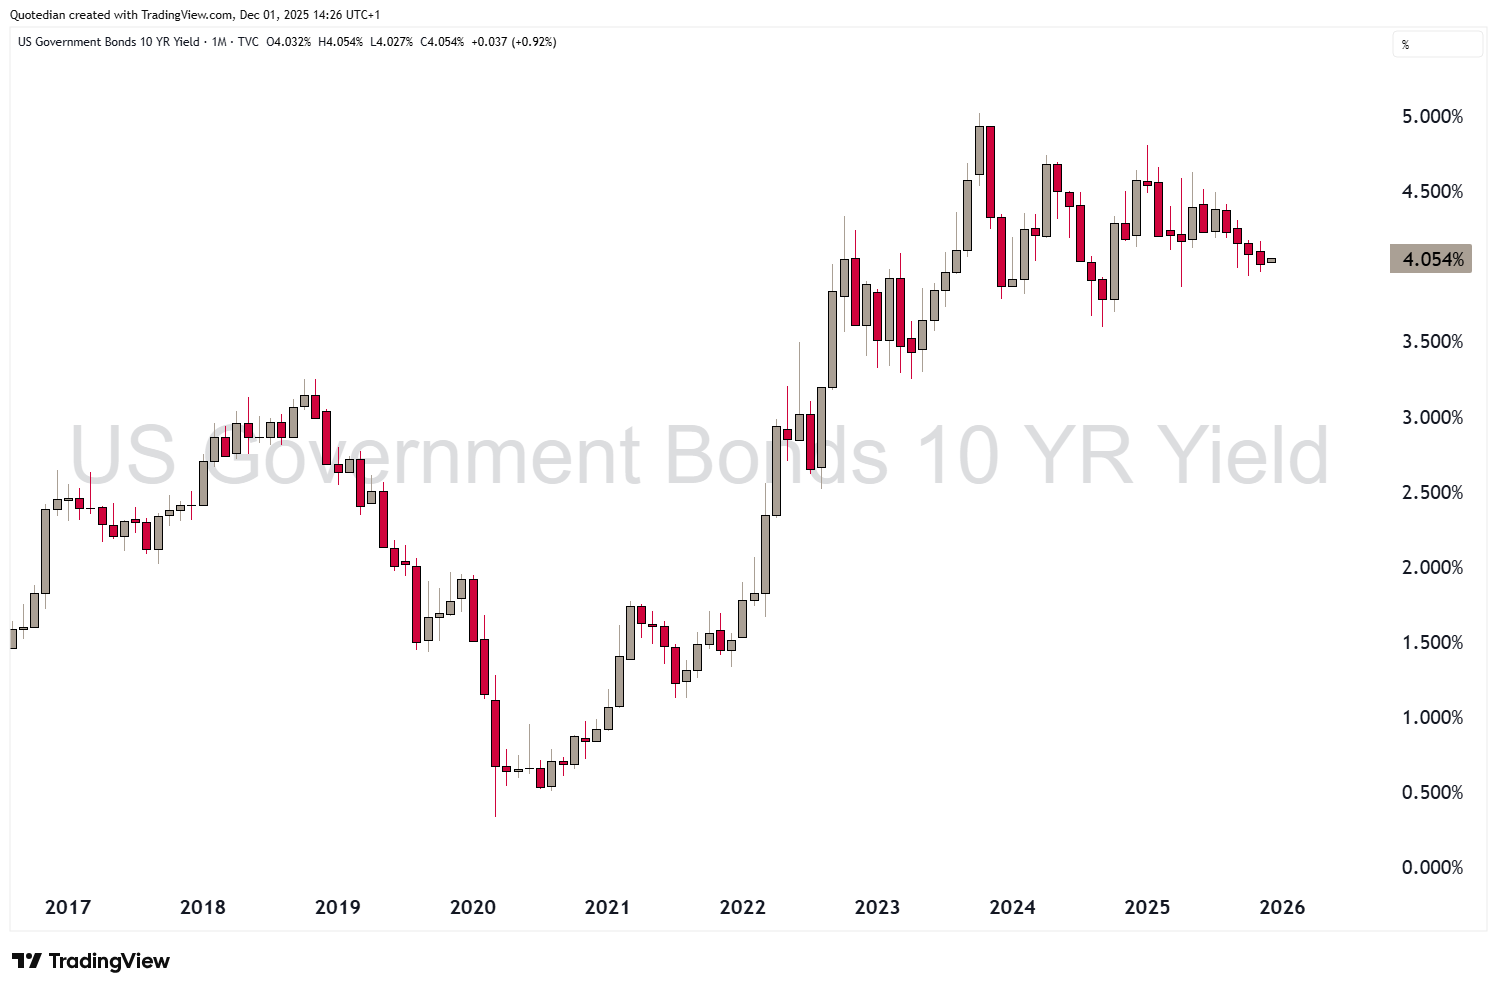
A tad lower perhaps, with the US 10-year Treasury dropping to 4% at the tail end of the month:
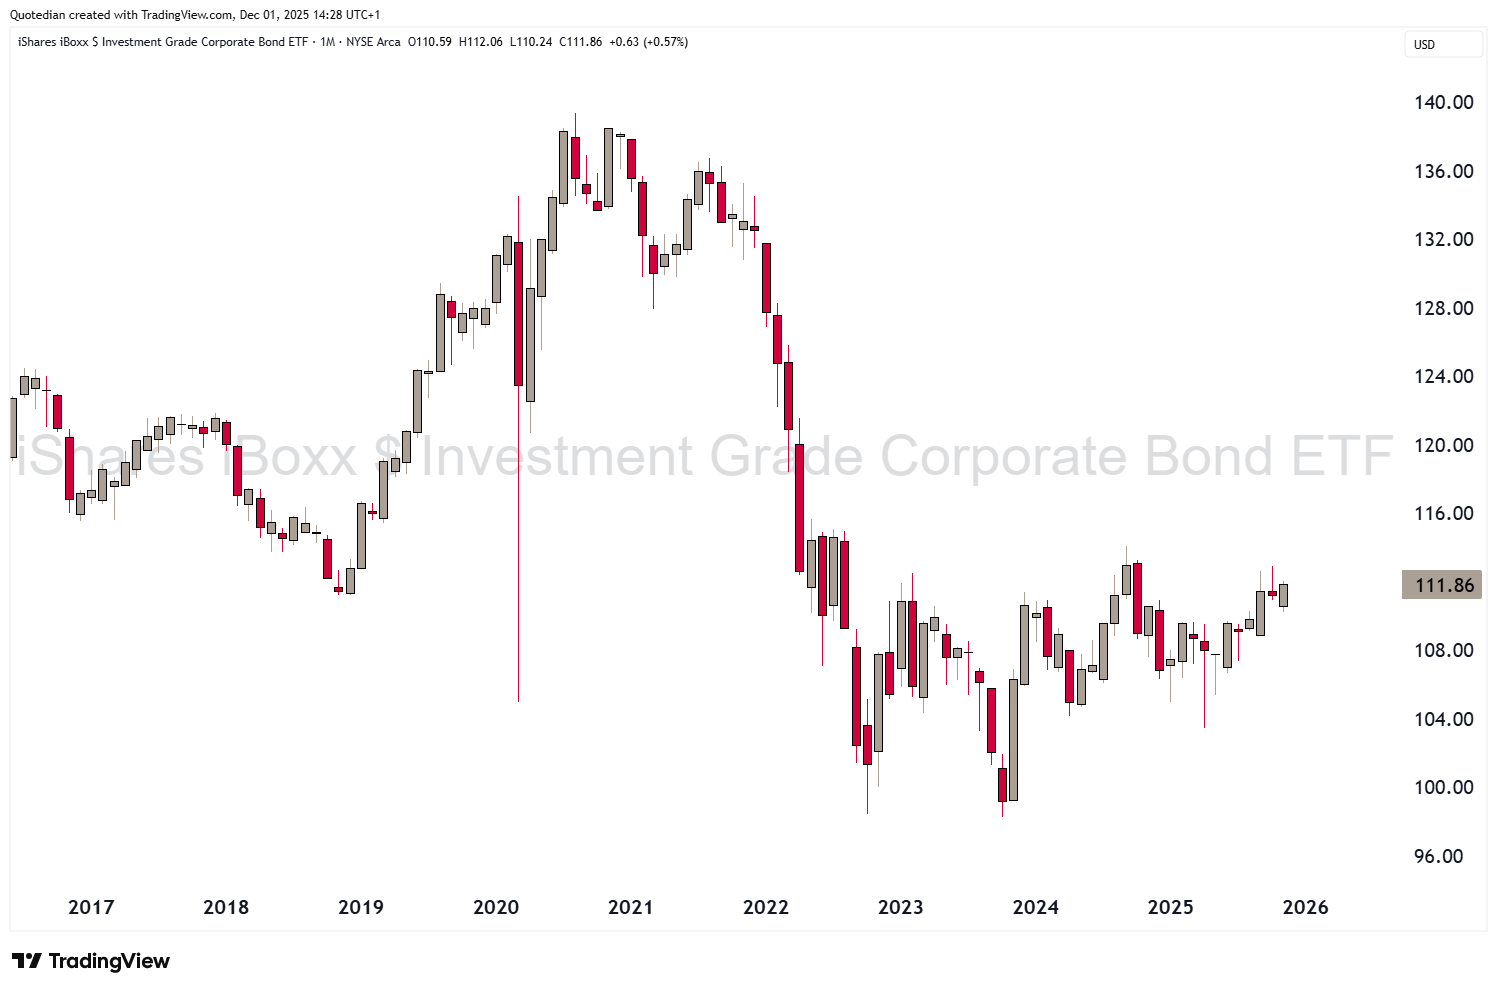
Given the equity rally towards the end of the month, credit risk has probably done well too. Here’s the investment grade (IG) side of the credit risk equation via the iShares iBoxx Investment Grade Corporate Bond ETF:
So, if IG bonds have done well, surely high yield bonds should have done even better, no? Or was the AI-credit hiccup enough to derail the entire high yield market. Let’s check via the iShares iBoxx High Yield Corporate bond ETF:
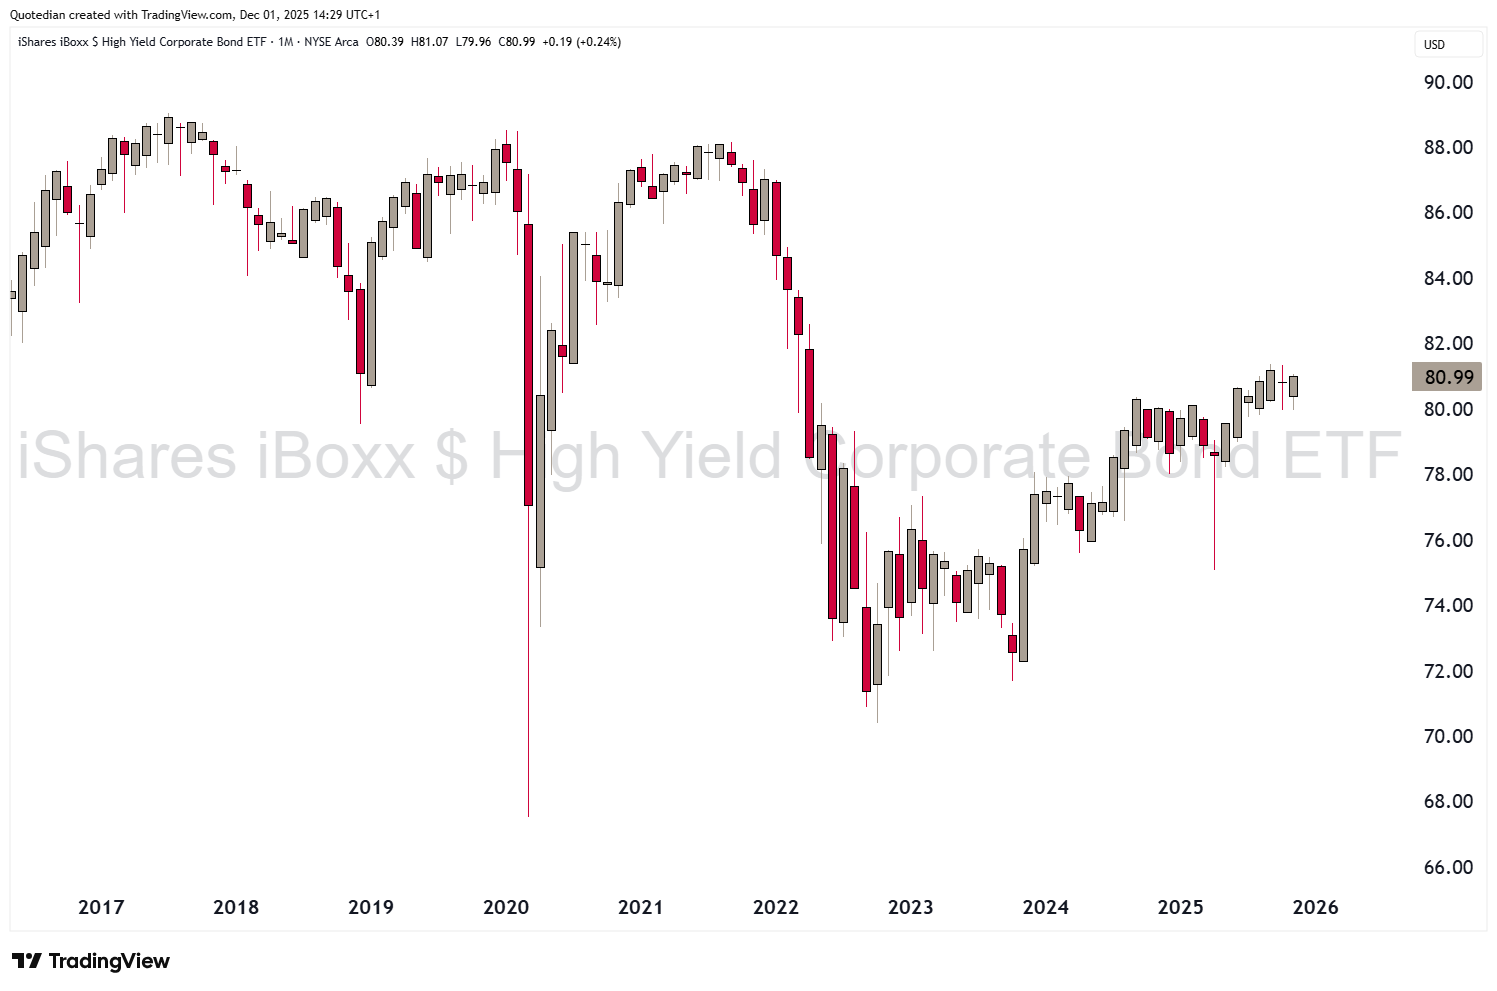
Hhhhm, I would call it a draw, with the ETF up less than a quarter percent.
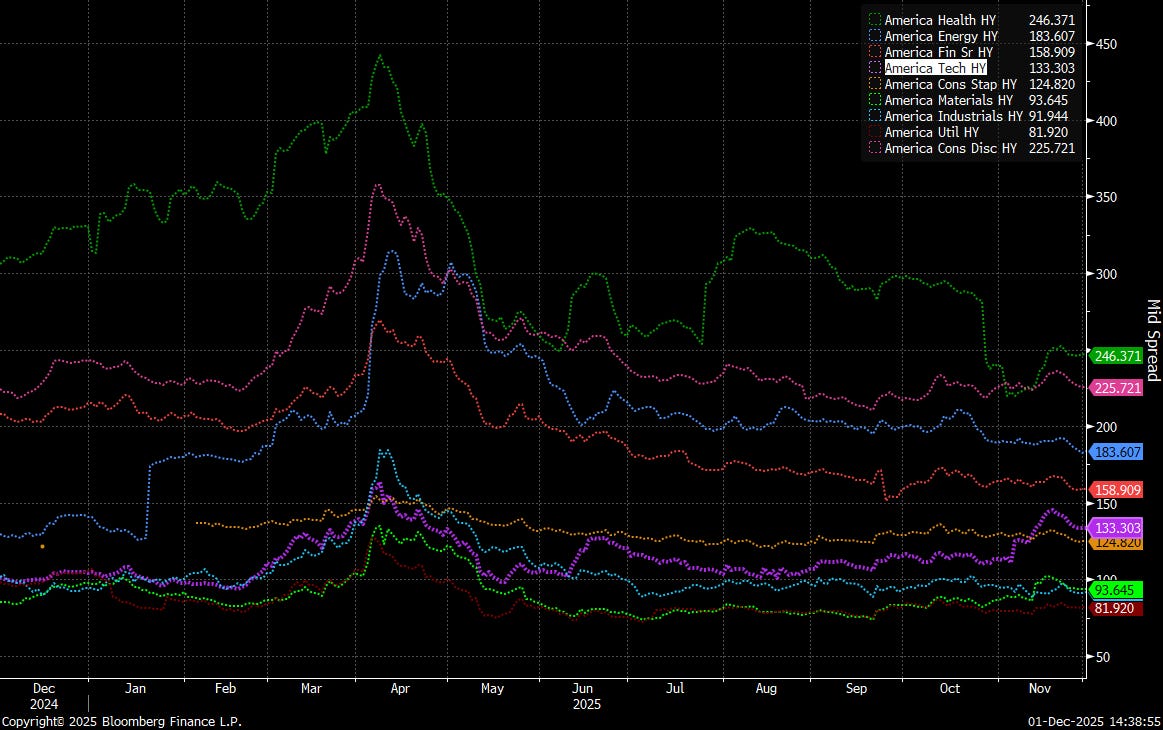
Looking at the different CDS (Credit Default Swap) rates, i.e. the cost of insuring against a default, at American High Yield Sector level, we do see a little pick-up in hedging cost for the tech sector (purple), but really nothing to write home about:
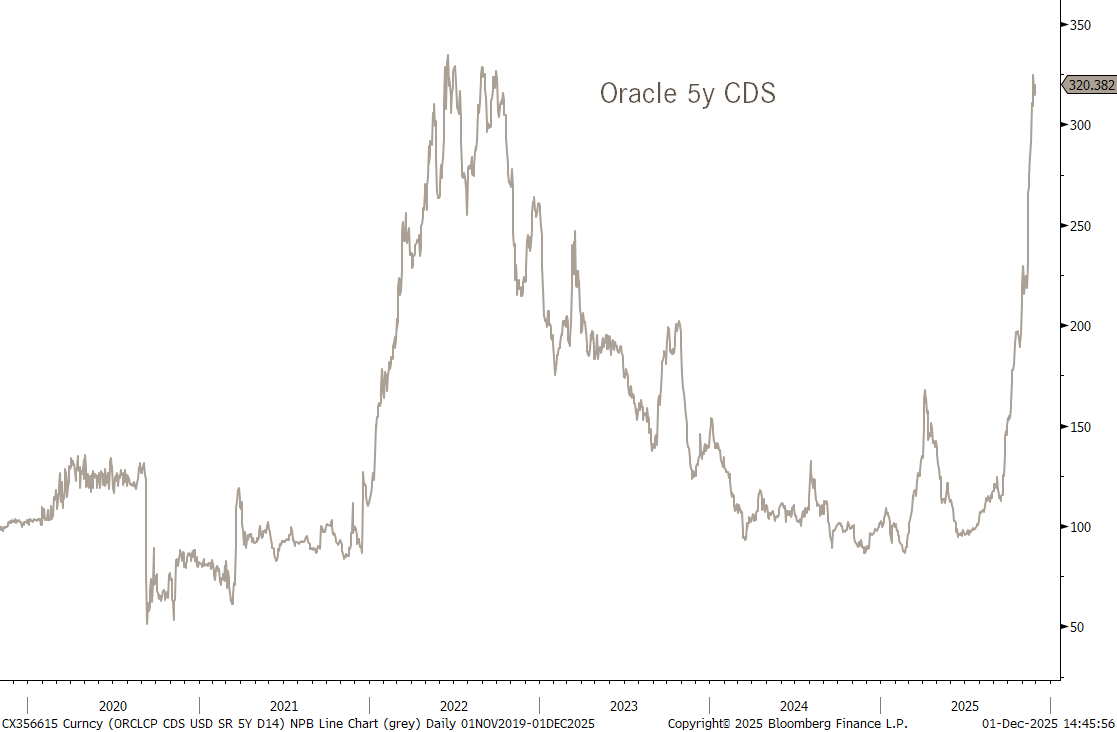
It results than that this in the meantime famous chart of the widening CDS rate on Oracle, due to presumably too steep spending plans, has not contaminated the rest of the sector … yet …
Now, before we head over into the FX section, we need to talk JGBs…
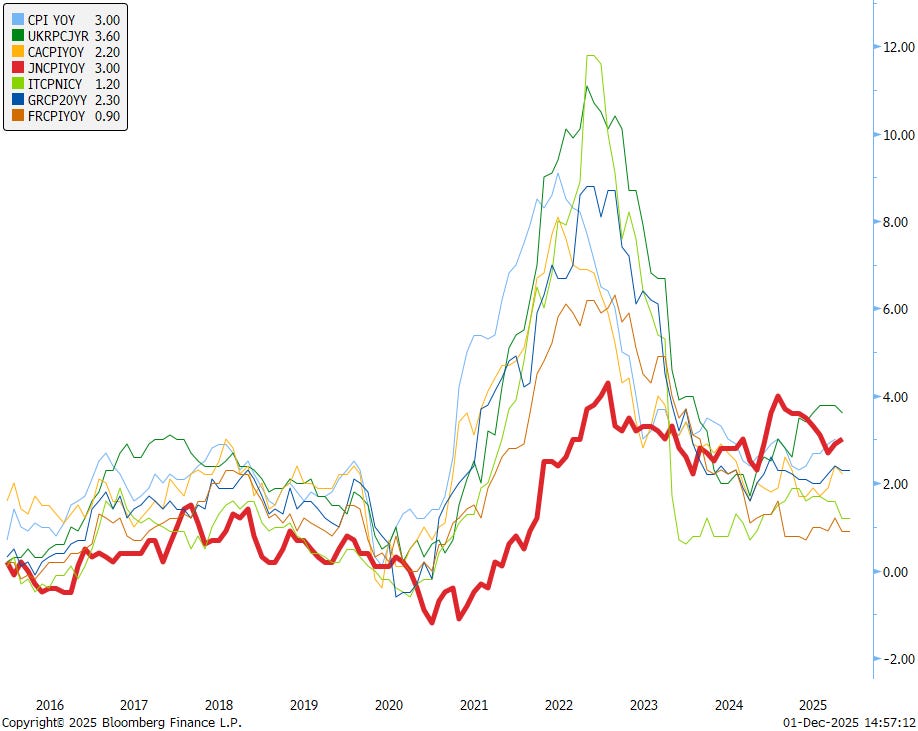
Of the G7 countries, Japan (red) has now the second highest inflation rate, after having had the lowest for decades:
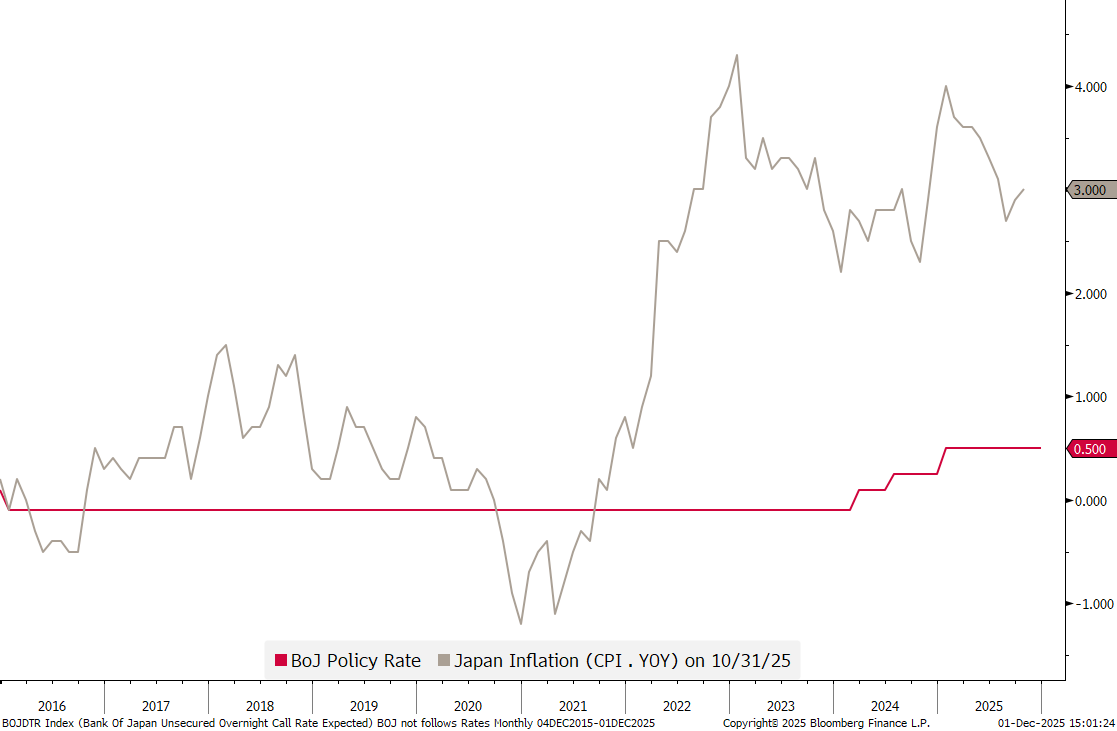
Yet, the Bank of Japan (BoJ) has been very slow to increase its benchmark policy rate (red):
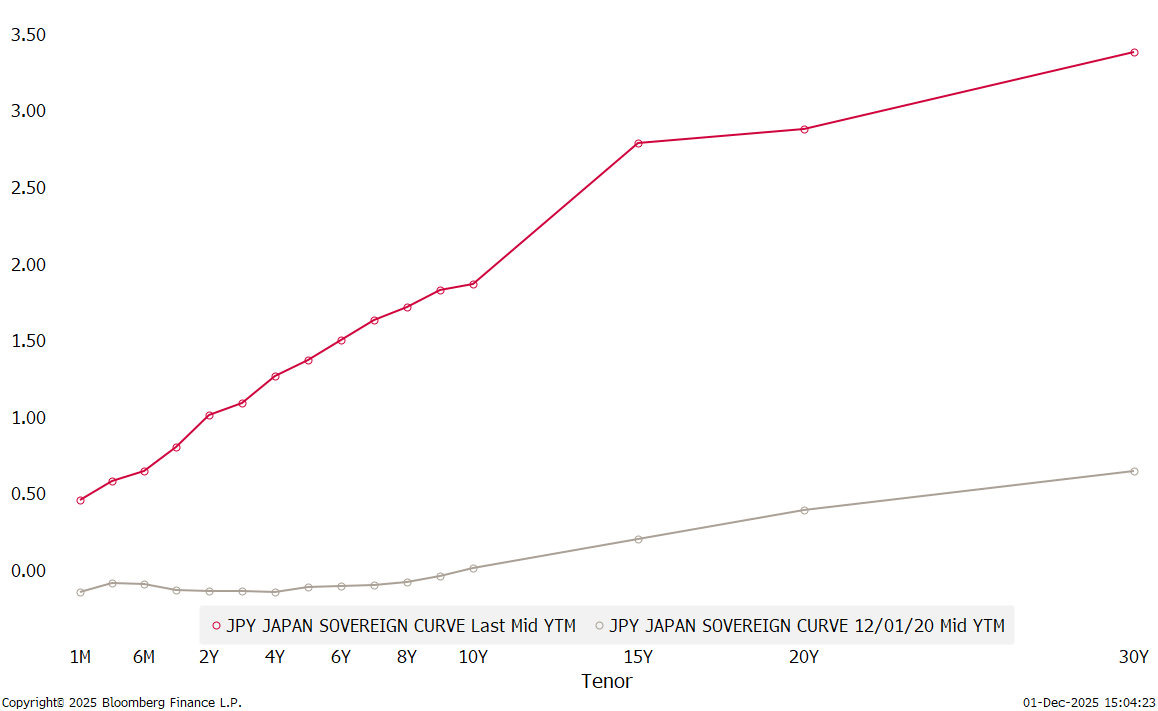
Which has put enourmous upside pressure on the long-end of the curve:
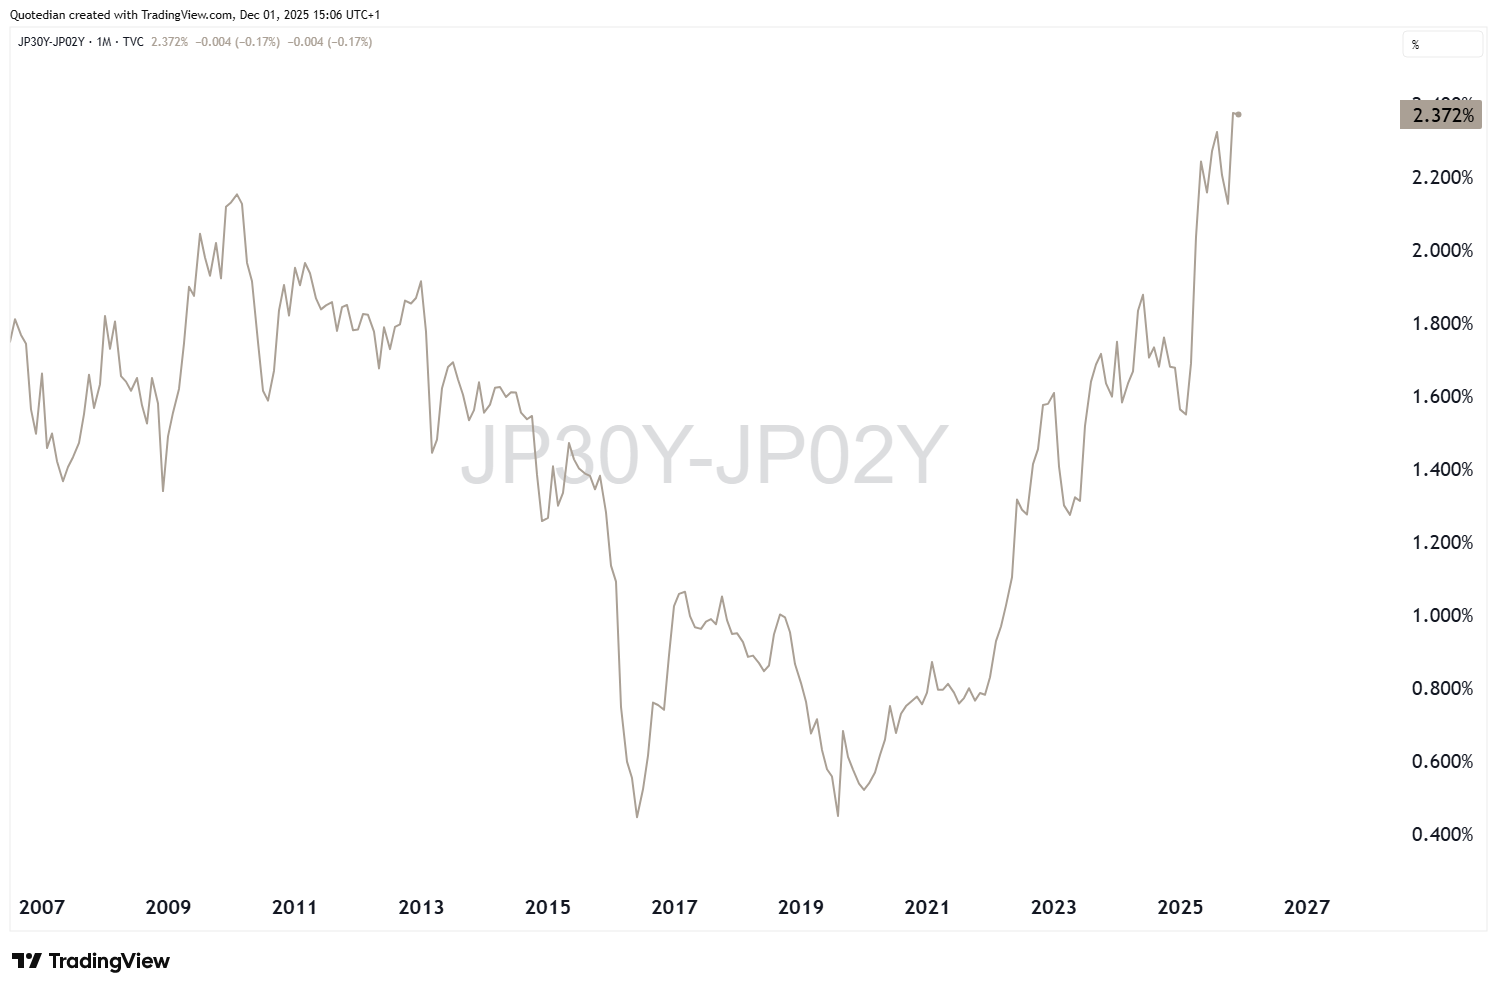
This steepening above looks on a spread chart (30y-2y) as follows:
Standalone JGB yield charts show that Runaway Train that is …well … running away. Here’s the monthly version of the 10-year JGB yield:

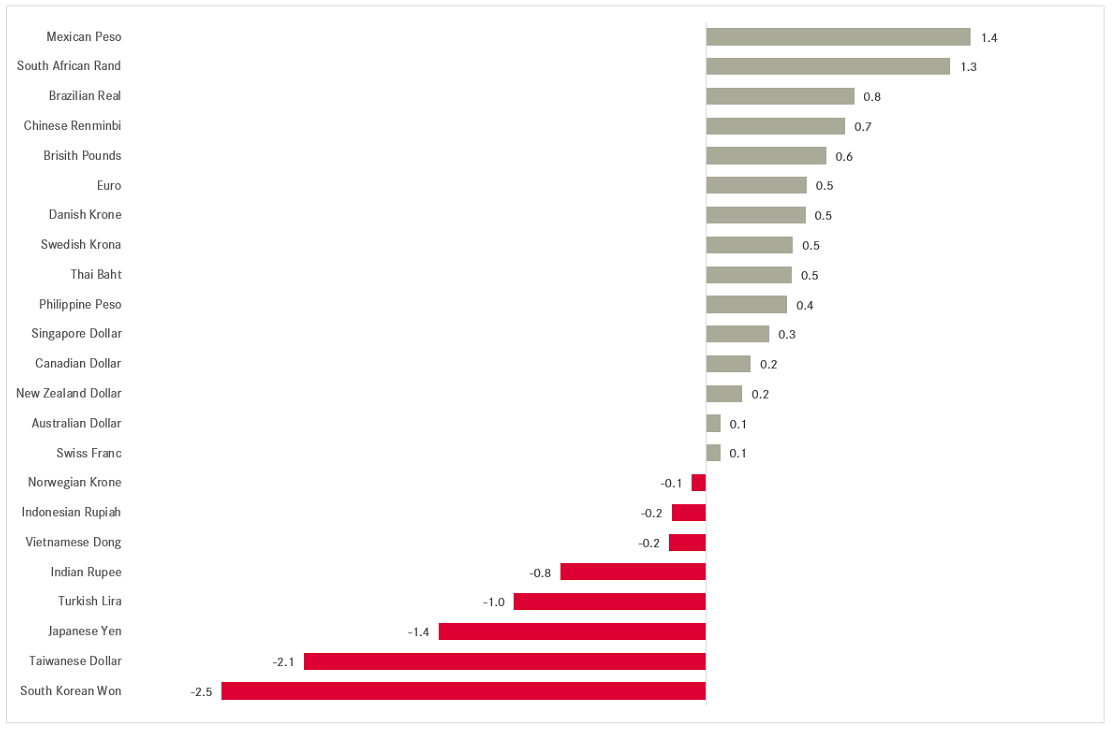
In the currency space, it has been a mixed month for the US Dollar:
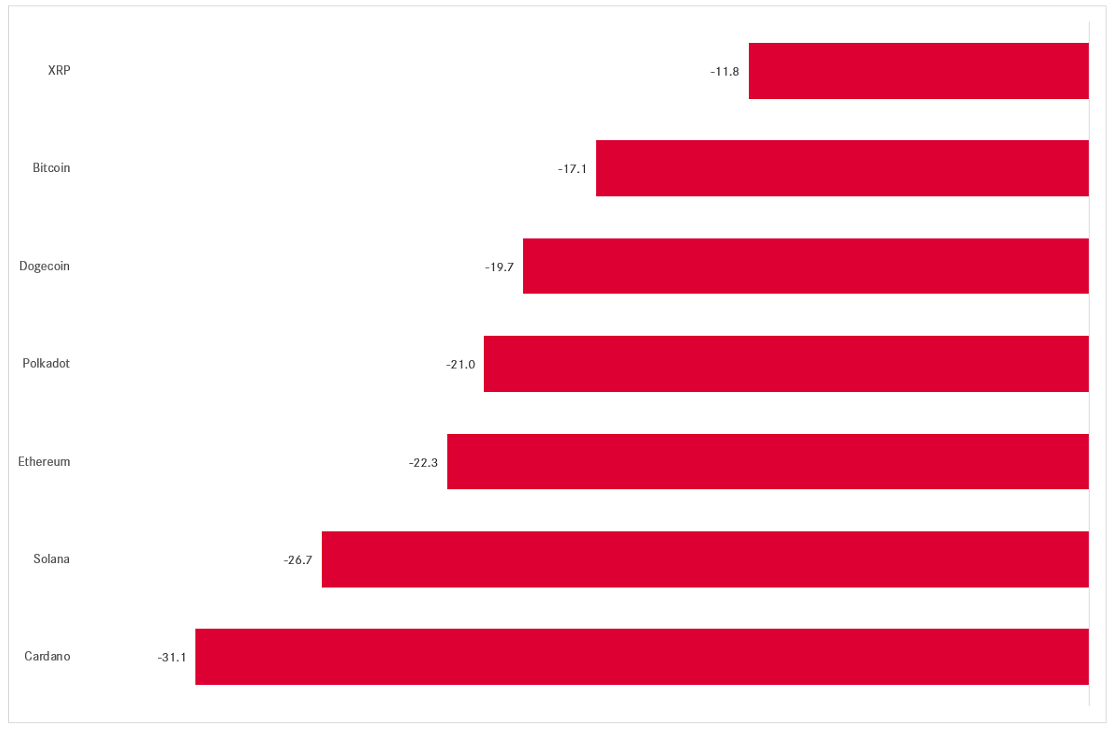
But a decisively bad month for cryptocurrencies:
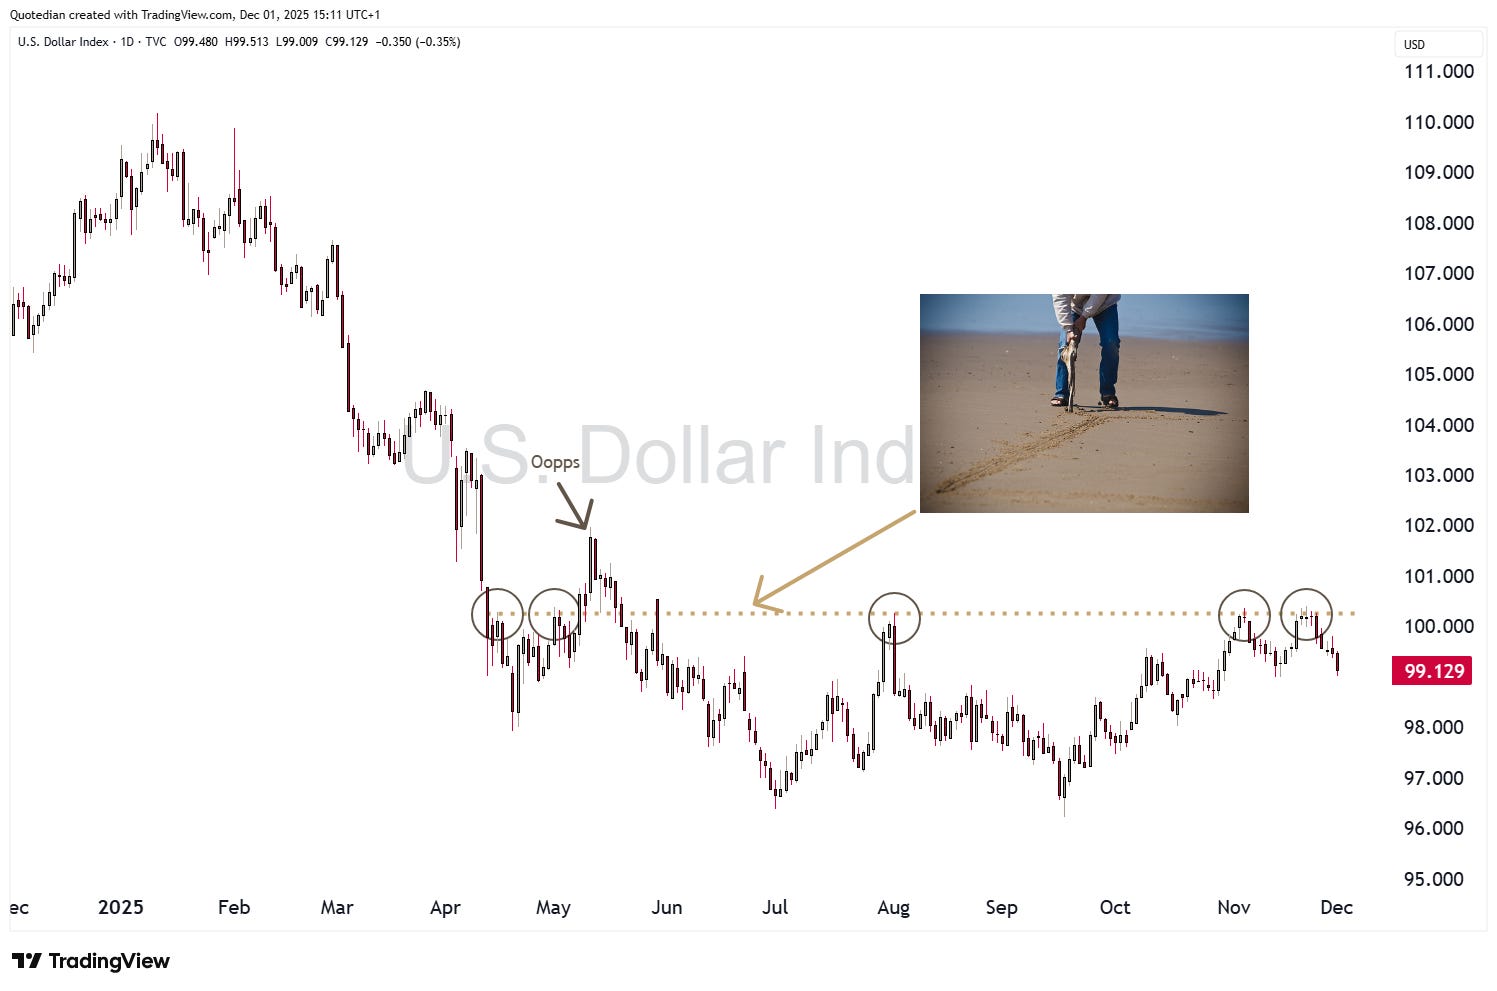
The Dollar Index has been range trading:
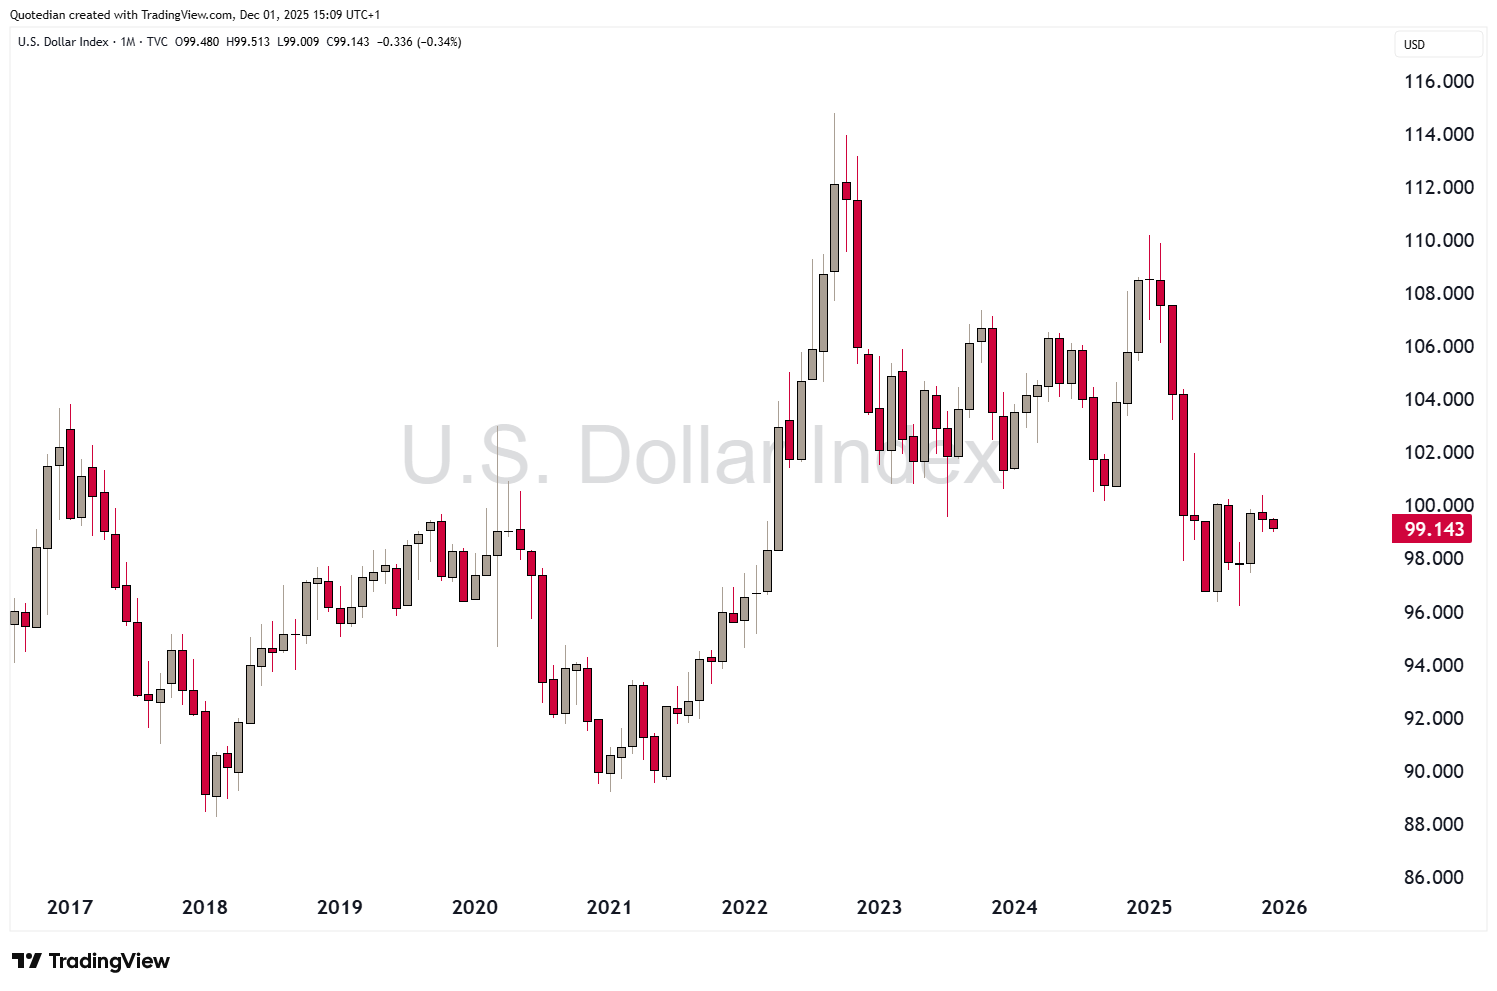
But a higher frequency (daily) chart, reveals better how shallow the USD recovery post the sell-off in the early innings of the year has been and often the DXY has banged its head against the $100 resistance:
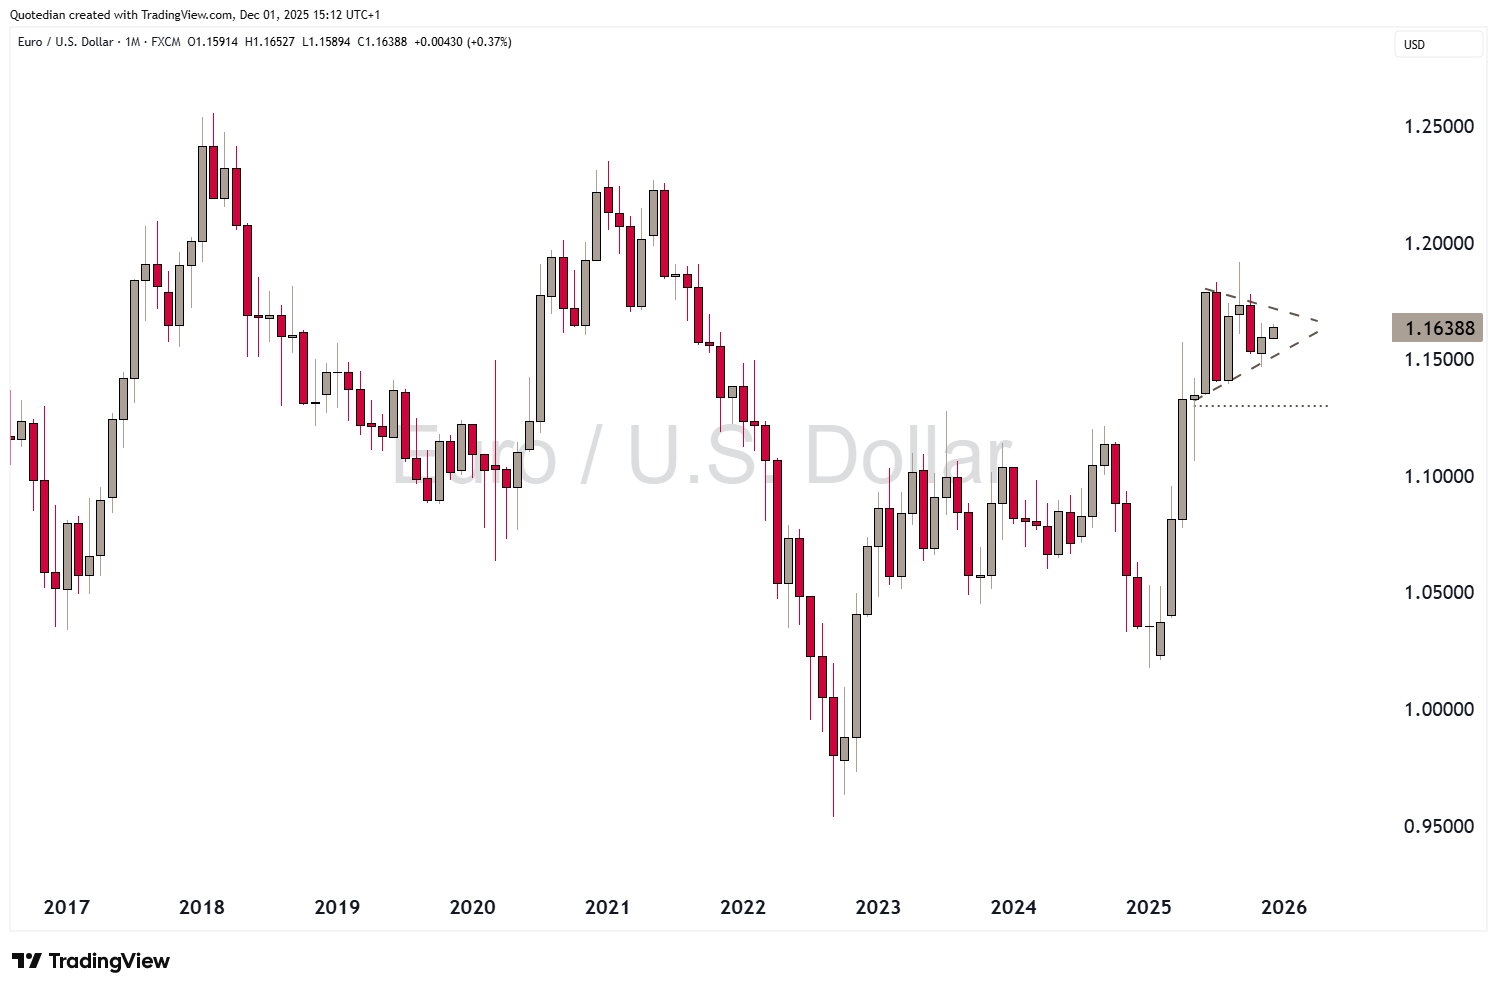
The EUR/USD cross may be ready to move out of its triangle soon (towards end of Q1/2026):
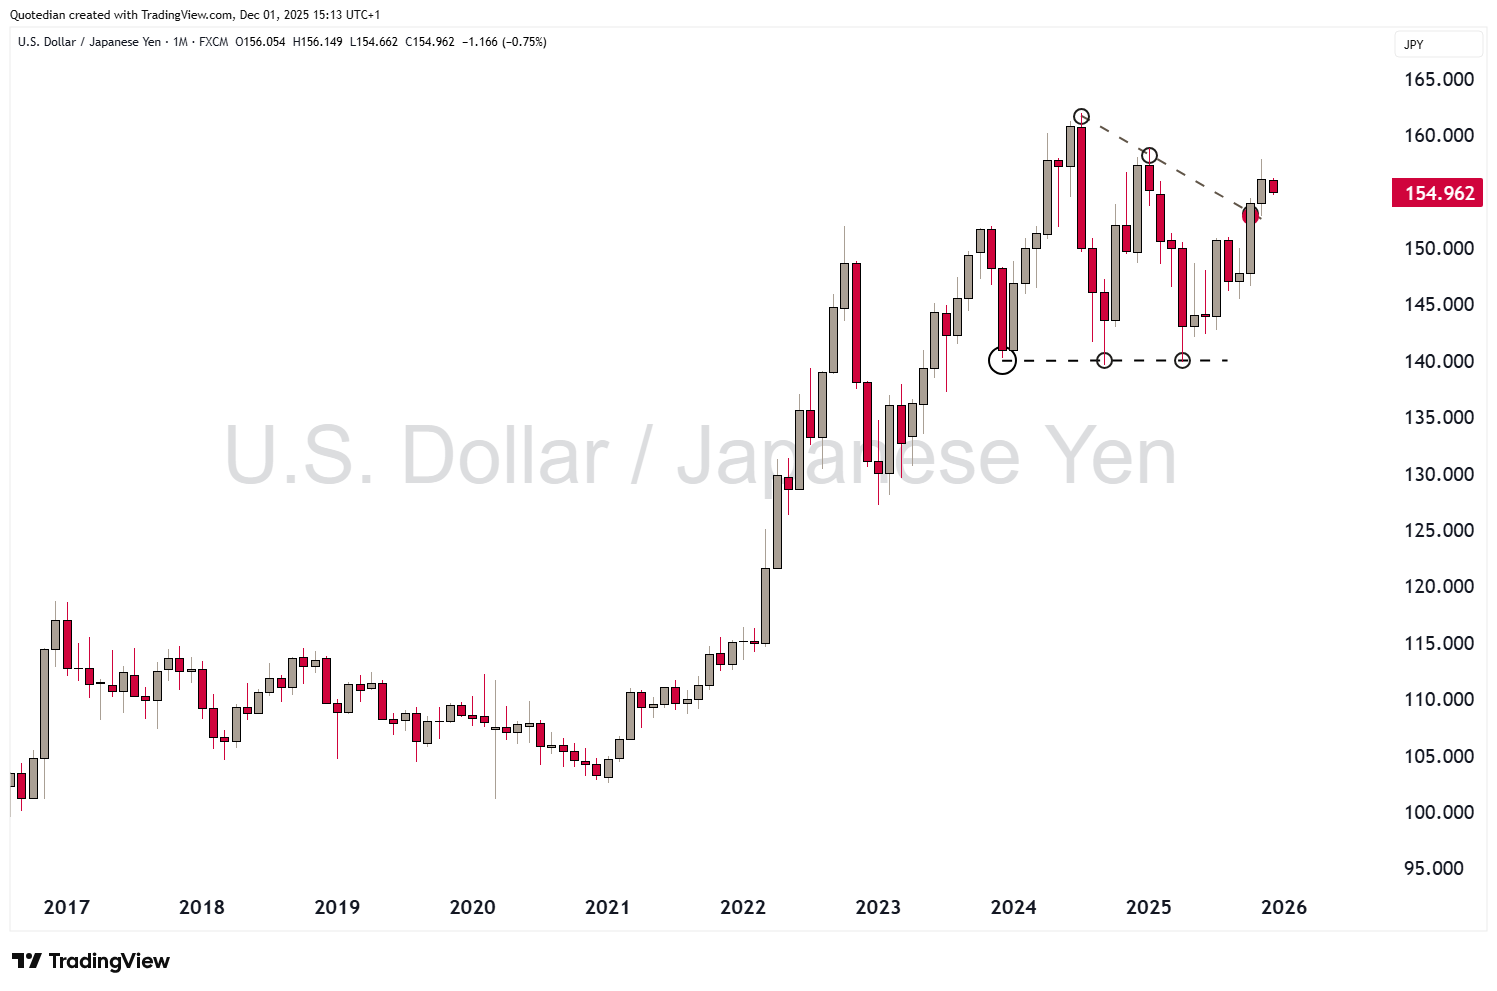
USD/JPY has broken out of its consolidation triangle, but not in the direction we (and most others) expected:
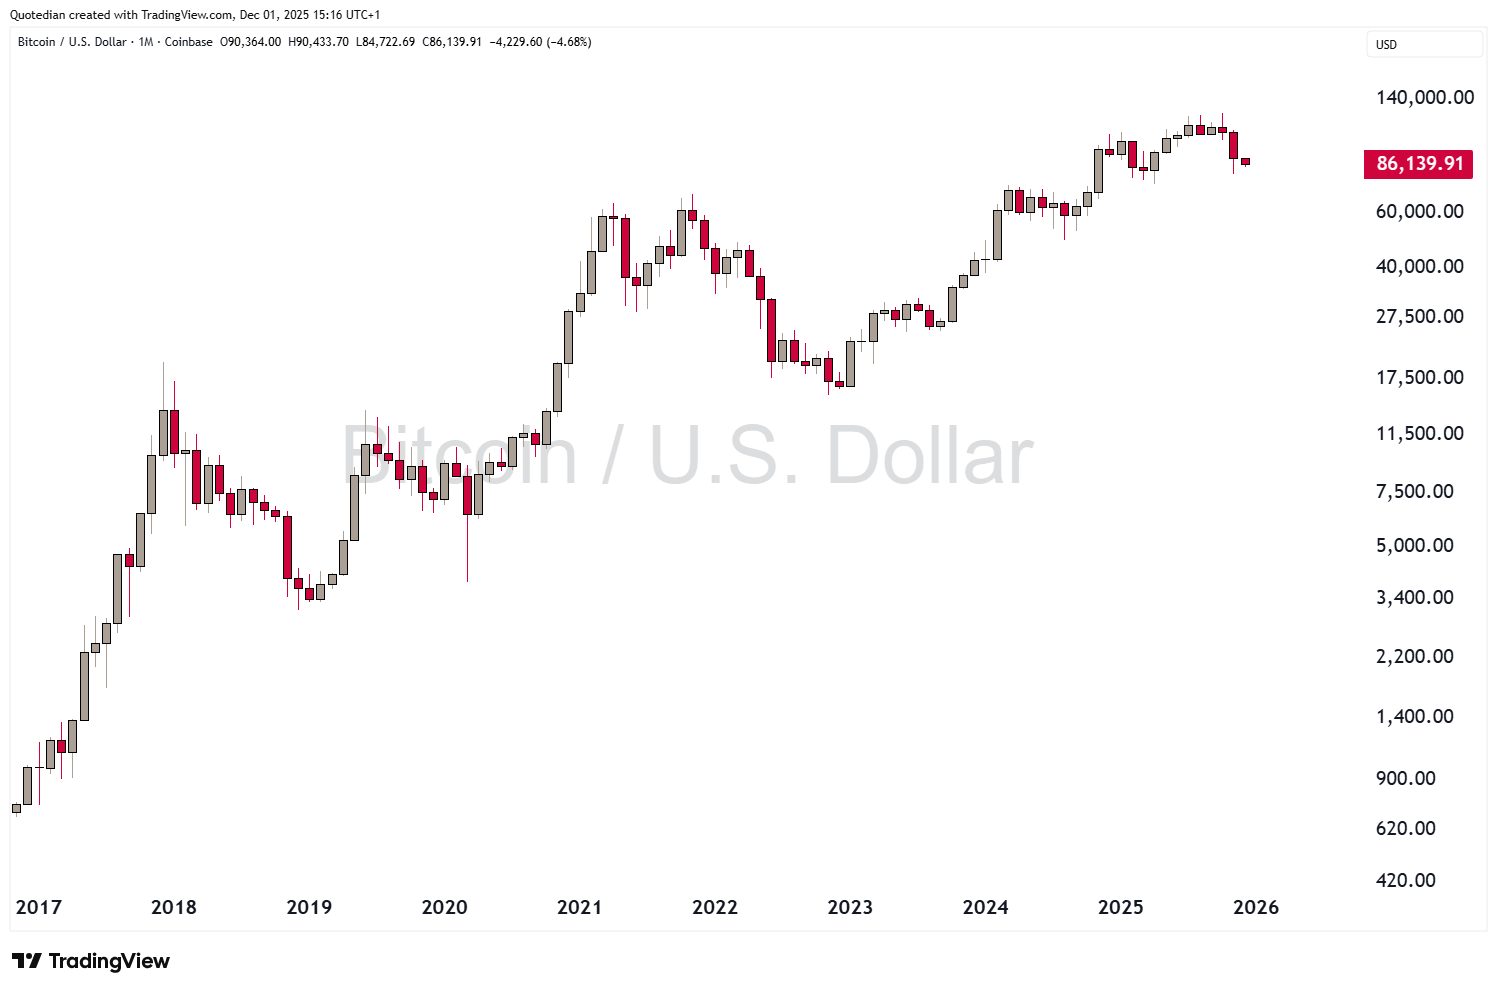
As mentioned, Bitcoin just had a bummer of a month, but was relatively one of the ‘best’ performers:
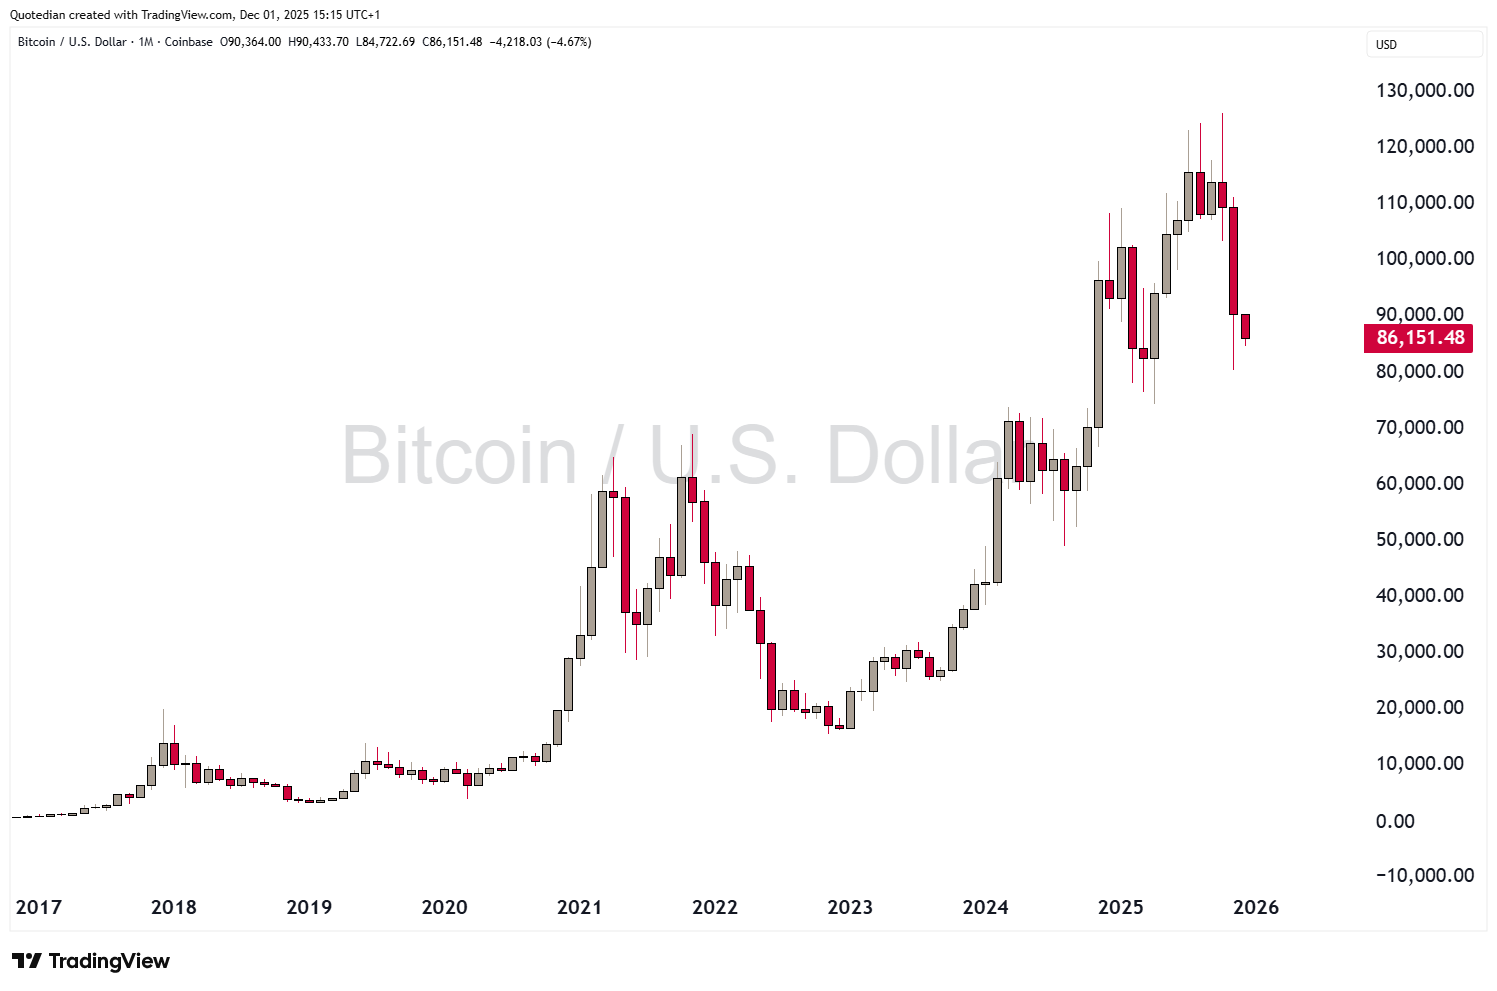
It looks a bit less brutal on a log-chart:
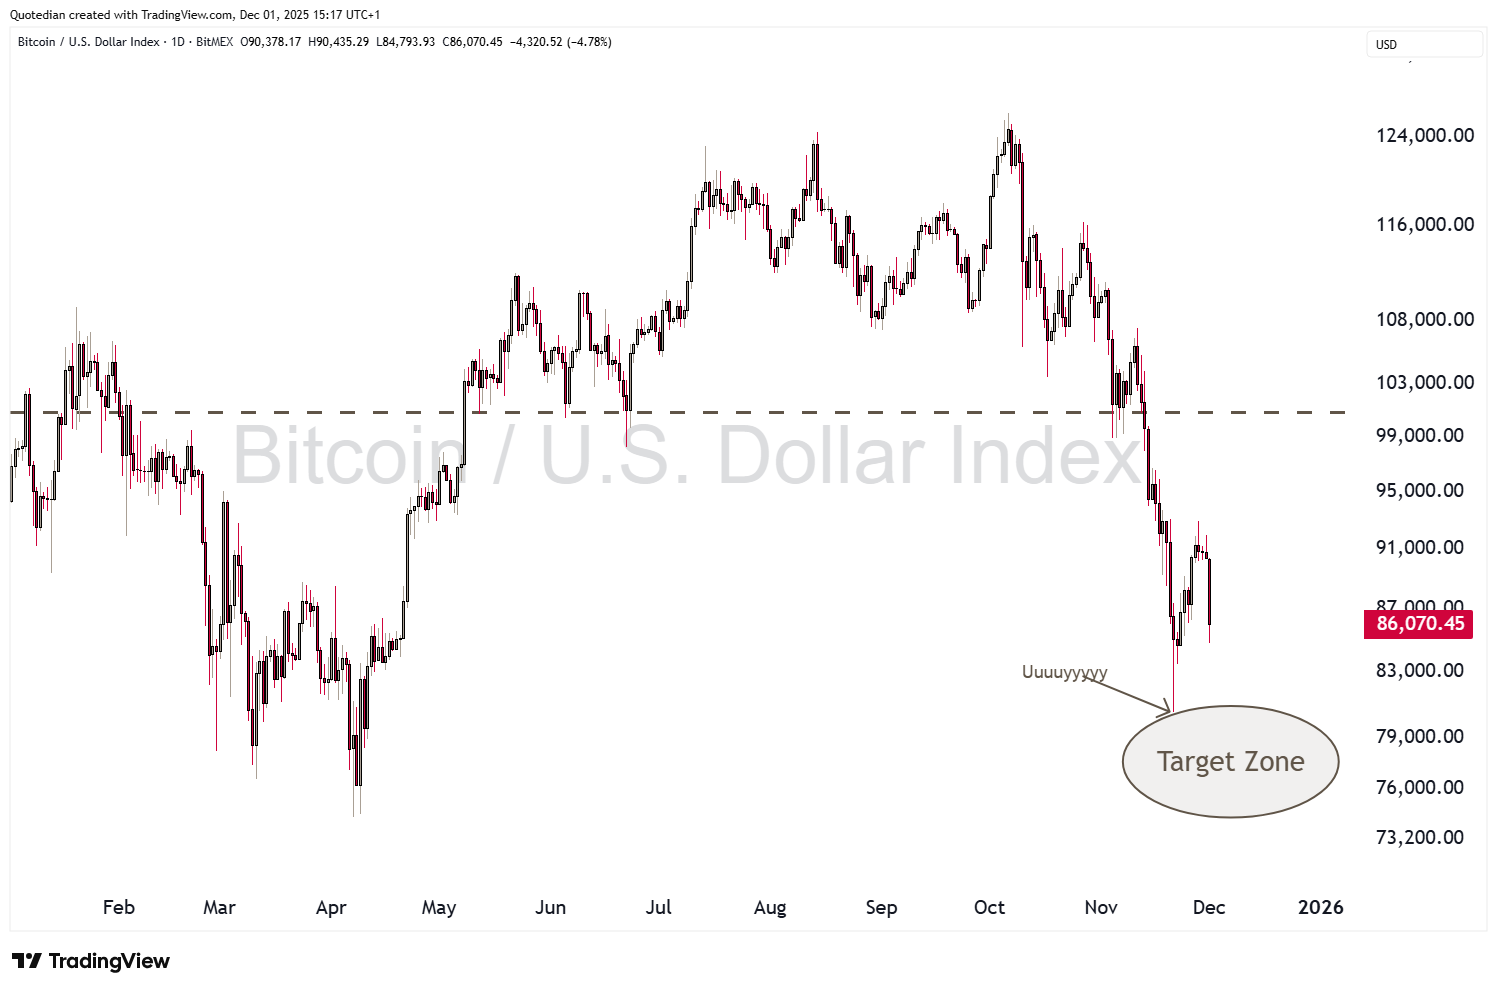
Our defined target from a few weeks ago was nearly hit on November 21st, but it seems today (December 1) that this may still happen:

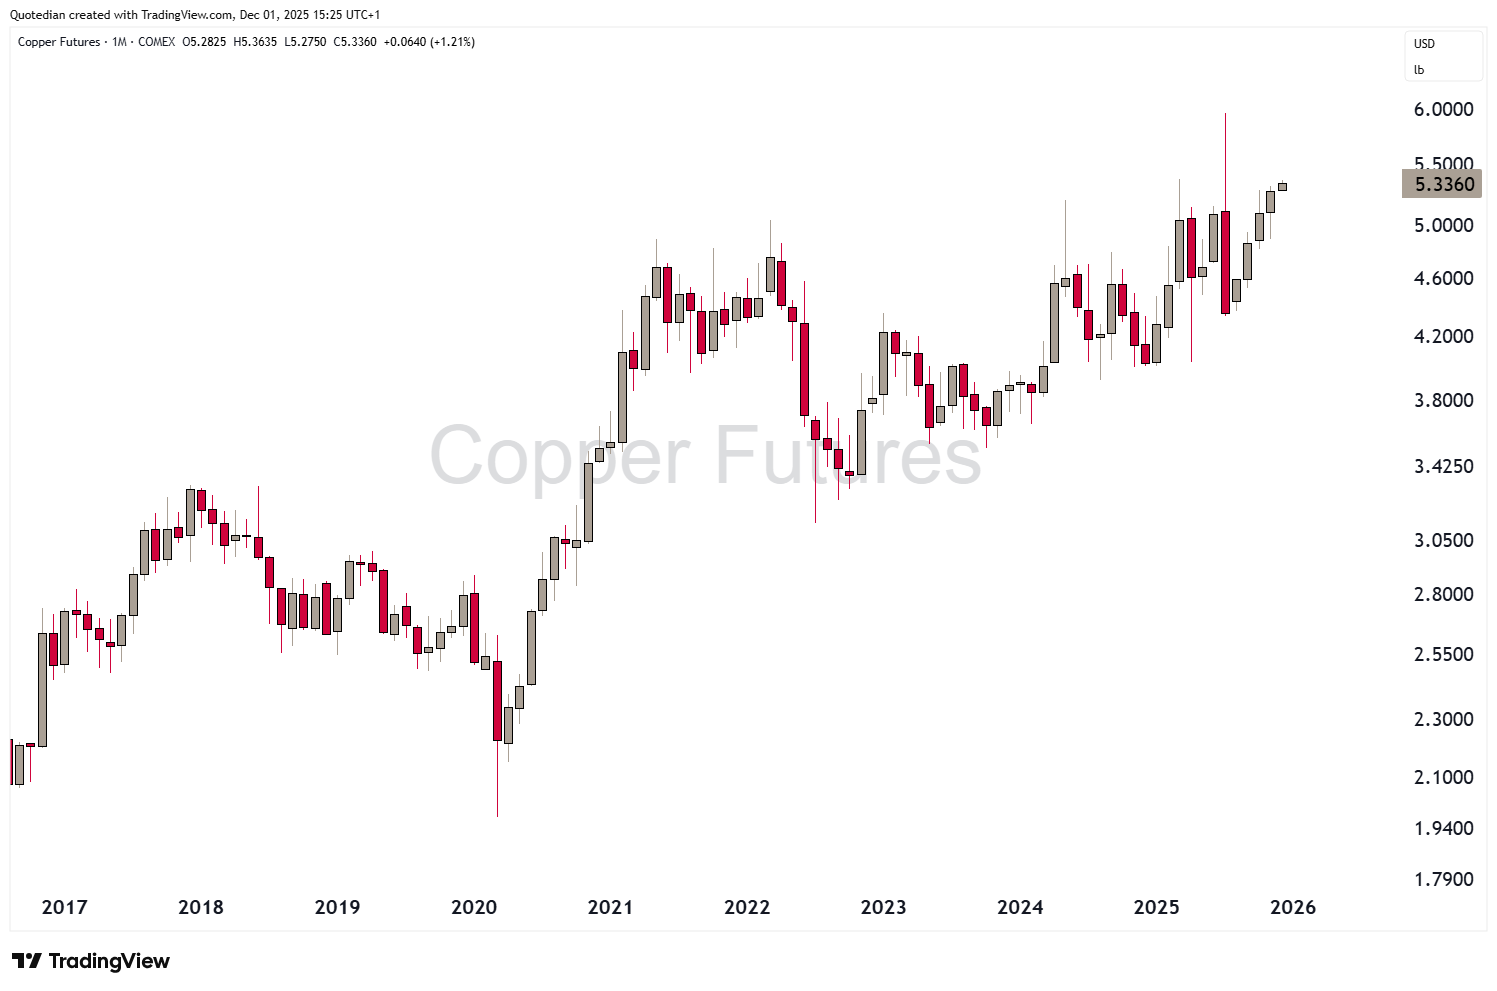
Finally, time to review what has been going on in our beloved commodity space, starting with a ‘sector’ performance overview first:
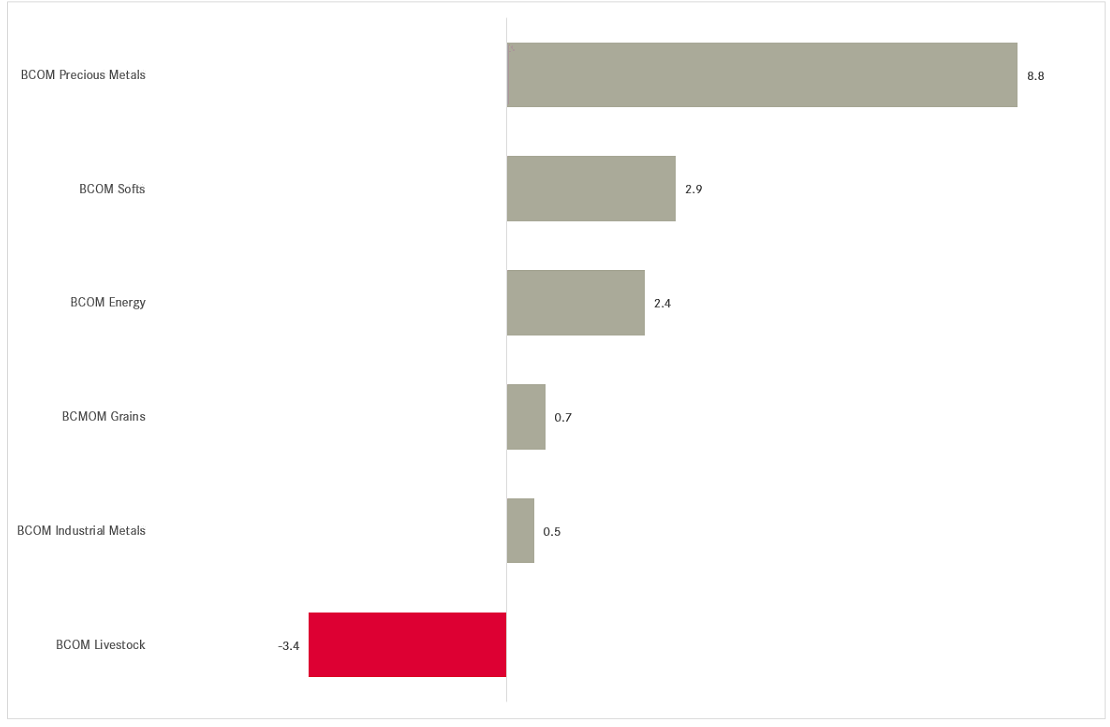
Precious metals continued to steam ahead and only livestock commodities had a negative months.
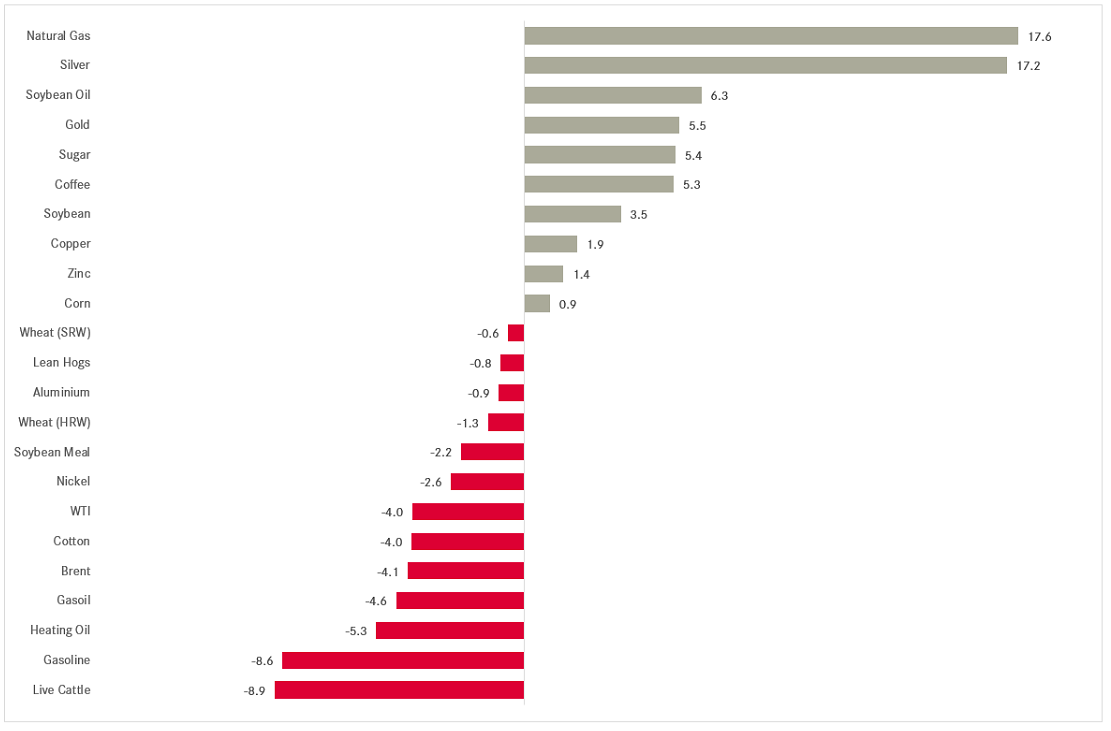
A more granular view shows the true winners and losers of November:
Remember that 10% late October/early November correction in Gold?
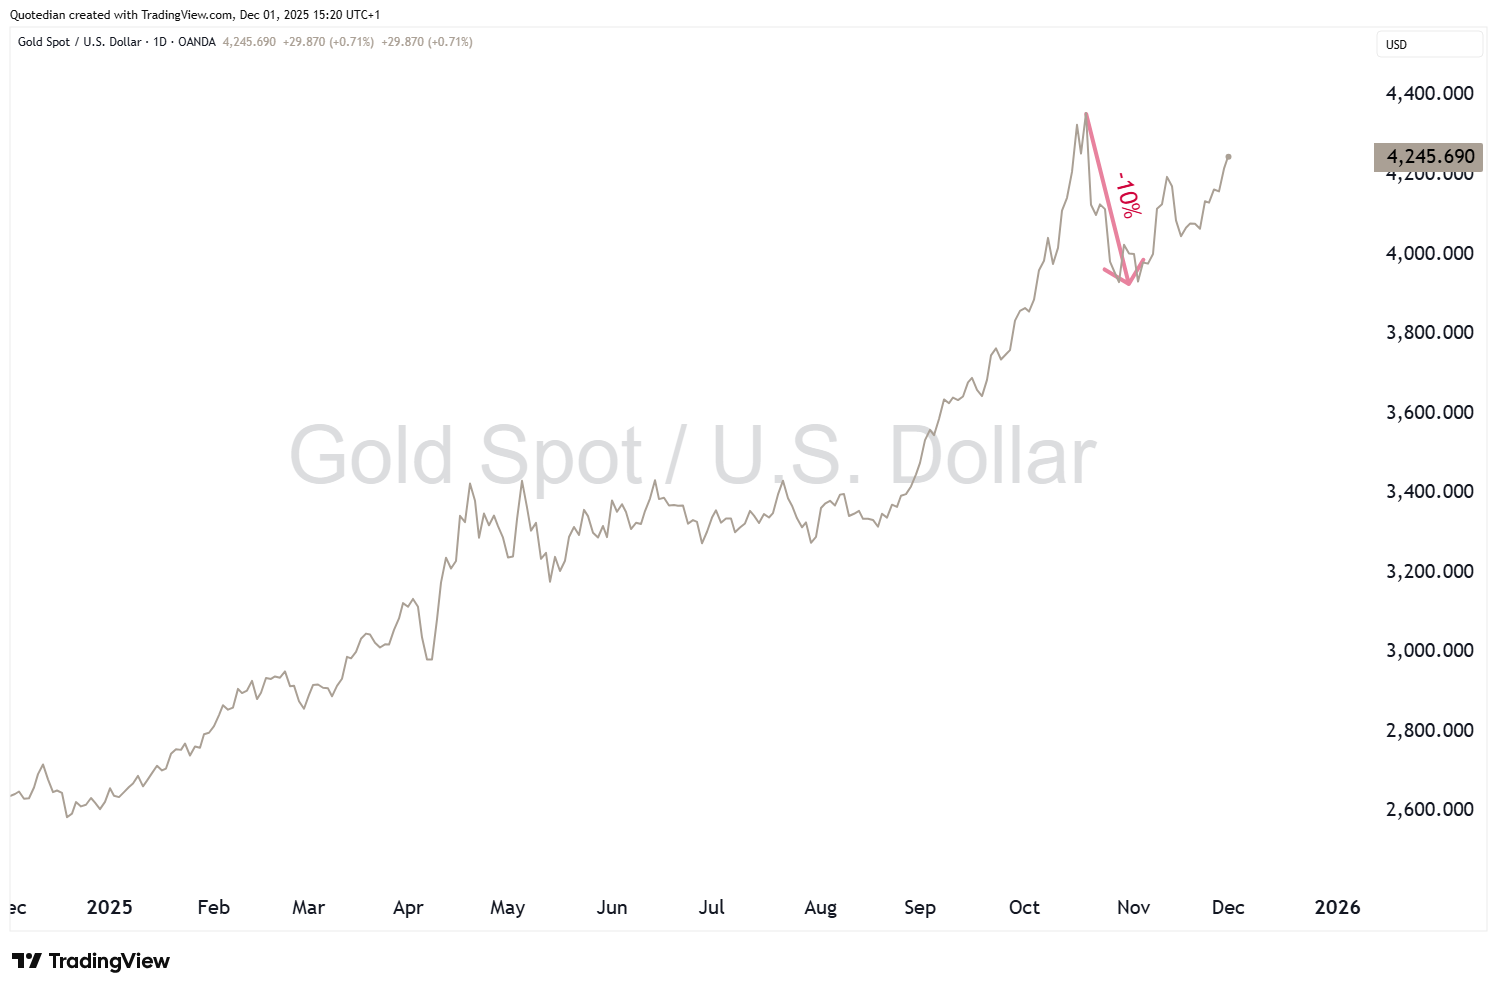
Us neither!
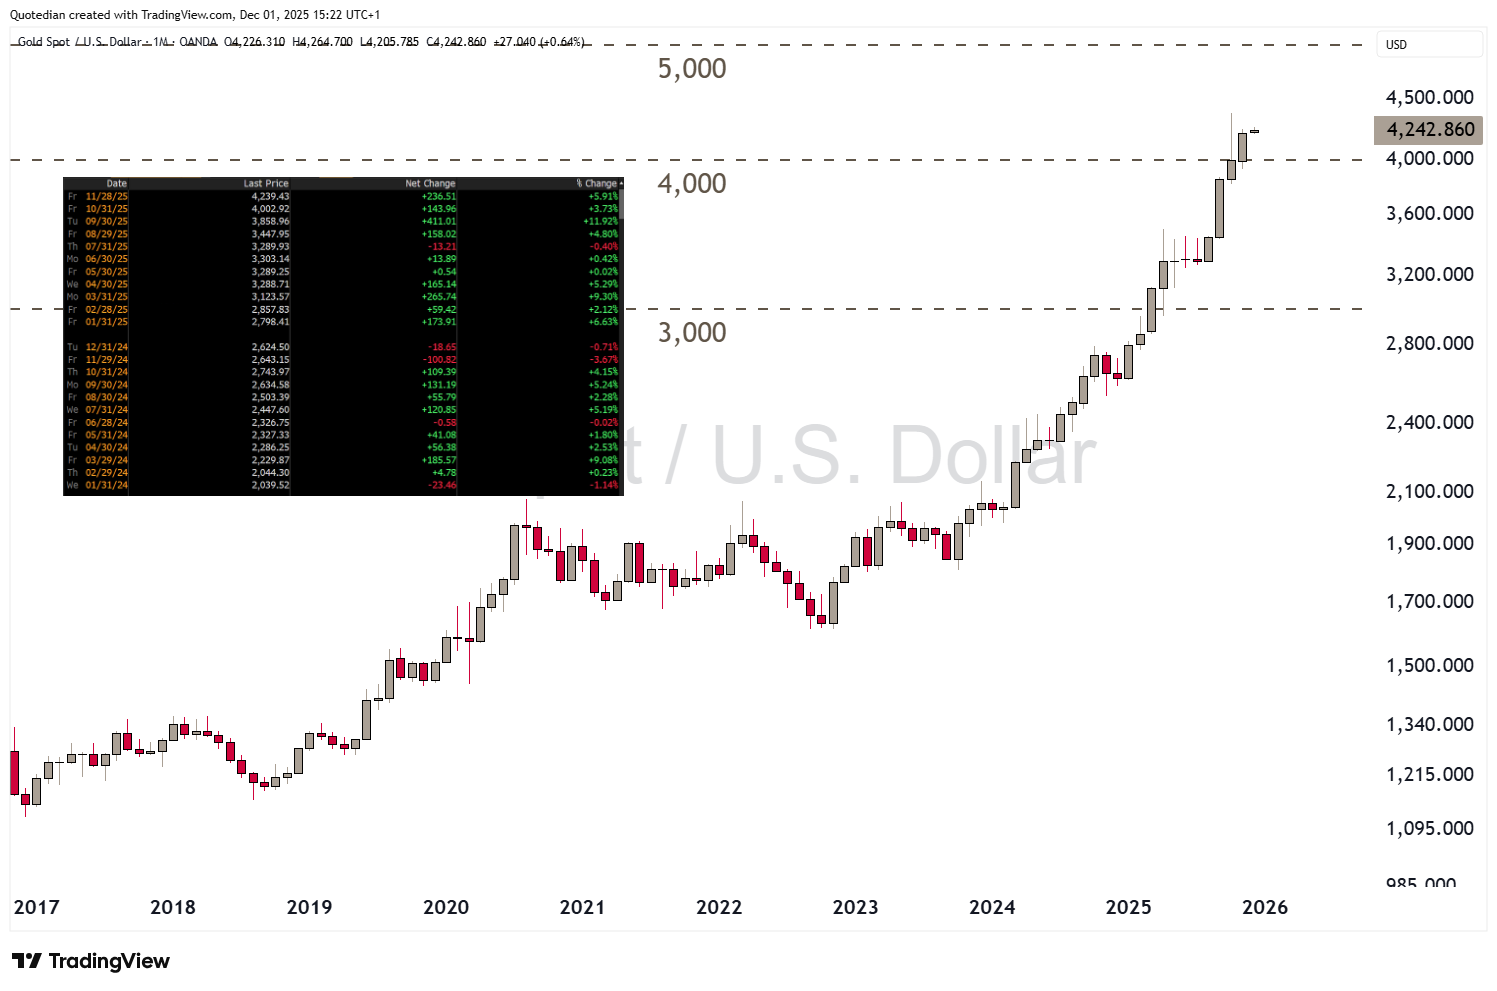
That’s now 19 up months in the past two years!
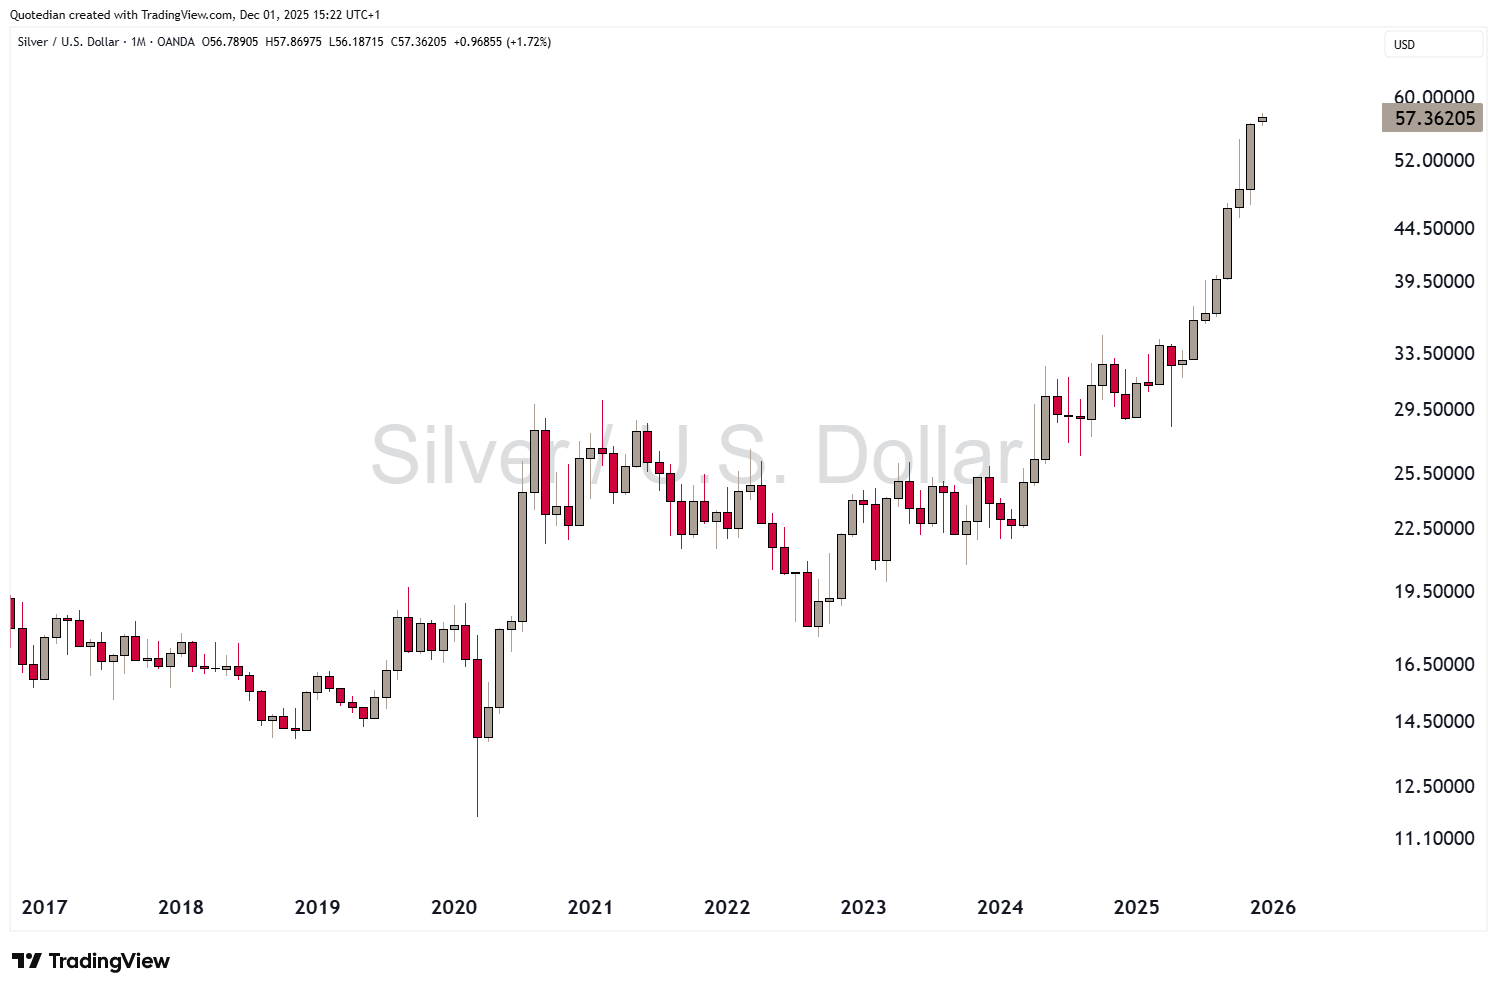
Silver has a similar good track record, at least this year:
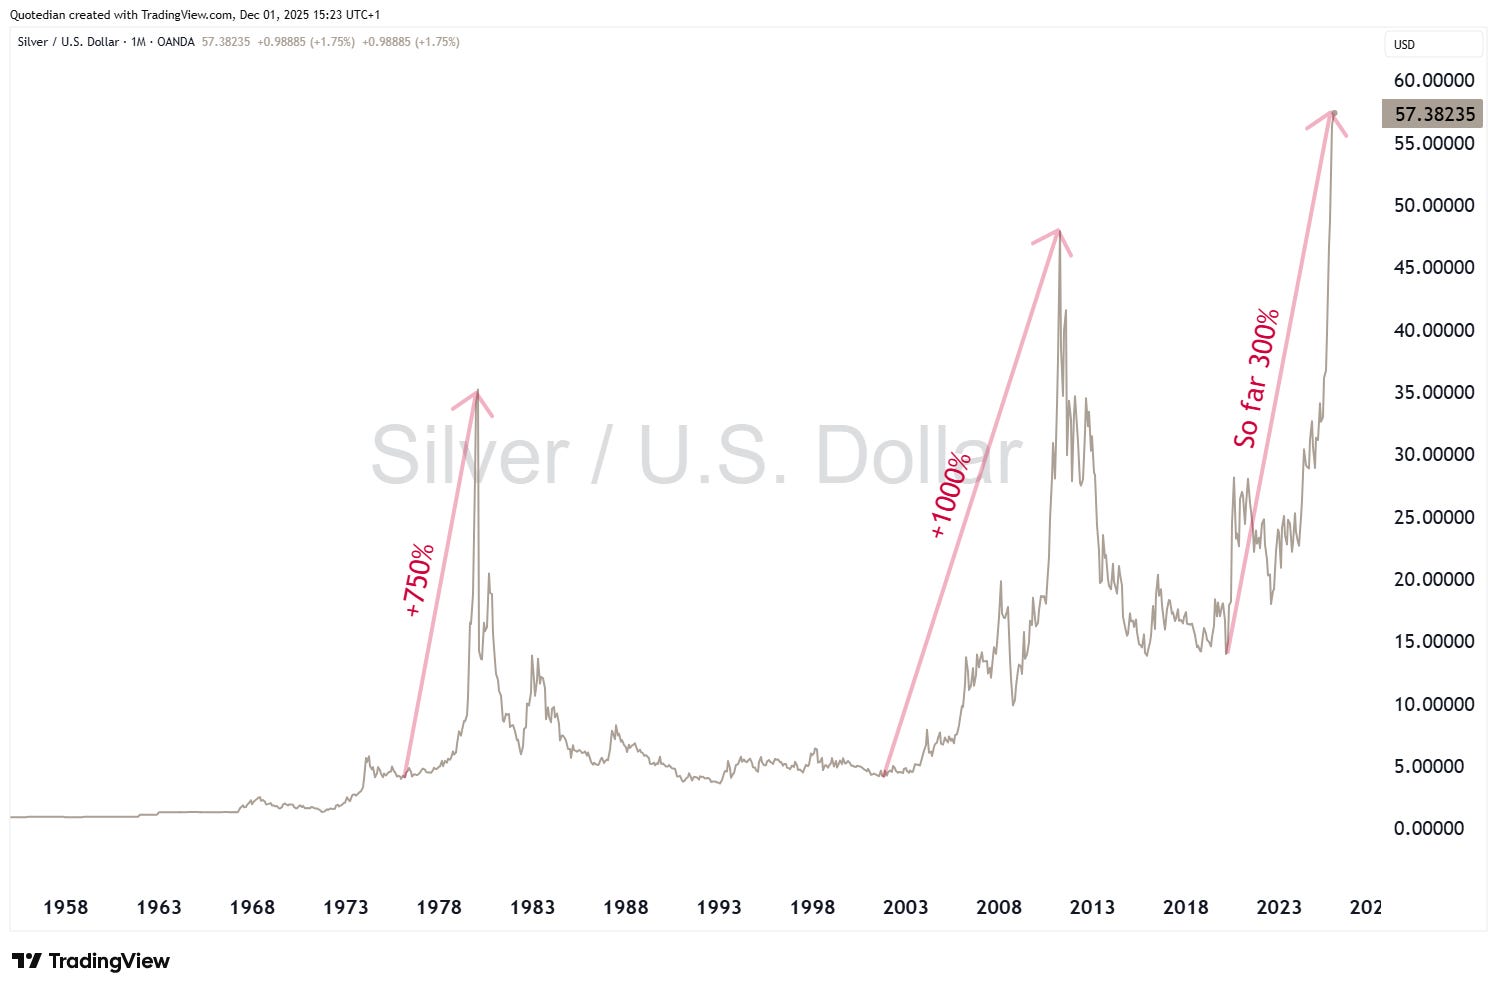
Remember this chart, which puts our price target well above $100:
The best performing commodity futures (on our list) was Natural Gas (Henry Hub) in November. Is this maybe the best AI-infrastructure play?
At least the chart continue to look very bullish.
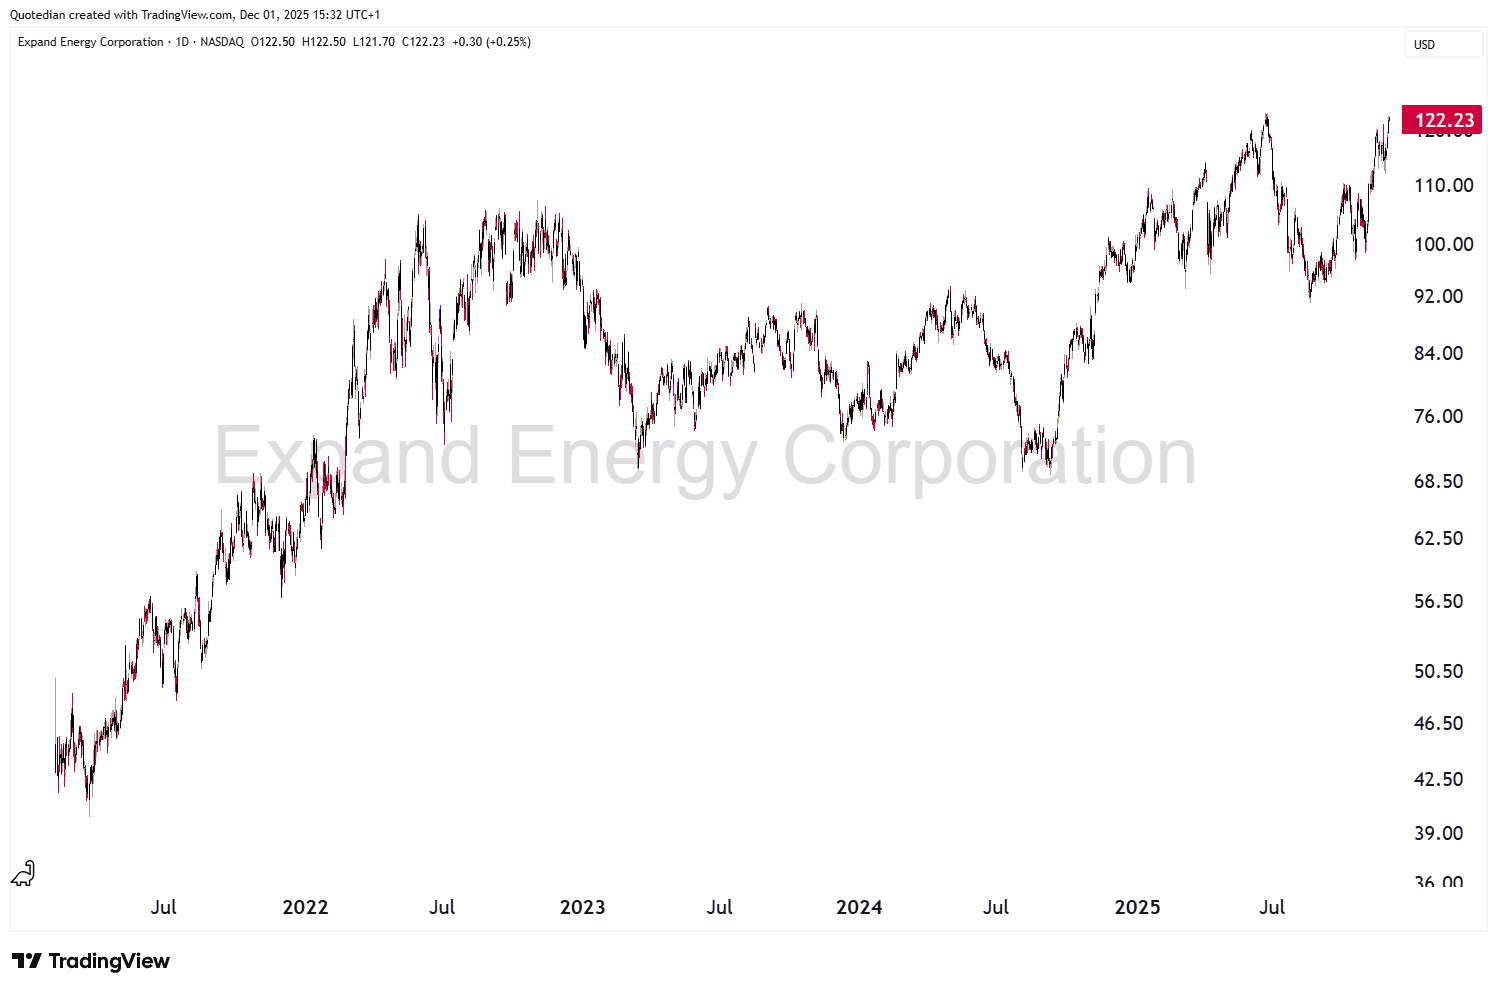
For many investors it is difficult to play commodity futures, even via commodity future ETFs, which tend to be costly given the roll-over needs of the underlying. We continue to play these commodity ideas via commodity-related single equity, ETF or active fund ideas.
For example, we like Expand Energy (ex Chesapeak Energy) to express the natural gas bull just discussed previously:
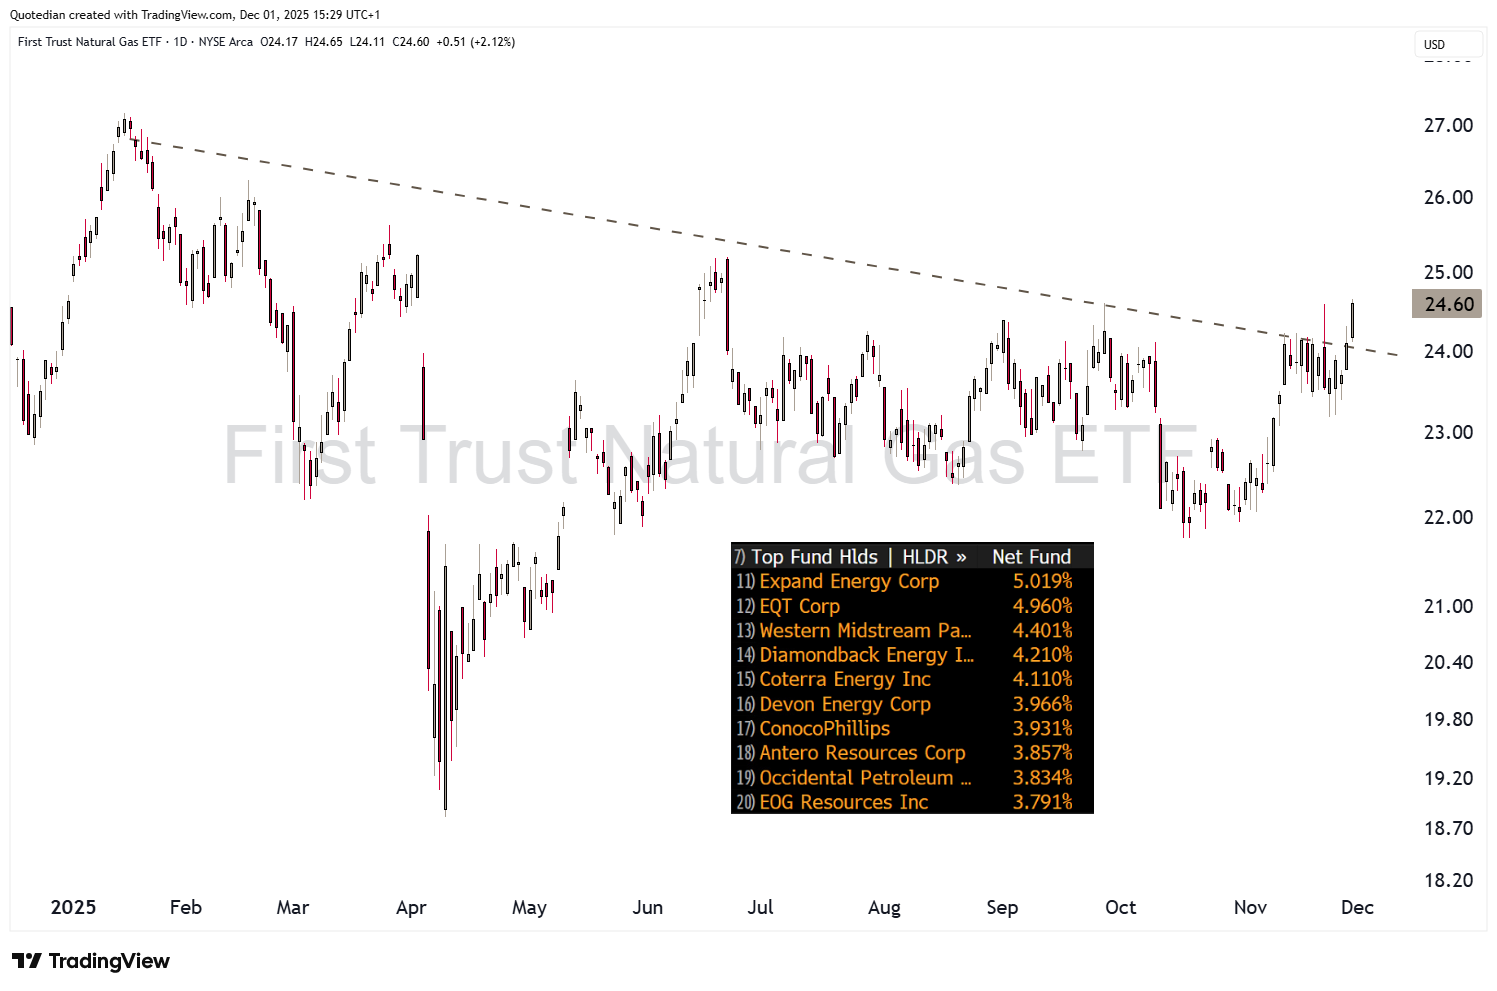
Or the First Trust Natural Gas ETF, which just seems to be breaking higher, for a broader exposure to the theme:
Interested to learn more and/or become a client? Ping me here:
That’s all for this week - remember to catch at least one of the Runaway Trains as long as the continue to roll!
May the trend be with you,
André

In reality, you need no other Disclaimer than the one above, but just in case:
Everything in this document is for educational purposes only (FEPO)
Nothing in this document should be considered investment advice
Investing real money can be costly; don’t do stupid shit
Leave politics at the door—markets don’t care.
Past performance is hopefully no indication of future performance
The views expressed in this document may differ from the views published by Neue Private Bank AG