“There is no risk-free path for monetary policy.”
— Jerome Powell
DASHBOARD
(as per market close 31/10/2022)
CROSS-ASSET DELIBERATIONS
Today’s Quotedian reaches you deliberately a bit later - mostly. As it is a public holiday for many of you, including me, and today’s issue is dedicated to the month just gone by, timeliness is of lesser importance. Or so I hope.
Anyway, before diving in, a quick shout-out to two list members working at a financial information provider called Bloomberg. Thanks to Nick’s and Kyrill’s personal involvement and incredible persistence, I finally got access to one of their fine terminals during my current TRANSITORY status. And speaking of Bloomberg, for those of you living in and around the Luxembourg area, the company is organising its annual Investment Summit 2022, with topics discussed ranging from macroeconomics to machine learning and thematic investing. If you are in the area, join the summit (it’s free!) and ping me for a meet&greet. Click on the picture below to sign up online:
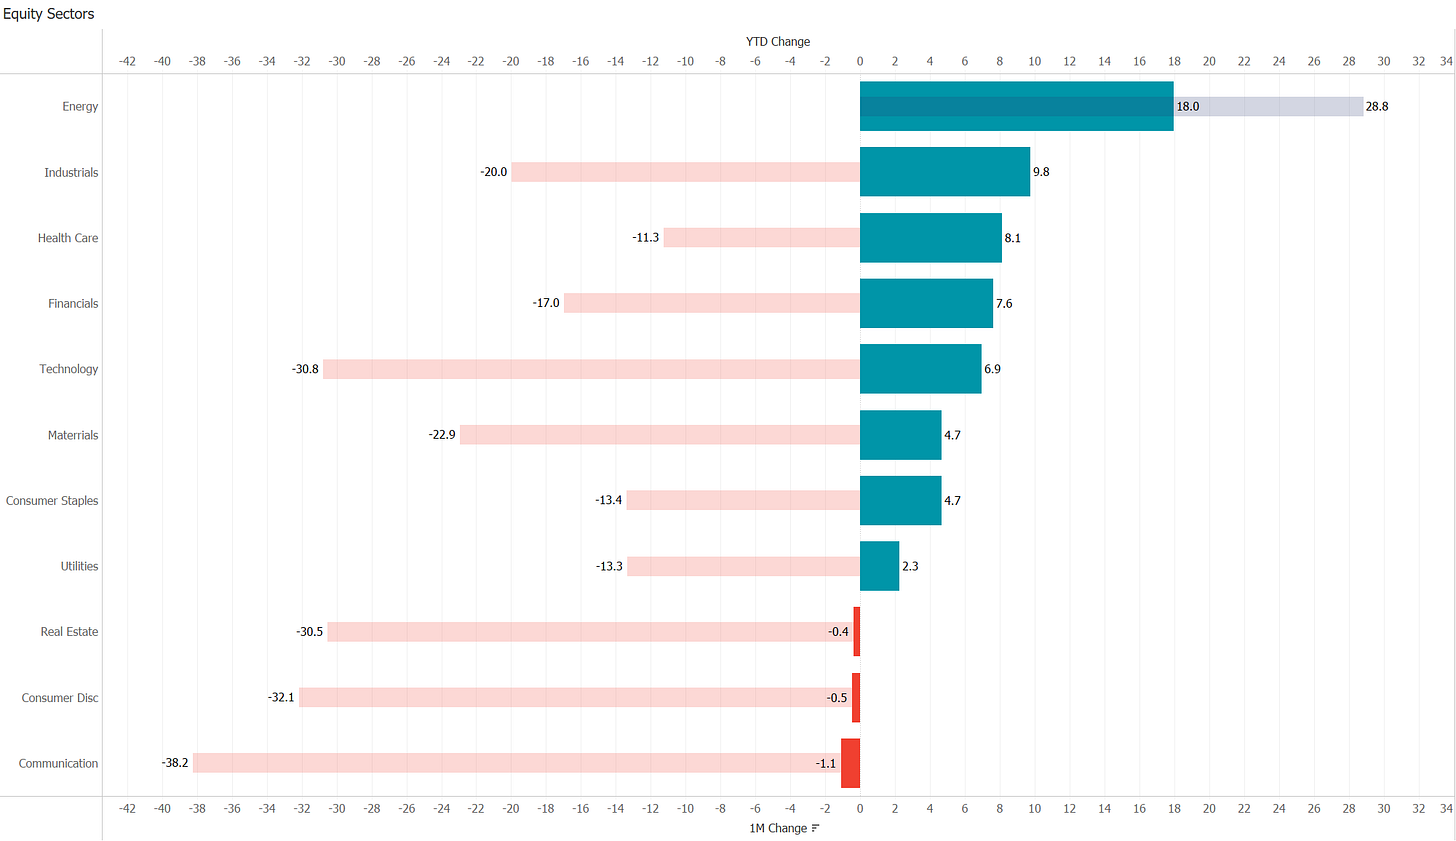
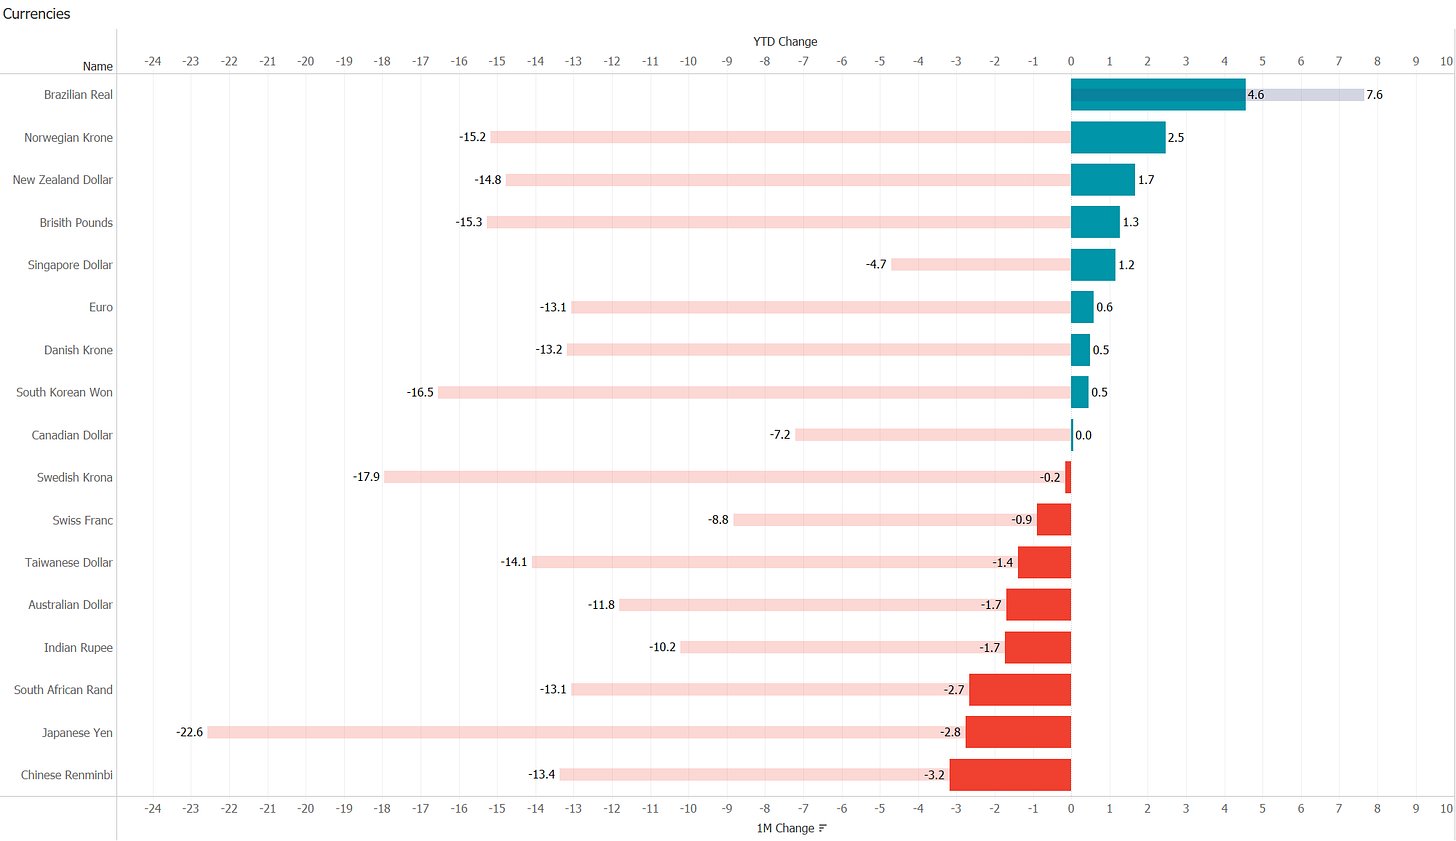
As usual, during our monthly round-up editions, the fat bars are the monthly %-performance of the asset under review, via the thinner, semi-transparent bars are the percent performances measured year-to-date. Also, as usual, I will throw in some monthly charts for (the longer-term) perspective. Enjoy!
Starting with equities, finally, October has brought some relief to most beleaguered global stock markets:
Is October turning out to be that bear market killer once again? Not to be discussed today, but clearly, as we discussed during the October 14th issue of The Quotedian (“Jaw Dropping”), this month may not have seen THE bottom but definitely A bottom.
Looking at the monthly candlestick chart of the S&P 500, we note that for now, the 200-week moving average, which seems to have been of importance in this secular bull rally since 2009, as held (ignoring the 2020 COVID panic moment):
BUT, the pattern of lower lows and lower highs of the current cyclical bear market is also still in force … the next two months could be decisive from a technical point of view.
The STOXX Europe 600 index had also a very decent month, but also still trades within the confines to the cyclical bear. Additionally, stocks in Europe struggle to make any collective net progress - for 20 years and counting!
Sticking out like a sore thumb is of course the performance in China Mainland and Hong Kong:
Whilst both markets are very cheap as measured by several factors, any investor tempted to try to catch the falling knife is putting himself in danger of getting cut.
Checking in on equity sector performance for October and the year, my argument that strength begets strength continues to hold up very well:
Energy stocks, here measured by the SPDR Energy Select ETF (XLE), are up over 200% since the WTI hit a negative USD40 price in April 2020:
The crazy thing is, that in relative terms (in the follow versus the S&P 500) there is still plenty of room:
and the weight of the energy sector continues to be less than 5% of that same index.
Or let’s have a look at industry behemoth ExxonMobil:
Up 82% year-to-date and breaking out to new all-time highs this month and … and …. and…. please take a seat, all this with a P/E of 9x and a dividend yield double that (~3.5%) of the S&P 500.
Not to pick on anyone in particular, but Tesla for example is down 35% since the beginning of the year and still sports a P/E of 70x and … well, no dividend yield.
But let’s not get emotional and turn to fixed-income markets, which produced finally some small positive monthly returns, in a mix of lower yields and narrowing credit spreads:
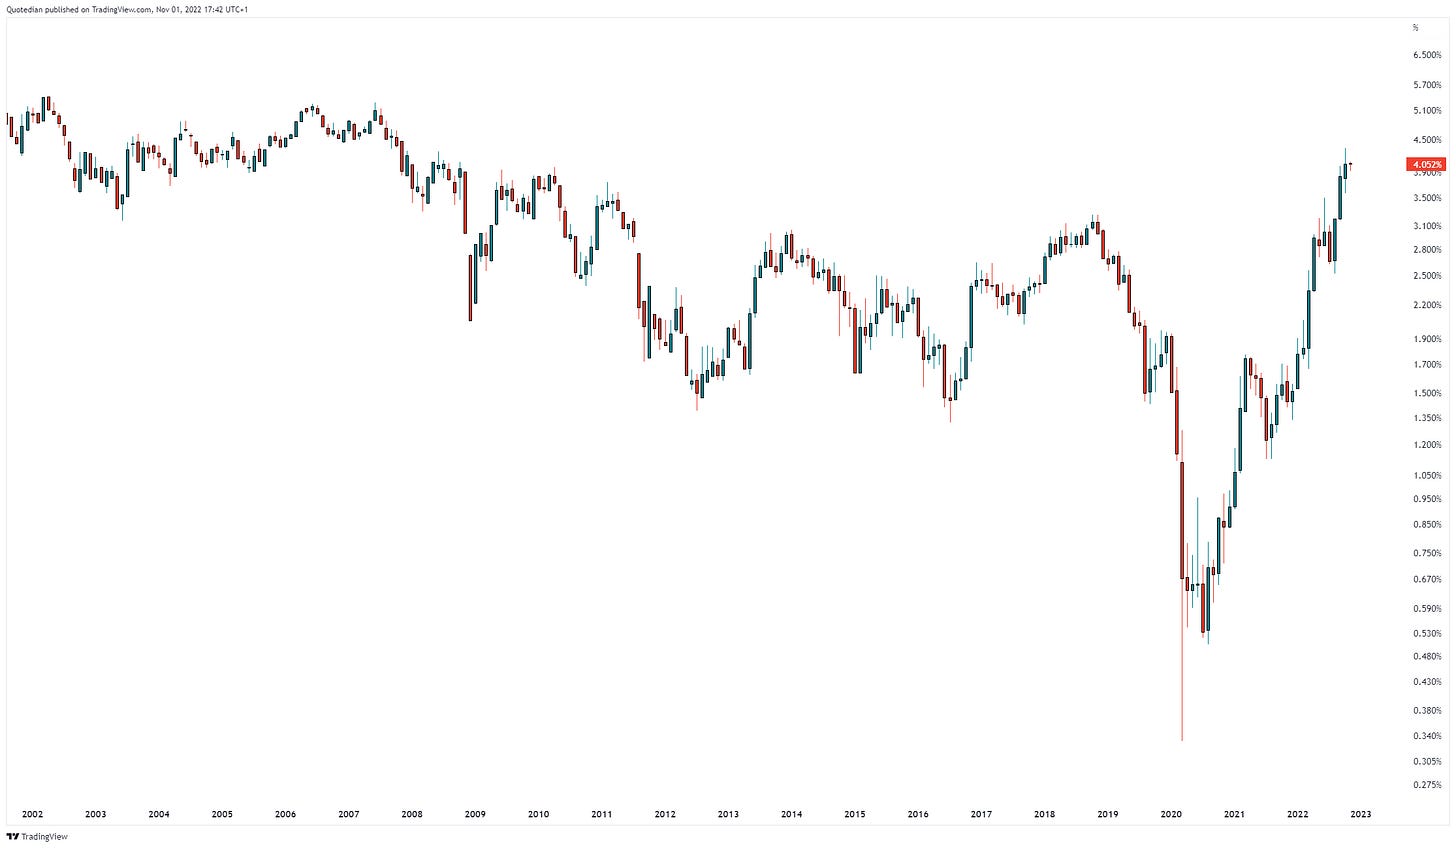
Looking at some monthly charts again and starting with the US 10-year treasury yield, the word ‘parabolic’ still comes to mind:
Not sure where this will stop, but clearly tomorrow’s FOMC meeting will be the most important one ever … since the last one. The 75 basis point hike seems a given, but investors will still seek any hints on a slowdown in the hiking pace (I didn’t write Pivot! Shoot, I just wrote Pivot…). As we discussed last Friday, it is not an easy task for the Fed, keeping in mind that the true policy error was committed last year.
Looking at European rates and using the German 10-year Bund as a proxy, the long shadows on the October candle are witness to how much ‘fun’ the month must have been to bond traders:
The ECB is probably in an even less enviable situation than the Fed (if at all possible), with inflation running from high to high at a frightening pace,
whilst the Eurozone PMI has moved firmly into the contraction (<50) zone,
and consumer confidence went for a bottle of something strong down in the cellar:
As fore-mentioned, credit spreads have largely narrowed during the month of October, but remain relatively elevated:
Next, we have a look at currency markets, which are definitely seeing their most ‘exciting’ year in a long time. Verus the US Dollar, global currencies have performed as follows during the month just gone by and YTD:
In Spanish you would say “ni fu, ni fa” and I think you understand what that means.
Let’s look at some (monthly) charts then. Here’s the US Dollar index (DXY):
Stalling yes, but to do what? Consolidate, catching breath before moving higher again? Or reversing? What’s your view?
Here’s the EUR/USD chart to maybe help you with the poll above:
Hhhmmm…
Maybe the USD/JPY chart will give some hints:
Or USD/CNH (Renminbi):
Last but not least, let’s review performances in the commodity space:
As usual crazily volatile, but I would suggest not losing sight of the big picture:
This is the Bloomberg Commodity Index and of course contains a lot of different commodities, which all have different reactions to different economic cycles and so forth. But, keep in mind that all commodities in this index are measured in US Dollars. And now, think back to what the US Dollar has done over the past two years. Now imagine, that the answer to our poll question above is the second one … this is just one of two major reasons to remain constructive on this asset class, the other being chronic underinvestment over the past decade. IMHO.
Ok, some more and then we hit the send button. Here’s Gold, which has failed as an inflation and a geopolitical insecurity hedge (at least measured in USD):
Not an awfully constructive chart right now, so let’s stay tuned …
Here’s the monthly chart on oil (Brent):
What is going to happen here, once the US stops reducing the SPR (Strategic Petroleum Reserve) by a million barrels a day, either because the reserves are empty or the mid-term elections are over? The latter has a slight chance of happening first …
Just before we sign off for today, please take note that there will be no Quotedian tomorrow (but follow The Quotedian on the Twitter-handle @TheQuotedian for any ad-hoc updates), and there is a strong likelihood that the next letter will not be published until Friday.
Take care in the meantime!
André
CHART OF THE DAY
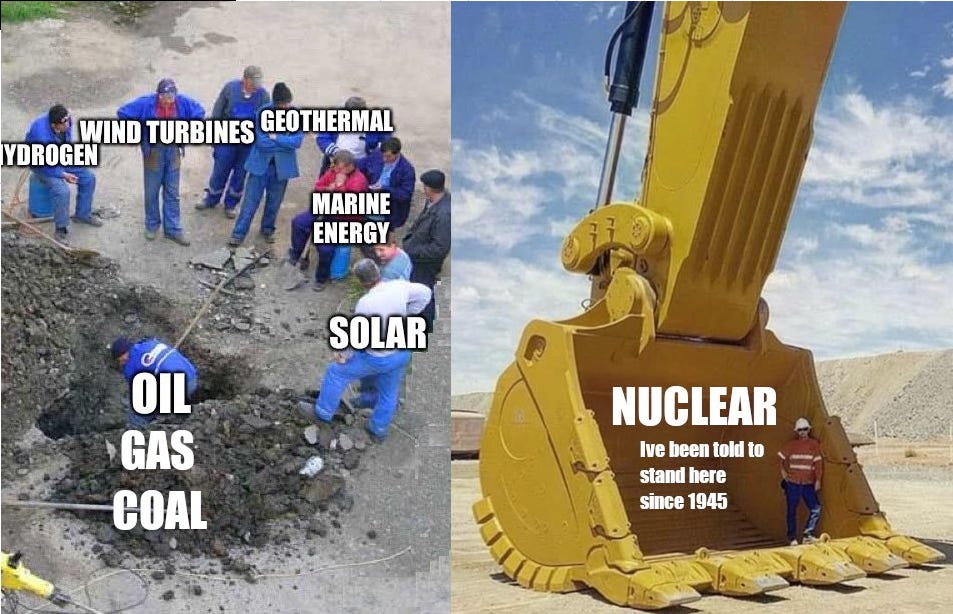
Too many charts already today, so let me complete the COTD with two funny memes making the round yesterday (at the risk of losing my last ESG friends remaining).
The first one was funny enough by itself:
But then some genius made the following addition:
🤣🤣🤣
Thanks for reading The Quotedian! Subscribe for free to receive new posts and support my work.
DISCLAIMER
Everything in this document is for educational purposes only (FEPO)
Nothing in this document should be considered investment advice
Past performance is hopefully no indication of future performance


Congrats, once again a very good picture of the market!
Hello André. This may be a silly question, but why is the USD/CNH chart that strange? Also I would like to thank you for your work with the Q😊🫡