Boringly Exciting
The Quotedian - Vol VI, Issue 34 | Powered by NPB Neue Privat Bank AG
"Today was a waste of a clean shirt and cab fare."
— Art Cashin
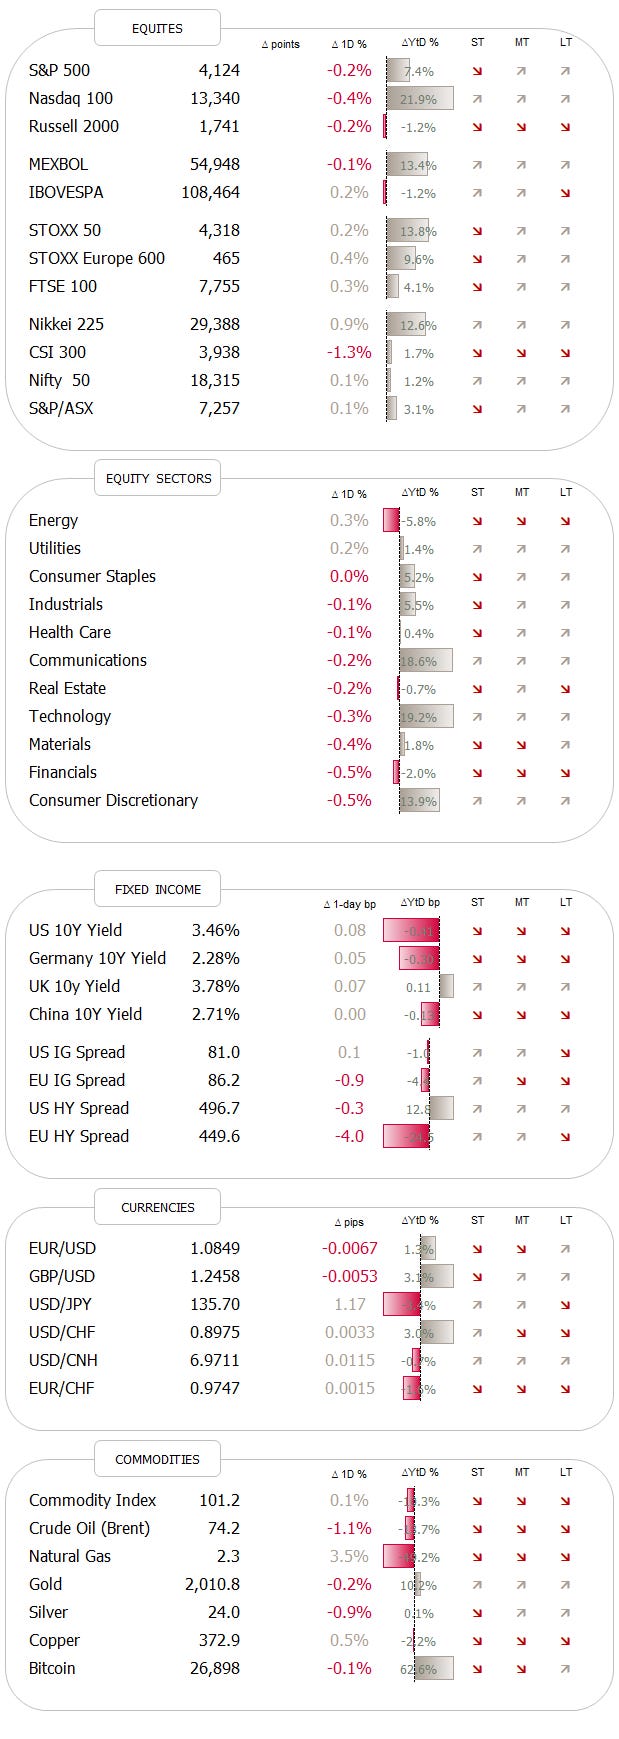
DASHBOARD
AGENDA
CROSS-ASSET DELIBERATIONS
Banks crashing … check
Crazy economic data … check
Fed still hiking … check
Debt ceiling unresolved … check
Geopolitical tensions continue to rise … check
etc., etc., etc.
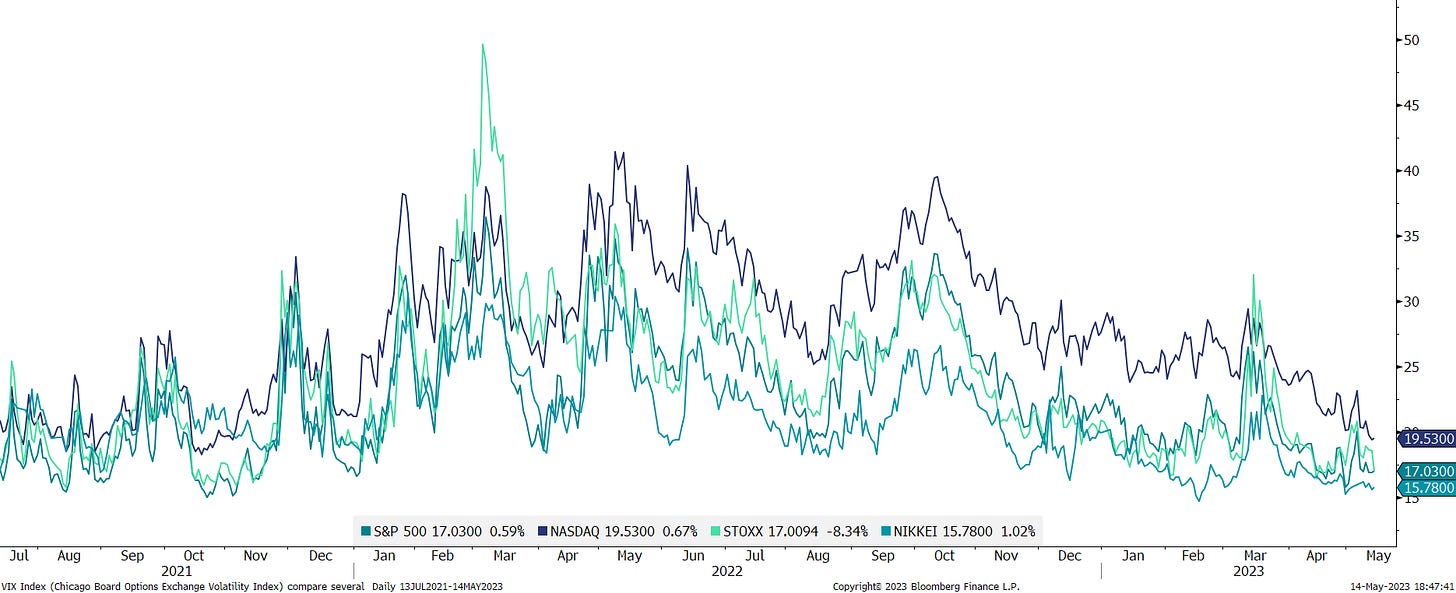
All the ingredients for an exciting, fast-moving market environment are there, however, volatility, as measured by the VIX, is trading at levels not seen since autumn 2021:
And realized vol feels like … well, zero.
Hence, in what is becoming quickly the “boringest exciting market”, we will have our usual weekly market round-up, but also have a look at some things that could go wrong over the coming weeks and months.
Remember, that all views expressed are mine and even that only barely so. If you’d lock me up in a room with myself to have a bull-or-bear debate, I’d probably serve you at least three opinions (bull, bear and … kangaroo, of course!)
Enough bla, bla, let’s get today’s show started …
The good old Quotedian, now powered by Neue Privat Bank AG
NPB Neue Privat Bank AG is a reliable partner for all aspects of asset management and investment advice, be it in our dealings with discerning private clients, independent asset managers or institutional investors.
Starting with equities, the ‘felt’ low volatility environment does indeed manifest itself in the performance table:
Of the twenty key benchmark indices we observe every week, sixteen had a weekly move of one percent or less.
The S&P 500 continues without resolve in any particular direction, driving on a big, fat road to nowhere at various fractal degrees, as discussed in last Sunday’s letter.
However, if we take a look under the hood, the 5-day heat map of the S&P 500 will reveal that it continues to be a index heavy-weights which are keeping market afloat:
This is also revealed when comparing the capital-weight index (SPY, grey) to the equal-weight version (RSP, red):
The SPY continues to be up 8% on a year-to-date basis, whilst the RSP is barely still in positive territory.
Or consider the Russell 2000 small cap index, sitting once again right on the top of an important pivot-point, where it was already … drumroll … five years ago!!
The low volatility environment is not contained to the US only. The following chart shows that investors are also relaxed in Europe and Japan:
But it looks like European stocks also found a sort of “lid” for the time being, topping out where it did before it dropped 25%+ last year:
Given these potentially toppish formations on some equity charts, combined with a low volatility environment, I am reminded of the wise adage, that
Hedge when you can, not when you have to.
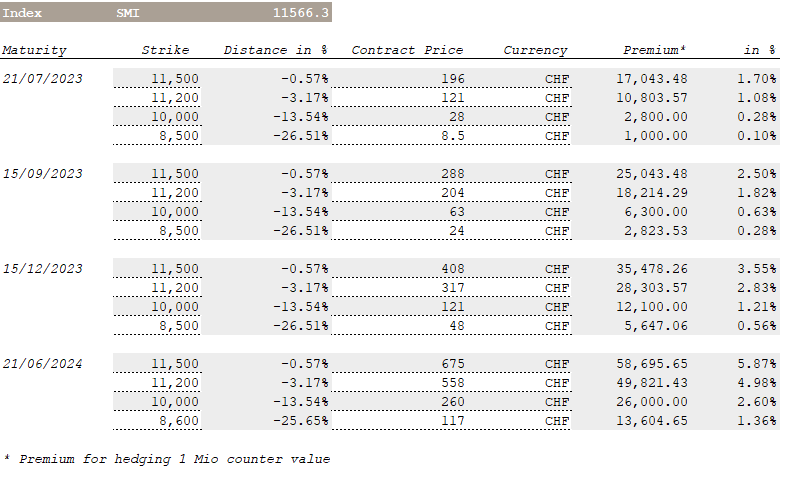
Discussing this internally on Friday, my colleague and friend Umbi put the following tables together, showing the “cost” of hedging different markets:
So, for example, if you have USD 1 million of US equity exposure and expect that the S&P 500 will drop by 10% into September, this would currently cost you approximately USD15,000 (or 1.5% of your capital) to hedge (highlighted red above).
Here are the same tables to hedge EUR and CHF 1 million for the Dax and the SMI respectively:
Back to US markets where the weekly survey of bulls and bears by the AAII (American Association of Individual Investors) shows that investors have moved away from extreme bearishness observed at the end of last year:
However, the bears did get a prominent new member in their camp:
“I’m sitting here staring in the face of the biggest and probably the broadest asset bubble, forget that I’ve ever seen, but that I’ve ever studied.”
— Stan Druckenmiller, Sohn Investment Conference, May 9th 2023
Listen to the entire interview here:
Turning to equity sectors, we quickly check global 5-day performance first:
Consumer discretionary and communication stocks continue to dominate, but a relative rotation graph (RRG) reveals an interesting change in leadership:
Tech and communications are still in the best quadrant (top right), but are clearly heading towards the bottom right (weakening), whilst defensive sectors such as utilities and consumer staples are gaining traction. This would suggest that investors are slowly positioning more cautiously.
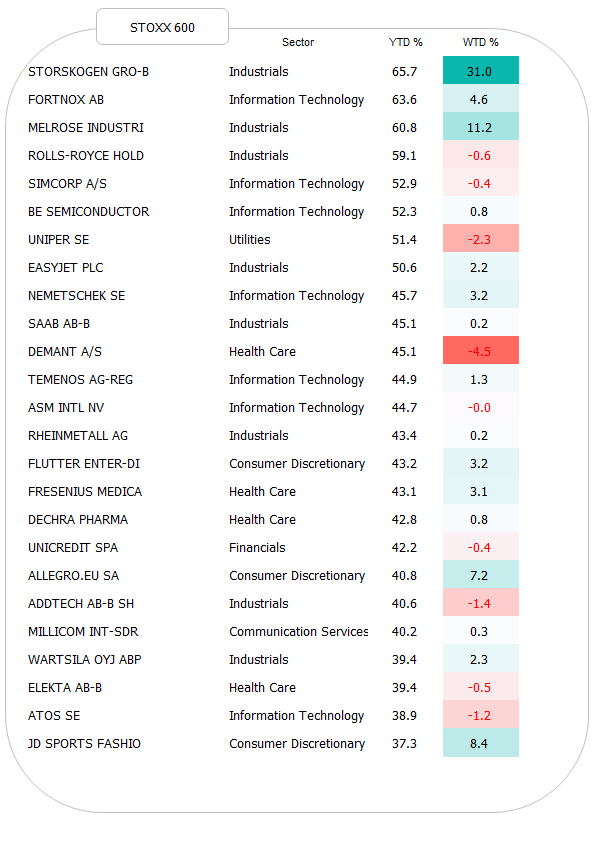
Finally, before turning to bonds, let’s have a quick look at the weekly performance of the top-performing stocks on both sides of the pond this year.
In the US, META took over leadership from NVDA this week:
The European (STOXX 600) list welcomed with Swedish investment group Storskogen a newcomer to the top 25:
Quite the week for Sweden then,
even though not for everything Swedish, where the real estate market seemingly halfs itself every other week. Here’s the chart of multi-segment (commerical and residential) real estate company Samhallsbyggnadsbolaget i Norden AB for example:
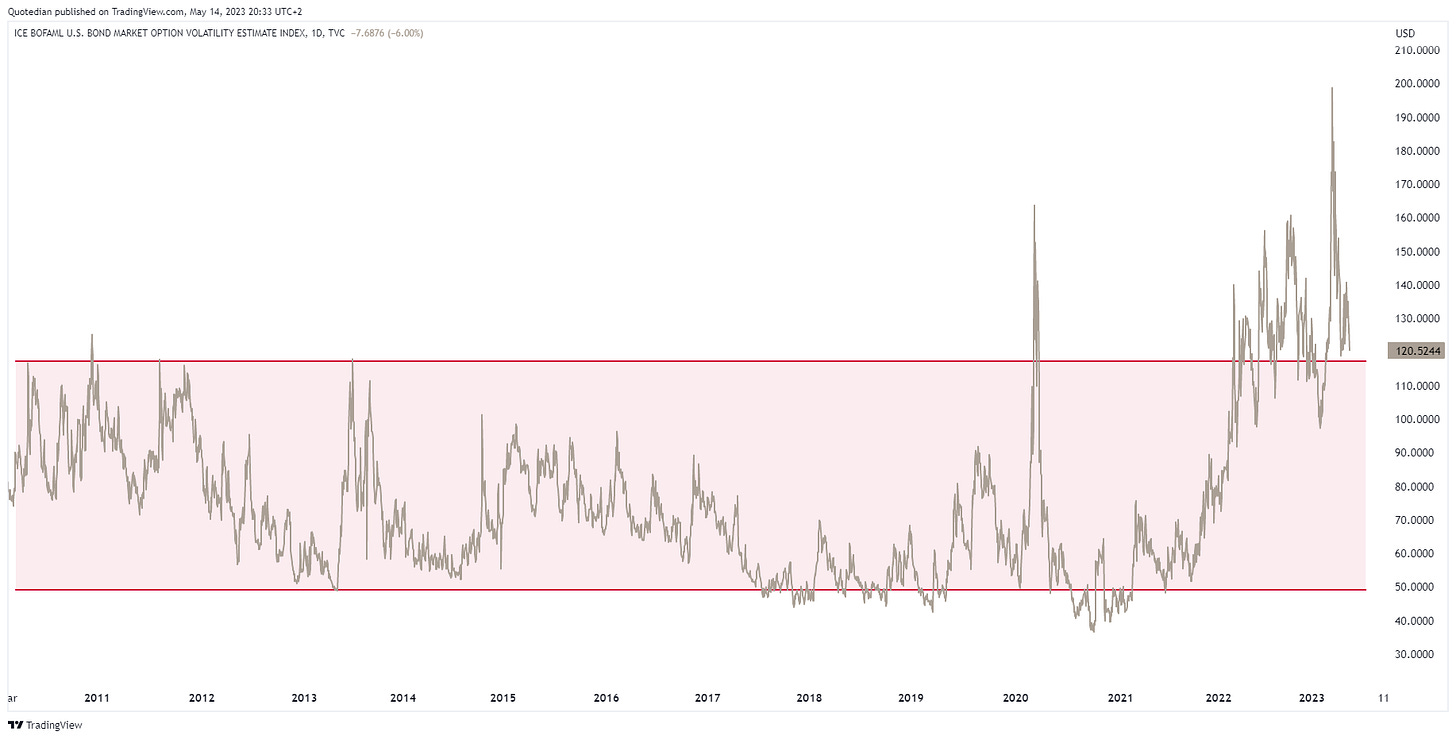
Turning to the fixed-income space, we note that the VIX-equivalent for bonds, the MOVE continues to be above historic ‘norm’, but has come down sharply in the past few weeks:
This newly found boredom is then also reflected in the weekly performance stat for the various segment of the bond market:
The chart of the US 10-year yield continues to be one, big, fat nothing-burger:
Whilst its European cousin, the Bund chart, continues to offer a possible shoulder-head-shoulder reversal pattern, with a break of the neckline (black dotted) implying a target zone at around 1.50%:
Turning to the debt-ceiling issue for a moment, this continues to be a risk that the equity market is largely ignoring. But not the Credit Default Swap market:
I truly think this will come back to haunt investors over the coming weeks. It is true that previous episodes did not necessarly mean a sell-off in equity markets (1995), but others brought career-breaking double-digit drops (-17% in 2011). Is there a chance for a US default? YES. It’s small, but it is. So, what to do? The fed funds futures market continues to imply four rate cuts here to year-end:
So we would need to load up on treasury bonds, right? But what about that default risk?
My suggestion here would be to buy some of what many consider (rightfully or not) to be the new risk-free investment: Apple.
Quite amazingly, AAPL’s market cap now exceeds that of the entire Russell 2000 small-cap index:
But of course, I am not proposing to buy Apple shares to hedge for a US debt-ceiling-induced default … but how about Apple bonds? Arguably, with $160 billion in cash and an EBIT/Interest expense ratio of >40, there’s less credit risk than for the US government …
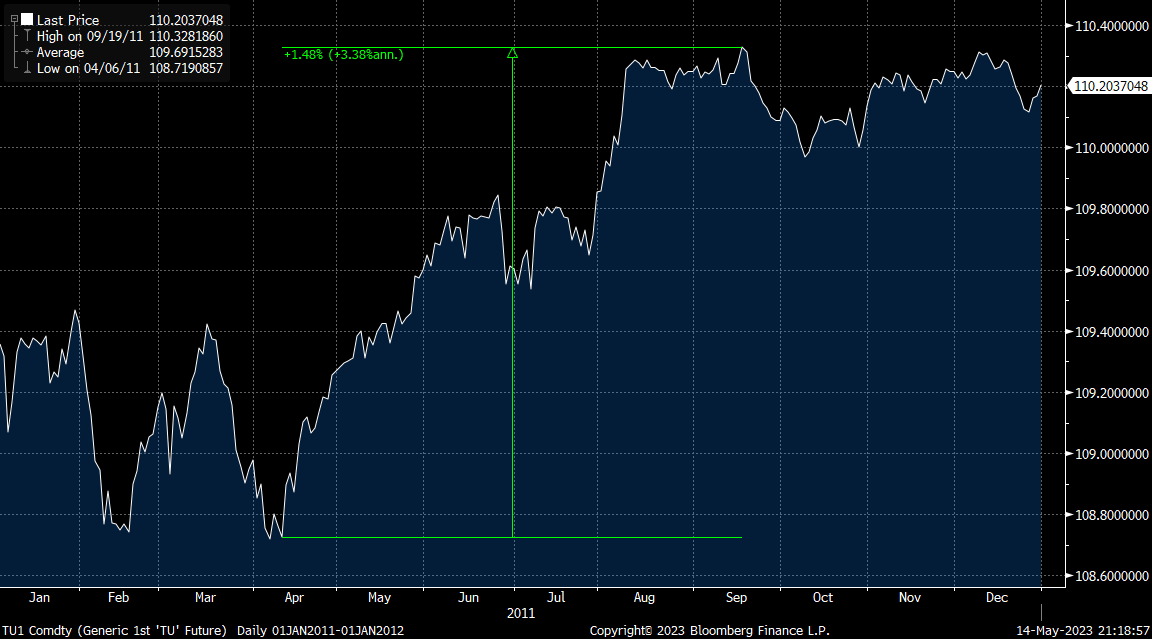
In Euro, you can buy a November 2025 zero coupon Apple bond for slightly more than 93, resulting in a 3% yield. Not bad. Plus, in 2011 for example, two-year US treasury bond yields dropped from around 0.80 to below 0.20, resulting in a nice total return for bonds:
Anyway, I need to cut short here, as Barça is about to lift it 27th Liga Championship trophy.
But this leaves me with a lot of material for next week, so make sure no to miss out any of the upcoming editions:
Visca Barça,
André
CHART OF THE DAY
And now to something completely different…
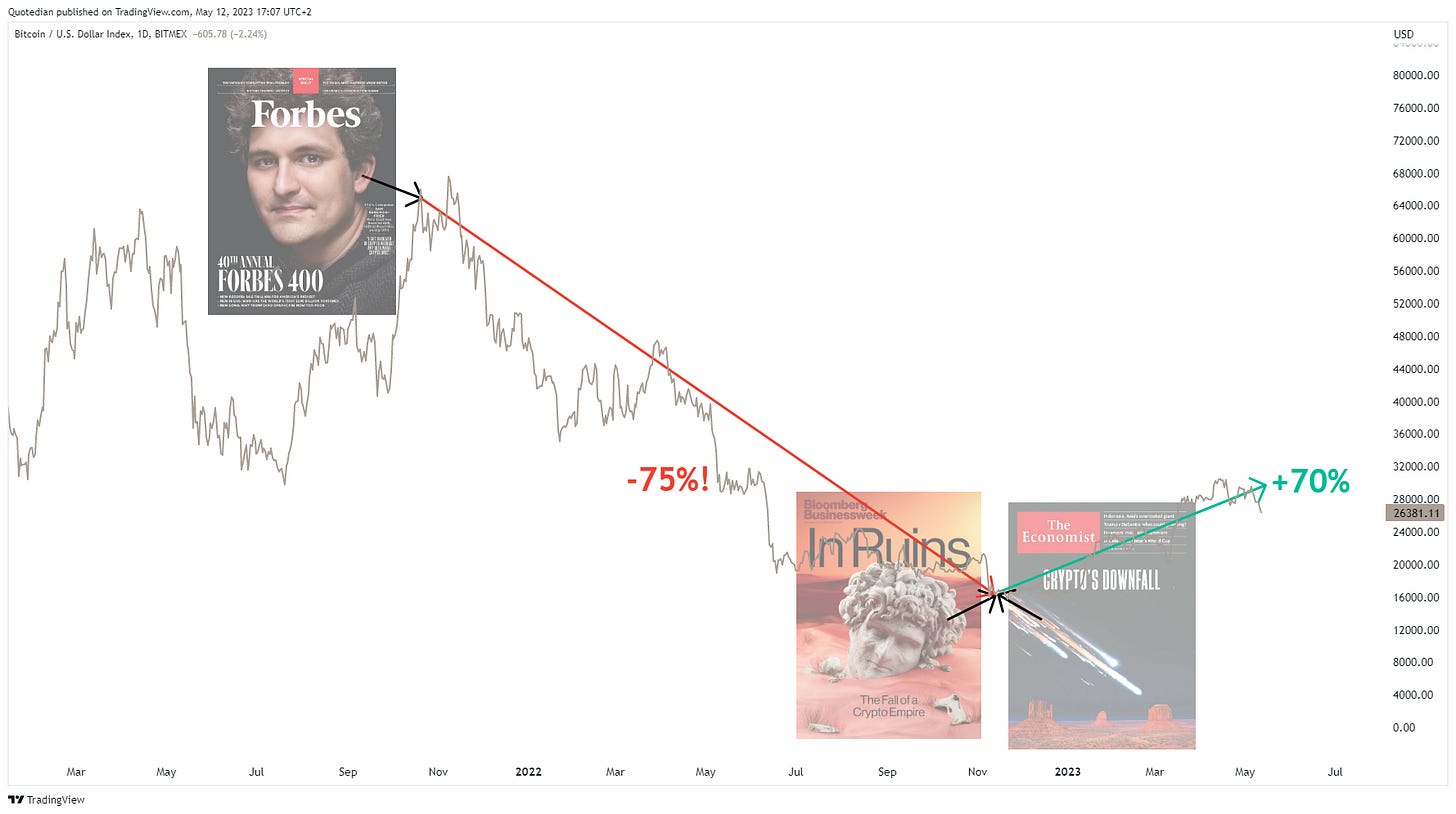
Remember that we used the “Magazine Front Cover Contrarian Indicator” successfully in the past to identify important turning points for assets?
For example last year (11/10/23) here on the US Dollar:
The Dollar Index subsequently dropped in excess of eleven percent, which is quite the move for a THE currency.
Or twice on Bitcoin, also last year here and here for this fine outcome:
Well, guess what, courtesy of “The Economist”, we just got a speculative buy signal on Chinese stocks:
Should we get a similar cover from another magazine over the coming two or three weeks, we can change the speculative buy to a “safe buy”:
In that context, there was also the following fantastic chart from our good friends at Gavekal Research, showing that state-owned companies have been outperforming the rest of the market in China over the past few months:
A “defensive” way to invest in Chinese equities?
Thanks for reading The Quotedian! Subscribe for free to receive new posts the moment they are published.
DISCLAIMER
Everything in this document is for educational purposes only (FEPO)
Nothing in this document should be considered investment advice
The views expressed in this document may differ from the views published by Neue Private Bank AG
Past performance is hopefully no indication of future performance


